This is “Basic Concepts of Taxation”, section 27.1 from the book Theory and Applications of Economics (v. 1.0). For details on it (including licensing), click here.
For more information on the source of this book, or why it is available for free, please see the project's home page. You can browse or download additional books there. To download a .zip file containing this book to use offline, simply click here.


27.1 Basic Concepts of Taxation
Learning Objectives
After you have read this section, you should be able to answer the following questions:
- What is the difference between a marginal and an average tax rate?
- How does the tax system redistribute income?
Before delving into the details of President Kennedy’s tax policy, we review the basics of personal income taxation. This review is not only helpful for your study of economics but also may be useful when you have to fill out your own income tax form. Even a quick glance at the 1040EZ form in Figure 27.1 "Easy Tax Form" suggests that taxes are a very complex topic. Indeed, the US federal tax code governing income taxes alone runs to thousands of pages. The taxes that you pay depend on your adjusted gross income (line 4), which is the income you receive from a variety of sources (the main components noted on the return are wages, interest income, and unemployment compensation). But there is also a “standard deduction” and an “exemption” (line 5)—for a single person in 2010, these totaled $9,350. For the EZ form, your taxable income is given as the following:
taxable income = adjusted gross income − (deduction + exemption).If your financial situation is very simple, you can file this EZ form. However, if you receive income from other sources (such as dividends on stocks), or if you wish to “itemize” your deductions (for payments of interest on home mortgages, dependent children, property taxes, and so forth), you have to file a more complicated form, often with several other forms containing supplementary information. Thus the calculation of adjusted gross income and deductions can be quite complex. For all individuals, however, the basic relationship still holds:
taxable income = adjusted gross income − (deductions and exemptions).Once you know your taxable income, there are then different tax rates for different income levels.Even this is not quite the whole story. There are various tax credits for which some individuals are eligible, and there is also something called the alternative minimum tax, which must be calculated.
Marginal and Average Tax Rates
From the perspective of macroeconomics, this complexity is daunting, particularly when we remember that the details of the tax system vary from country to country and year to year. The income tax is evidently not a simple thing that can be incorporated in a straightforward way into our frameworks. We cannot hope to incorporate all these features of the tax code into our theory without getting completely bogged down in the details. If we are going to make sense of how taxes affect consumption behavior, we must leave out most of these complicating elements. The challenge for economists is to decide which features of the tax system are critical for our analysis and which are peripheral and can be safely ignored.
One noteworthy feature of the income tax system is that not everyone pays the same amount of tax. Table 27.1 "Revised 2010 Tax Rate Schedules" shows the income tax schedule for the year 2010 for a single taxpayer.There are other schedules for members of a household filing jointly. These and related tables are available from “Forms and Publications,” Internal Revenue Service, accessed September 20, 2011, http://www.irs.gov/formspubs/index.html. It indicates how much tax a must be paid for a given level of taxable income.
Table 27.1 Revised 2010 Tax Rate Schedules
| If Taxable Income | The Tax Is Then | |||
|---|---|---|---|---|
| Is Over (in US$) | But Not Over (in US$) | This Amount (in US$) | Plus This (%) | Of the Excess Over (in US$) |
| 0 | 8,375 | 0 | 10 | 0 |
| 8,375 | 34,000 | 837.50 | 15 | 8,375 |
| 34,000 | 82.400 | 4,681.25 | 25 | 34,000 |
| 82.400 | 171,850 | 16,781.25 | 28 | 82.400 |
| 171,850 | 373,650 | 41,827.25 | 33 | 171,850 |
| 373,650 | — | 108,421.25 | 35 | 373,650 |
To use this table, you must first find your taxable income. Suppose it is $20,000. Your tax is then determined from the second row of the table. You would owe 837.50 + 0.15 × (20,000 − 8,375), which is $2,581.25.
Figure 27.3 shows the relationship between taxes and income implicit in the tax schedule summarized in Table 27.1 "Revised 2010 Tax Rate Schedules". This figure shows the amount of tax you must pay given your adjusted gross income (upper panel) and your taxable income (lower panel). We see two key facts:
- As an individual’s income increases, he or she pays more in tax (the line slopes upward).
- As an individual’s income increases, he or she pays a larger fraction of additional income in tax (the line becomes steeper at higher levels of income).
This leads us to two ways to think about the tax schedule a household faces.
Figure 27.3
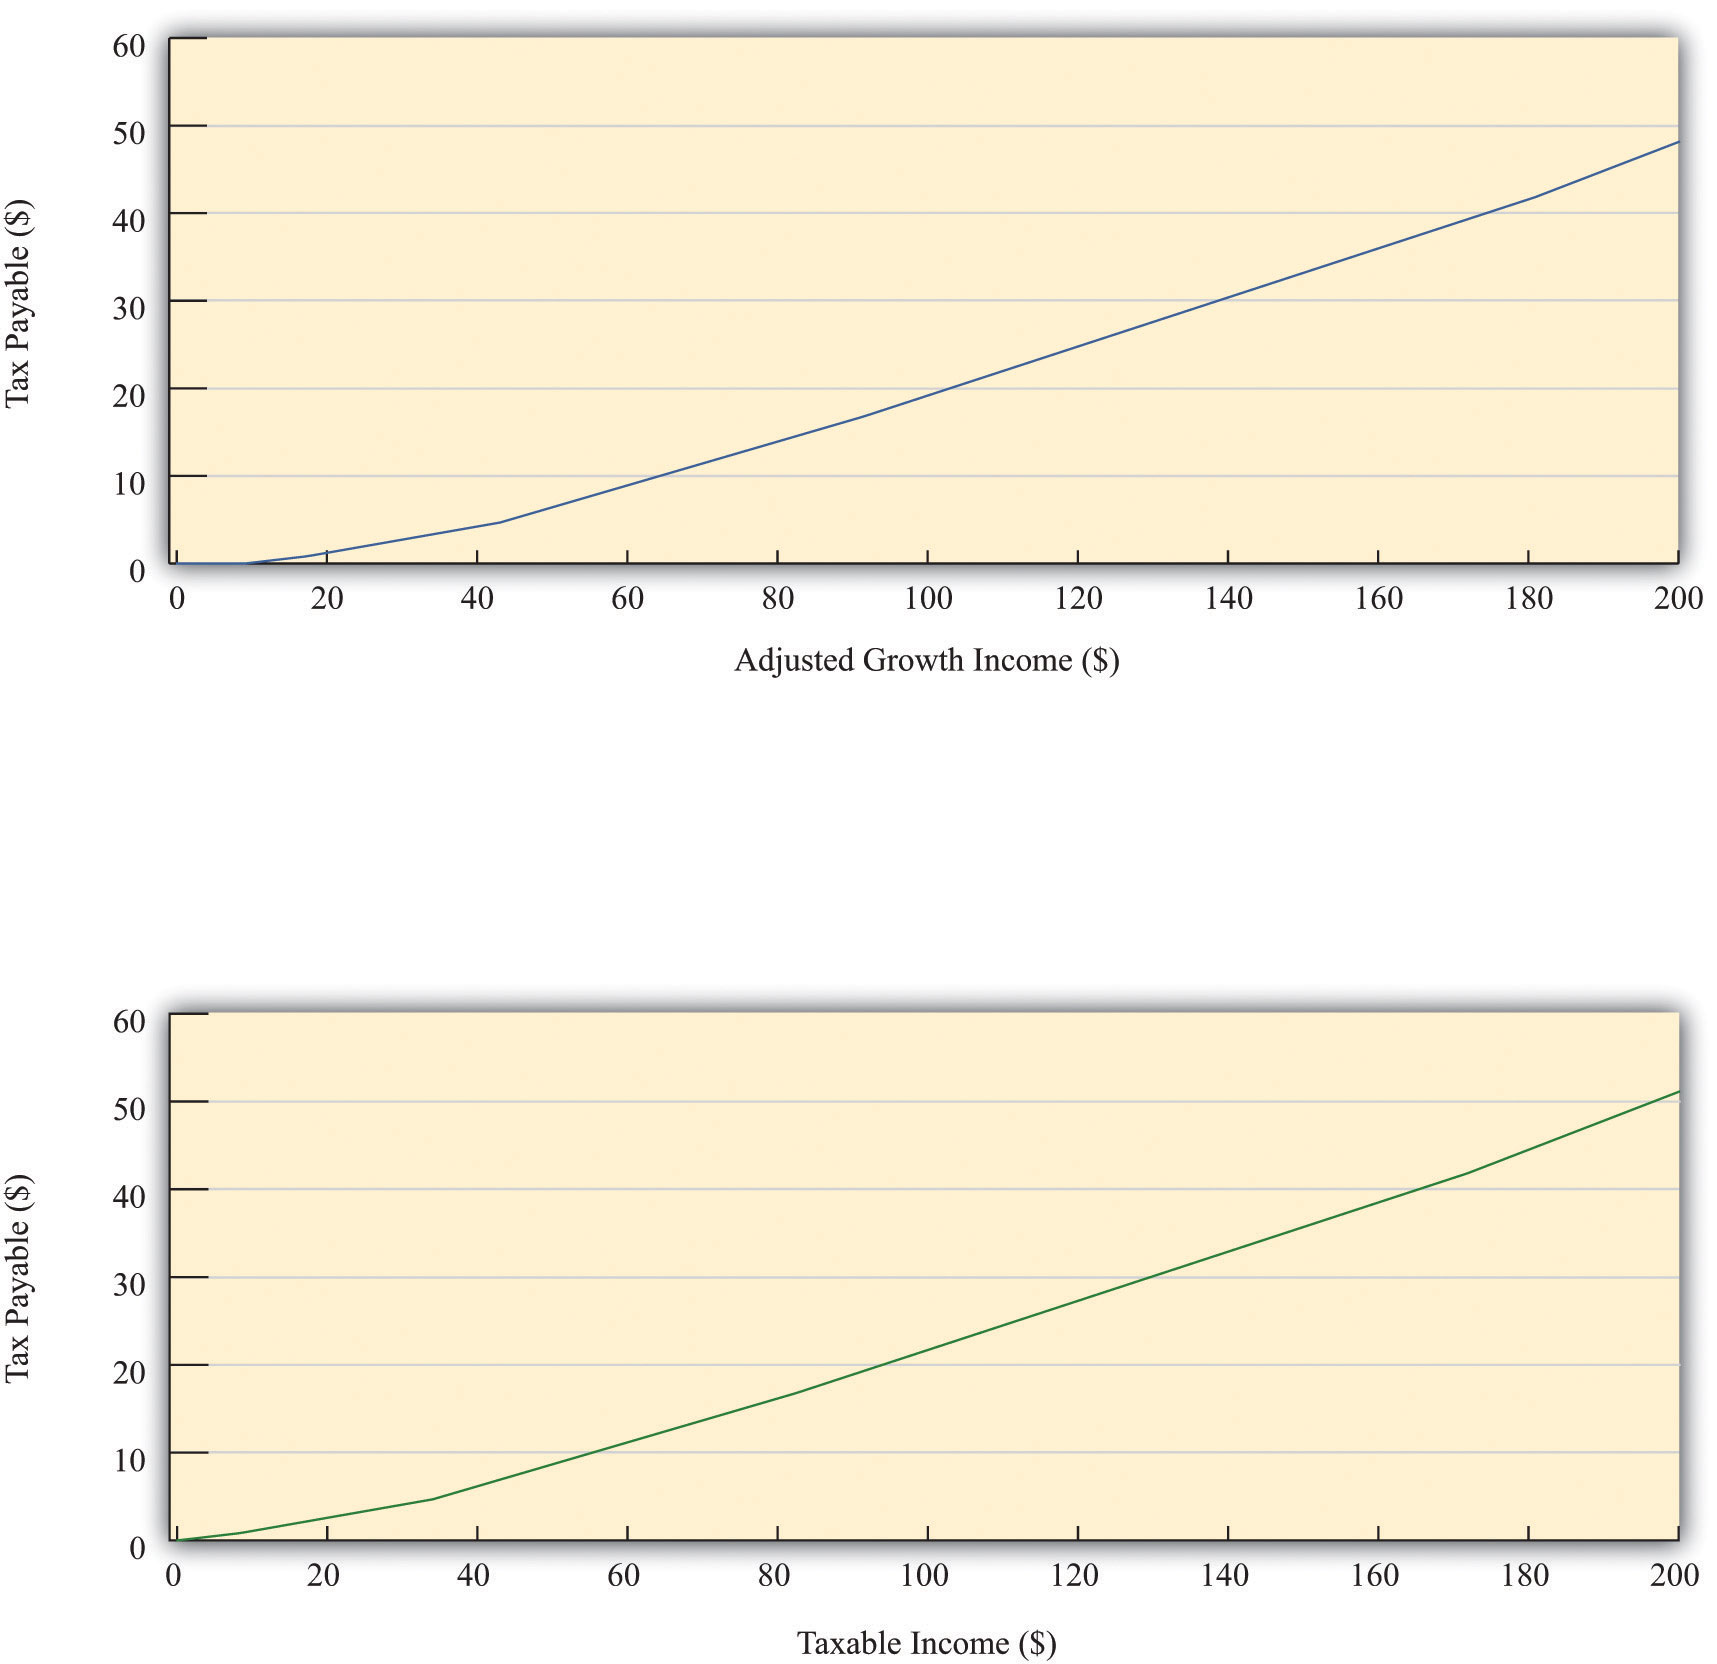
The figure shows the amount of tax owed by a single individual in the United States who takes the “standard deduction.” The upper panel has adjusted gross income on the horizontal axis, whereas the lower panel has taxable income on the horizontal axis.
As shown in Table 27.1 "Revised 2010 Tax Rate Schedules", there were six different tax rates in effect in 2010, ranging from 10 percent for low-income individuals to 35 percent for high-income individuals. The tax rates in the fourth column are the marginal tax ratesThe tax rate paid on additional income. since they represent the tax rate paid on marginal (that is, additional) income. Thus higher income households pay higher marginal tax rates. The marginal tax rate can be seen graphically as the slope of the line in Figure 27.3.
We are often interested in knowing what fraction of an individual’s income goes to taxes. This is called the average tax rateThe ratio of total taxes paid to income.. Returning to the example we calculated earlier, if you have an income of $20,000 and thus pay taxes of $2,581.25, your average tax rate is equal to , or 12.9 percent. The marginal tax rate of 15 percent is greater than the average tax rate of 12.9 percent. There is a difference between the tax you pay on average and the tax rate charged on the last dollar of income.The average tax rate can also be given a graphical interpretation. It is the slope of a line from the origin to the point on the graph.
Leaving aside the details of exemptions and deductions, the essence of the income tax code is captured in the table and figures we have just presented. Even these, however, are quite complicated. We want to build income taxes into our framework of the economy, so it would be nice if we could decide on a simpler way to represent the tax code. The art of economics lies in deciding how to take something complicated, like the US income tax code, and represent it in as simple a way as possible while still retaining the features that matter to the problem under discussion.
Looking at Figure 27.3, we can see that the relationship between taxes paid and taxable income looks approximately like a straight line. It is not exactly a straight line because it becomes steeper as marginal tax rates increase. For our purposes in this chapter, however, it is a reasonable simplification to represent this relationship as a line—that is, to suppose that the marginal tax rate is constant.
In addition, we ignore the standard deduction and exemption. That is, we suppose that people start paying taxes on their very first dollar of income. Thus we suppose that
taxes paid = tax rate × income.Representing the tax schedule this way is fine if we want to examine the economy as a whole and are not particularly concerned with the way in which taxes affect different households. We use this simplified model of the tax system at various times in this chapter.
Effects of Changes in Tax Rates
We can use this simple model of the tax system to see how a change in the income tax rate affects both individuals and the economy as a whole. Suppose there is a cut in the tax rate. Since taxes paid = tax rate × income, the immediate impact is to reduce the amount of taxes households pay: for a given income, a reduction in the tax rate reduces taxes paid. This means that disposable incomeIncome after taxes are paid to the government., which is the income left over after paying taxes and receiving transfers, increases.
What do households do with the increase in disposable income? A likely answer is that a typical household spends some of this extra income and saves the remainder. If all households follow this pattern, then the increased spending by each household translates into larger consumption in the aggregate economy. At this point, the power of the circular flow of income will take over, and the level of income and output in the economy will increase even further.
Toolkit: Section 31.27 "The Circular Flow of Income"
You can review the circular flow of income in the toolkit.
As the economy expands, the amount of taxes paid starts to increase. In other words, one consequence of a tax cut is that the tax base (income) expands. The ultimate effect of a tax cut on the overall amount of taxes paid depends on both this expansion of the tax base (income) and the reduction of the tax rate.
Taxes and Income Distribution
The effects of a tax cut are not the same for everyone. Changes in the tax code affect the distribution of income. If we want to understand such effects, however, it is a mistake to use our simple model of the tax system. We must instead examine how marginal tax rates are different at different levels of income. Suppose that marginal tax rates increase with income, which means that average tax rates increase with income. Higher income households then pay a larger fraction of their income as taxes to the government. As a result, the distribution of income after taxes is more equal than the distribution of income before taxes.
Imagine that we take two individuals with different levels of income and calculate their tax payments and after-tax income. Suppose that the first individual earns $20,000 per year and the other earns $200,000. Table 27.2 "The Redistributive Effects of Taxation (in US$)" shows the amount of tax each pays and their income after taxes, based on the tax schedule from Table 27.1 "Revised 2010 Tax Rate Schedules". Notice from the table that the marginal tax of the high-income household is 33 percent, compared with the 15 percent marginal tax of the low-income household. The total tax paid by the high-income individual is $51,116.75, which is almost 20 times the tax paid by the low-income household. Whereas the pre-tax income of the richer household was 10 times greater than that of the poorer household, its after-tax income is 8.5 times greater.
Table 27.2 The Redistributive Effects of Taxation (in US$)
| Income | Tax Paid | Income after Taxes |
|---|---|---|
| 20,000 | 2,581.25 | 17,418.75 |
| 200,000 | 51,116.75 | 148,883.25 |
This example shows that the tax code redistributes income from high-income to low-income households. What is more, the redistribution does not necessarily stop here. We have not said anything about what the government does with the tax revenues it receives. If the government transfers all those revenues to low-income households, then the combined redistributive effect of taxes and transfers is even stronger.
When we talk about the effects of taxes on labor supply and disposable income, keep in mind that the size of these effects is different for households at different levels of income. These varying effects matter for the politics of tax cuts because lawmakers pay close attention to which income groups are affected by tax policy.
Key Takeaways
- The marginal tax rate is the rate paid on an additional dollar of income, and the average tax rate is the ratio of taxes paid to income.
- When the marginal tax rate is increasing in income, then the tax system redistributes from richer households to poorer households. In this case, after-tax income is more equal than income before taxes are paid.
Checking Your Understanding
- Use Table 27.1 "Revised 2010 Tax Rate Schedules" to calculate the tax you would pay if your income were $30,000.
- If taxes paid equal the tax rate times income, what happens to the average tax rate when the marginal tax rate changes?