This is “Three Important Markets”, section 19.3 from the book Theory and Applications of Economics (v. 1.0). For details on it (including licensing), click here.
For more information on the source of this book, or why it is available for free, please see the project's home page. You can browse or download additional books there. To download a .zip file containing this book to use offline, simply click here.


19.3 Three Important Markets
Learning Objectives
After you have read this section, you should be able to answer the following questions:
- What is the credit market, and what determines the interest rate?
- What is the labor market, and what determines the real wage?
- What is the foreign currency market, and what determines the exchange rate?
The financial crisis of 2008 began in the housing market. But as the excerpts at the beginning of this chapter make clear, its effects rapidly spread beyond that market. Those excerpts talked of credit, jobs, and the impact of the crisis on foreign countries. We now look at the knock-on effects of the crisis and, in the process, describe three key macroeconomic markets: the credit market, the labor market, and the foreign exchange market.These markets are used in several places in the book. In particular, we look at labor in Chapter 23 "Jobs in the Macroeconomy", and credit and foreign exchange in Chapter 24 "Money: A User’s Guide".
The Credit Market
A credit market (or loan market)A market that brings together suppliers of credit, such as households who are saving, and demanders of credit, such as businesses and households who need to borrow. is a market in which credit is extended by lenders to borrowers. These credit arrangements, also called loans, are a specific kind of contract. A simple credit contract specifies three things: (1) the amount being borrowed, (2) the date(s) at which repayment must be made, and (3) the amount that must be repaid.Of course, since credit contracts are legal documents, lots of other details will be written into the contract as well. Here we focus on the most important features of the contract.
To be specific, suppose you go to your bank to inquire about a loan for $1,000, to be repaid in one year. In this case the lender—the bank—is a supplier of credit, and the borrower—you—is a demander of credit. The higher is the repayment amount, the more attractive this loan contract will look to the bank. Conversely, the lower is the repayment amount, the more attractive this loan contract looks to you. The relationship between the current price and the future repayment can be summarized in a single number, known as the nominal interest rateThe number of additional dollars that must be repaid for every dollar that is borrowed..
Toolkit: Section 31.24 "The Credit (Loan) Market (Macro)"
The nominal interest rate is the number of additional dollars that must be repaid for every dollar that is borrowed. It is generally specified in annual terms; that is, it is the amount that must be paid per year.
For the one-year loan we are considering,
For example, suppose the repayment amount is $1,050. Then the left-hand side of this expression is 1,050/1,000 = 1.05. It follows that the nominal interest rate is 0.05, or 5 percent.
Financial markets are typically good examples of competitive markets. Loans are homogeneous, and there are potentially many buyers and sellers. So if we imagine that there are lots of banks that might be willing to supply credit, and lots of people like you who might demand credit, then we could draw supply and demand curves as in Figure 19.7 "A Market for $1,000 Loans". In this case, the units on the quantity axis are one-year $1,000 loans. The price on the vertical axis is the interest rate, which tells us the amount of the repayment per dollar loaned. The higher the repayment is, the more willing are banks to supply credit, so the supply curve slopes upward. The higher the repayment, the less willing are people to take out these loans, and so the demand curve slopes downward. If the repayment price were acceptable to you, you would “buy” one of these $1,000 loans. The equilibrium nominal interest rate is shown at the crossing of supply and demand.
Figure 19.7 A Market for $1,000 Loans
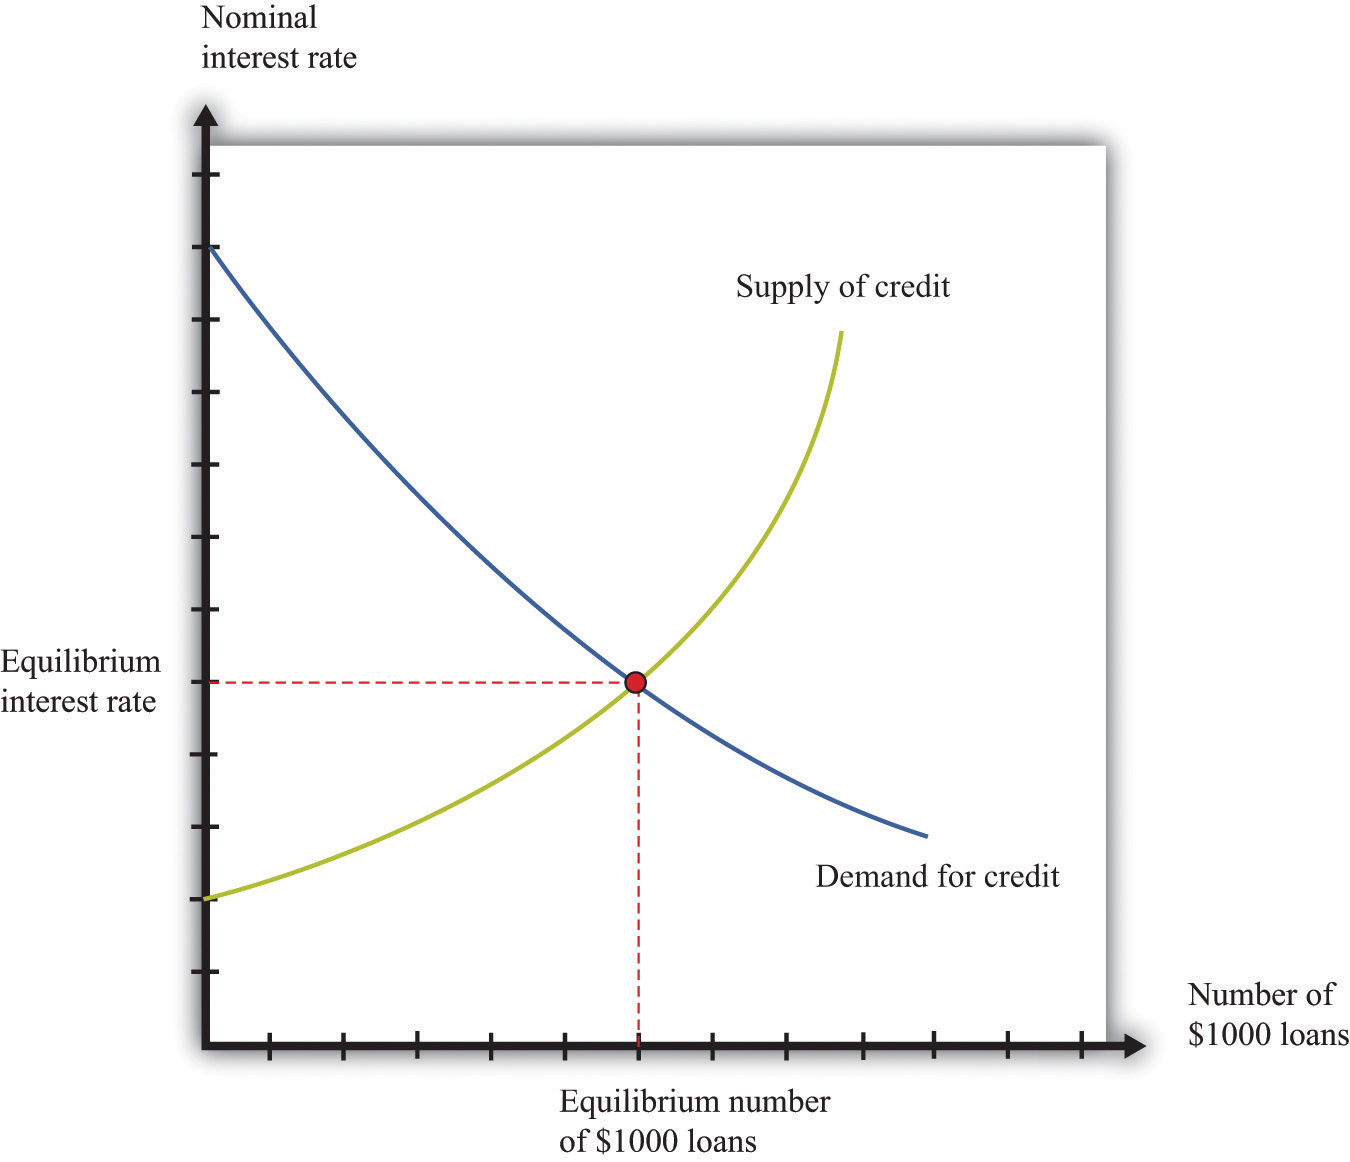
In this credit market, lenders offer $1,000 loans to borrowers. The equilibrium nominal interest rate is where the quantity of credit supplied equals the quantity of credit demanded.
The Credit Market in the 2008 Crisis
At the height of the financial crisis of 2008, credit became much more expensive—that is, interest rates increased. Why? As housing prices collapsed in the United States and elsewhere, a substantial number of mortgage loans became nonperforming. This means that borrowers were unable or unwilling to repay these loans and defaulted on them instead. In addition, because banks had sold and resold some of these mortgage loans, it was hard to identify which loans would be repaid and which would not. Some financial institutions that were holding a lot of bad loans went bankrupt, and others were in danger of going under as well.
As a consequence, lenders became much more cautious about the types of loans they made—not only in mortgage markets but also throughout the economy. They were more careful about evaluating the likelihood that borrowers would repay their loans. This led to a reduction in the market supply of credit. The reduced supply of loans in the mortgage market was particularly acute. This appears as a leftward shift of the supply curve in Figure 19.8 "A Reduction in Supply in the Mortgage Market". Nominal interest rates increased, and the quantity of mortgages extended decreased. (The full story of what happened in credit markets is more complicated because central banks around the world also took actions to offset these changes and keep interest rates low.)
Figure 19.8 A Reduction in Supply in the Mortgage Market
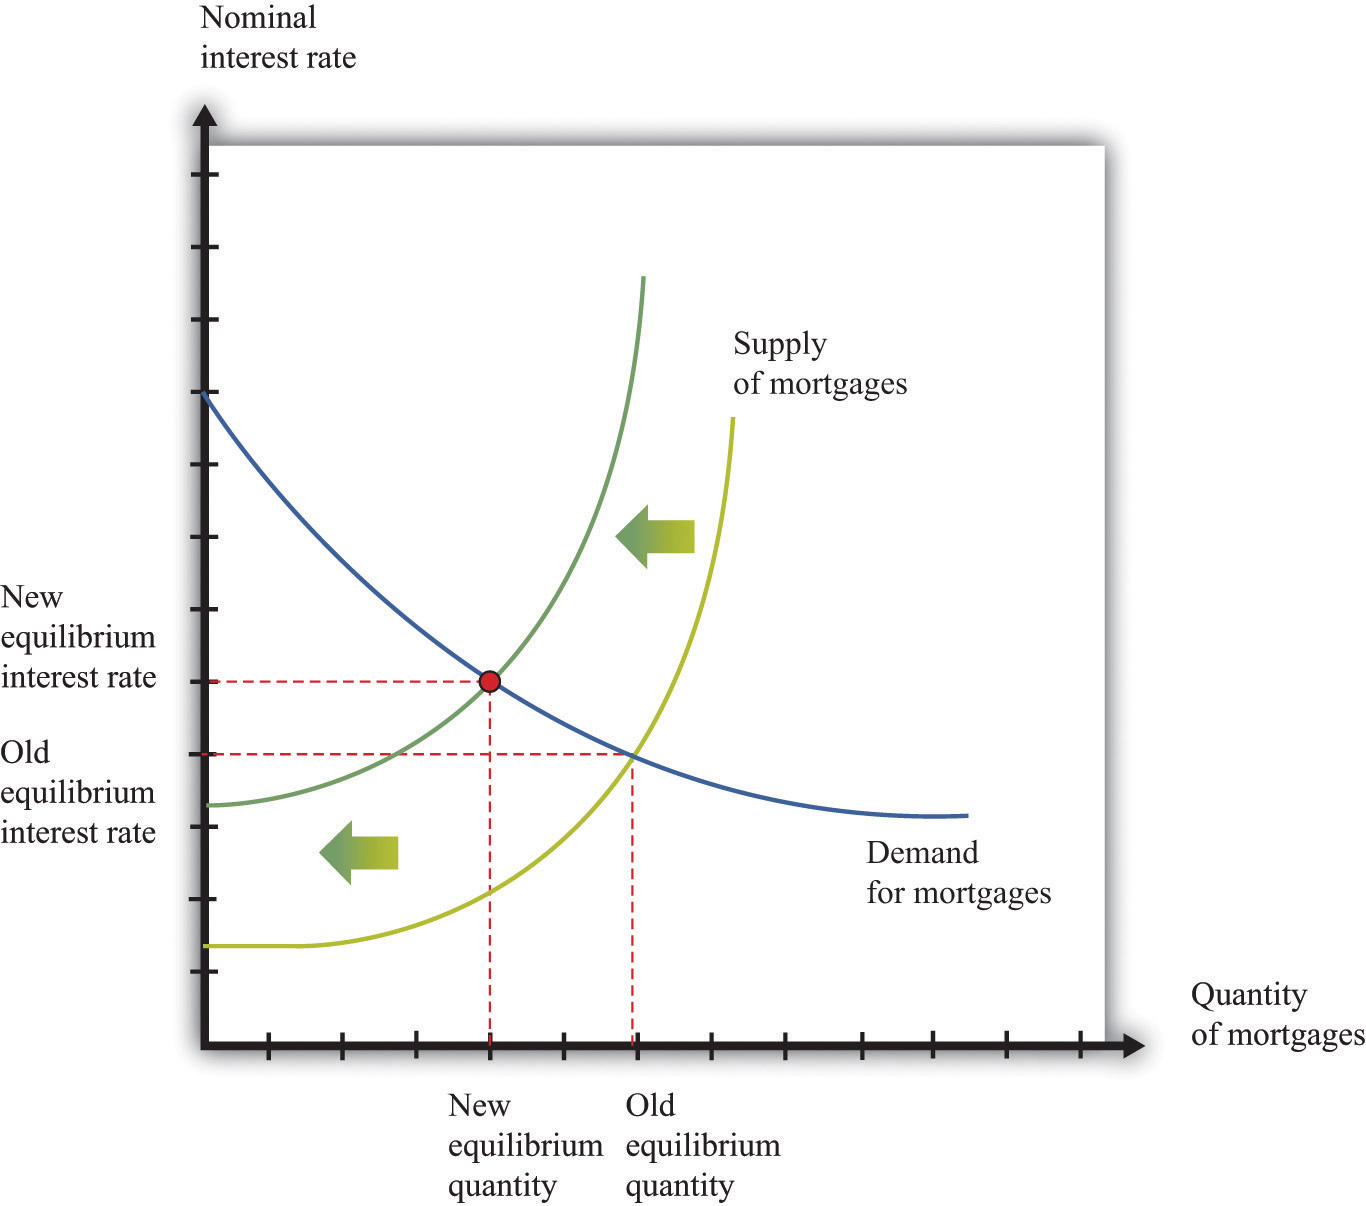
As lenders became more cautious about making loans, the supply of mortgage loans shifted leftward. Interest rates in the economy increased, and the quantity of mortgages decreased.
Nominal Interest Rates and Real Interest Rates
Mortgage rates and other interest rates are based on underlying dollar amounts; the interest rate tells you how many dollars borrowers must pay to lenders for each dollar that they borrow. Because they are based on dollar amounts, they are called nominal interest rates. When you see a mortgage rate quoted by a bank or a rate on a credit card, it is a nominal rate.
The nominal rate does not tell us the true cost of borrowing, or return on lending, when there is inflation in an economy. For example, suppose that the nominal interest rate is 5 percent, but inflation is also 5 percent. If you took out a $1,000 loan, you would have to pay back $1,050 next year. But that $1,050 would buy exactly the same amount of real gross domestic product (real GDP)A measure of production that has been corrected for any changes in overall prices. next year as $1,000 does this year—that is what it means to have 5 percent inflation. So, in terms of actual goods and services, you have to pay back the same amount that you borrowed. The real interest rateThe rate of return specified in terms of goods, not money.—that is, the interest rate corrected for inflation—is zero.
Toolkit: Section 31.8 "Correcting for Inflation"
The Fisher equationA formula for converting from nominal interest rates to real interest rates: the real interest rate equals the nominal interest rate minus the inflation rate. is a formula for converting from nominal interest rates to real interest rates, as follows:
real interest rate ≈ nominal interest rate − inflation rate.The real interest rate gives the true cost of borrowing and lending; it is the real interest rate that actually matters for the decisions of savers and borrowers.We derive the Fisher equation more fully in Chapter 24 "Money: A User’s Guide". That doesn’t mean, by the way, that our previous two diagrams were incorrect because they used the nominal interest rate. Provided that the inflation rate doesn’t change, a comparative static exercise using the nominal interest rate will give you exactly the same conclusion as one using the real interest rate.
Individual Credit Markets and the Aggregate Credit Market
We have described a market for a particular kind of loan, but more generally we know that there are all kinds of different ways in which credit is offered in an economy. Households borrow from banks to buy houses or cars. Households and firms make purchases using credit cards. Firms borrow from financial institutions to buy new equipment. The government borrows to finance its spending, and so on. There is a very large number of credit markets in the economy, each offering a different kind of credit, and each with its own equilibrium interest rate.
These different credit markets are linked because most households and firms buy or sell in more than one market. Financial institutions in particular trade in large numbers of different credit markets. For much of what we do in macroeconomics, however, the distinctions among different kinds of credit are not critical, and it is sufficient to imagine a single aggregate credit market and a single real interest rate.In Chapter 24 "Money: A User’s Guide", we look in more detail at the different kinds of credit—and the associated different interest rates—that we see in an economy. We also investigate in more detail how these markets are linked together. Figure 19.9 "The Aggregate Credit Market" shows the credit market for an entire economy. This is the market where all the savers in the economy bring funds to financial intermediaries, who then lend those funds to firms, households, and governments. The supply of credit increases as the interest rate increases. As the interest rate increases, other things being equal, households will generally save more and thus supply more to the credit market. The quantity of credit demanded decreases as the interest rate increases. When it is expensive to borrow, households and firms will borrow less.
Figure 19.9 The Aggregate Credit Market
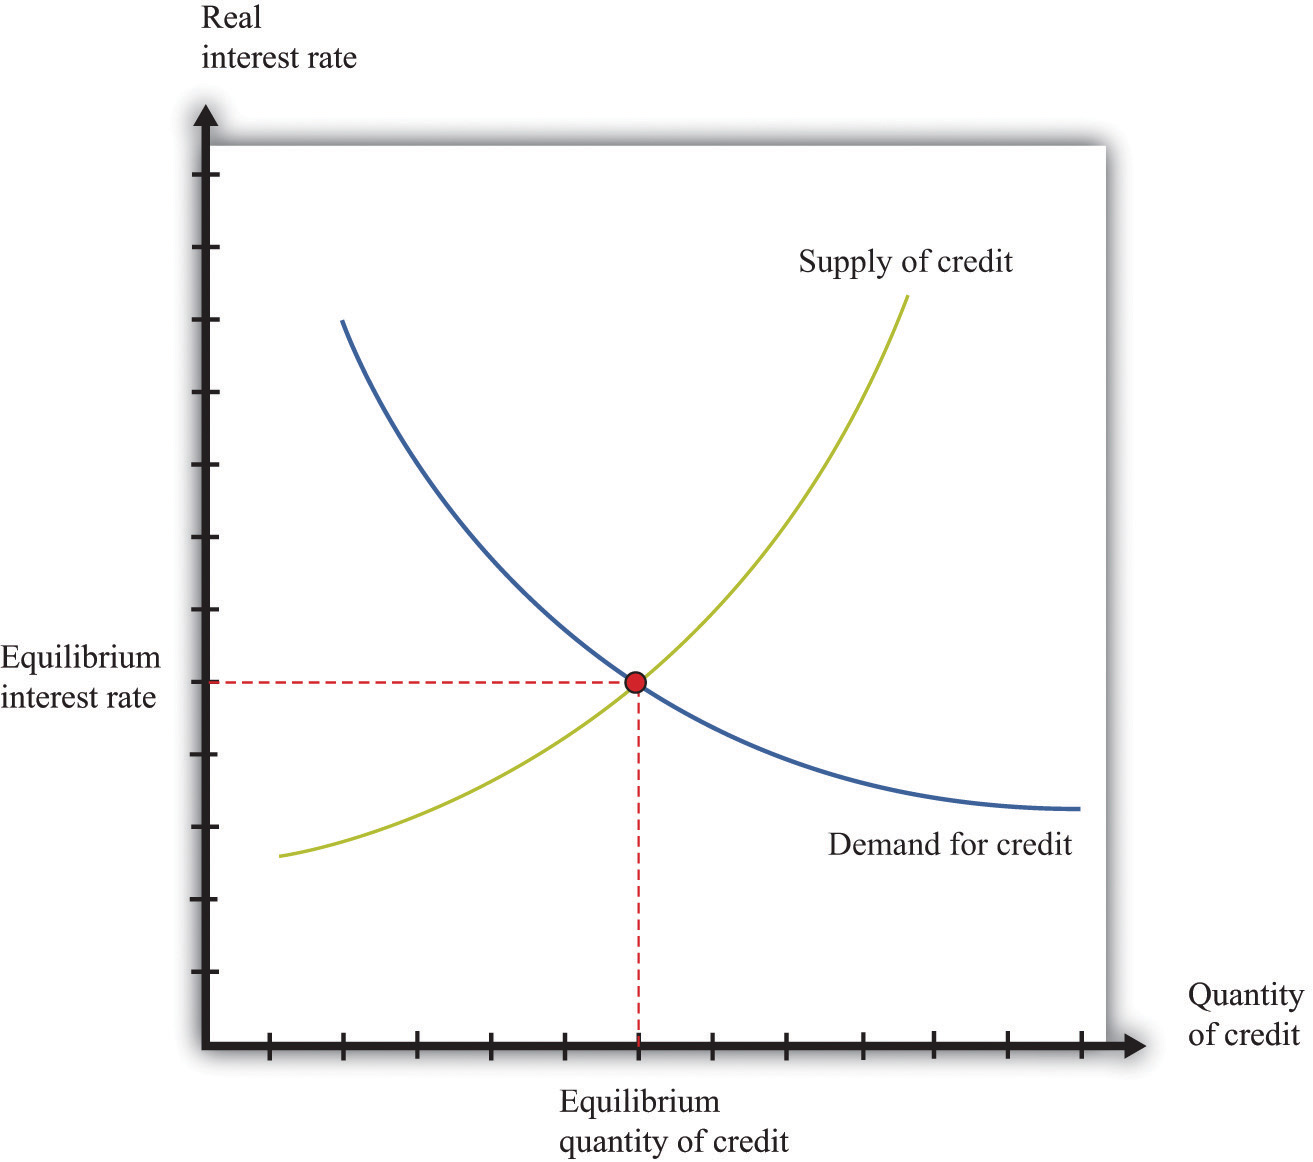
In the credit market, the equilibrium real interest rate is where the quantity of credit supplied equals the quantity of credit demanded.
Toolkit: Section 31.24 "The Credit (Loan) Market (Macro)"
The credit market brings together suppliers of credit, such as households who are saving, and demanders of credit, such as businesses and households who need to borrow. The real interest rate is the price that brings demand and supply into balance. At the equilibrium interest rate, the amount of credit supplied and the amount of credit demanded are equal.
Two of the most important players in the credit market are the government and the monetary authority. If the US federal government borrows more, this shifts the demand for credit outward and increases the interest rate. (Notice that the government is a big player in this market, so its actions affect the interest rate.) The monetary authority, meanwhile, buys and sells in credit markets to influence interest rates in the economy.We study the actions of the Federal Reserve and other monetary authorities in Chapter 25 "Understanding the Fed". In the 2008 crisis, the Federal Reserve Bank, which is the monetary authority in the United States, took many actions to increase the supply of credit and ease the problems in the credit market.
The Labor Market
The story about the housing market in the United Kingdom at the beginning of this chapter contained some dire predictions about employment:
The lack of spending in these areas will hit employment, with some analysts forecasting that the construction sector alone could see a loss of up to 350,000 jobs within the next five years.
To understand this prediction, we need to look at another market—the labor marketThe market that brings together households who supply labor services and firms who demand labor as an input into the production process..
In the markets for goods and services, the supply side usually comes from firms, and the demand side comes from households. In the labor market, by contrast, firms and households switch roles: firms demand labor, and households supply labor. Supply and demand curves for construction workers are shown in Figure 19.10 "Equilibrium in the Market for Construction Workers". Here the price of labor is the hourly real wageThe nominal wage (the wage in dollars) divided by the price level. that is paid to workers in this industry.
Toolkit: Section 31.3 "The Labor Market"
The real wage is the wage corrected for inflation. To obtain the real wage, simply divide the wage in dollars—the nominal wage—by the price level:
The individual demand for labor by firms comes from the fact that workers’ time is an input into the production process. This demand curve obeys the law of demand: as the real wage increases, the quantity of labor demanded decreases. At a higher real wage, a firm will demand less labor services (by hiring fewer workers and/or reducing the hours of workers) and will respond to the higher labor cost by reducing production.
Workers care about the real wage because it tells them how much they can obtain in terms of goods and services if they give up some of their time. The supply of labor comes from households who allocate their time between work and leisure activities. In Figure 19.10 "Equilibrium in the Market for Construction Workers", the supply of labor is upward sloping. As the real wage increases, households supply more labor because (1) higher wages induce people to work longer hours, and (2) higher wages induce more people to enter the labor force and look for a job.
Figure 19.10 Equilibrium in the Market for Construction Workers
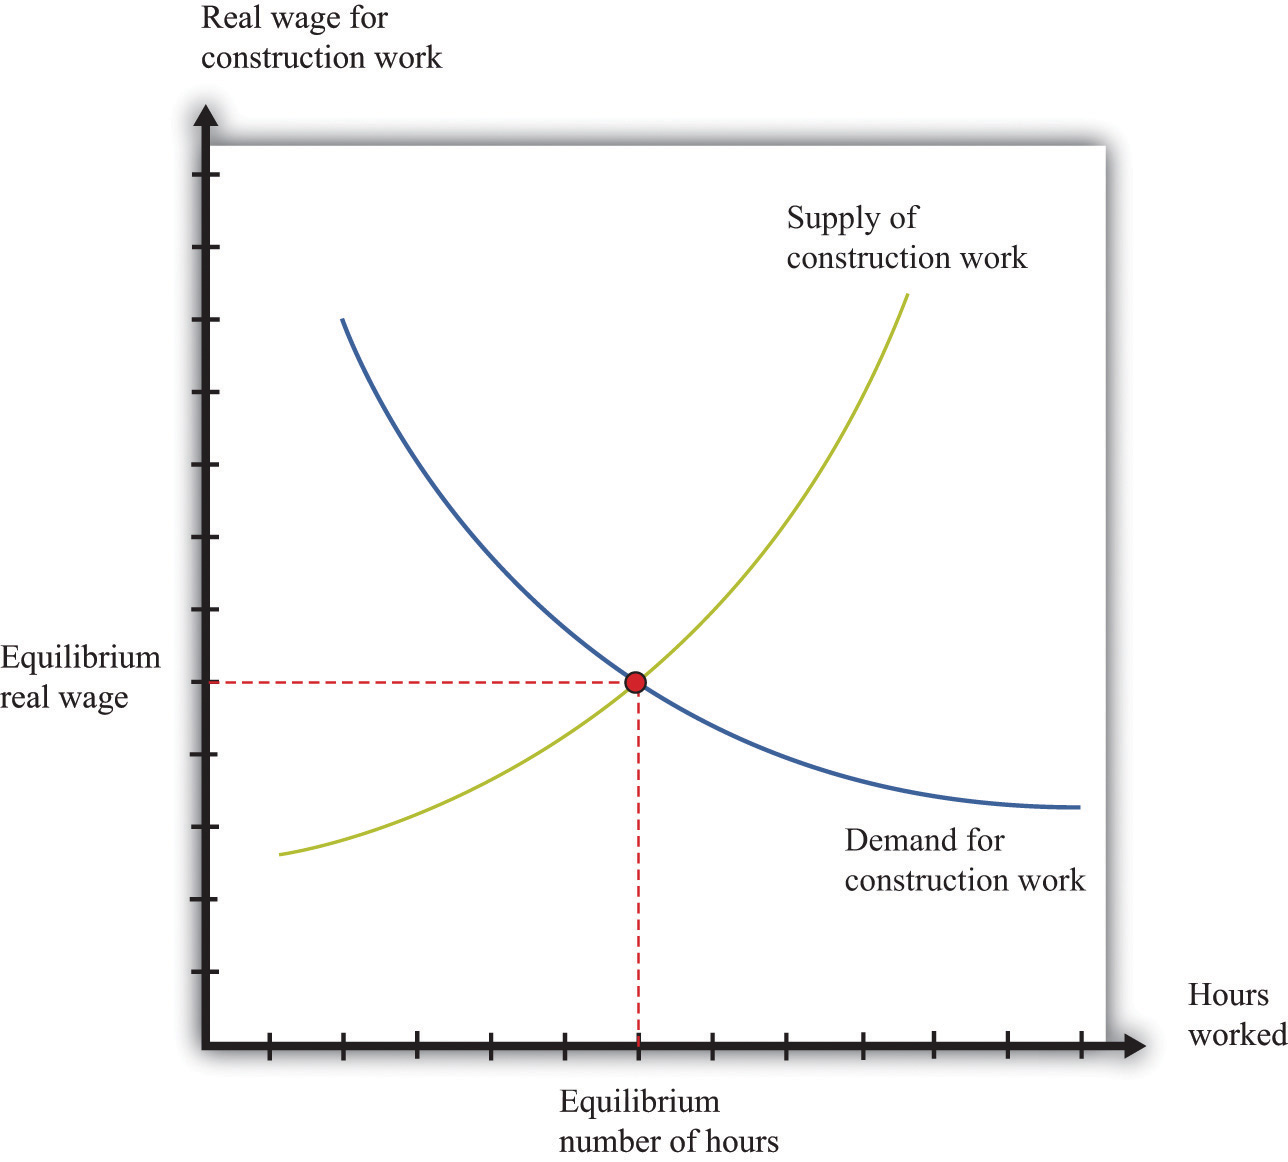
This picture shows the supply of and demand for hours of work in the construction industry.
Figure 19.11 A Decrease in Demand for Construction Workers
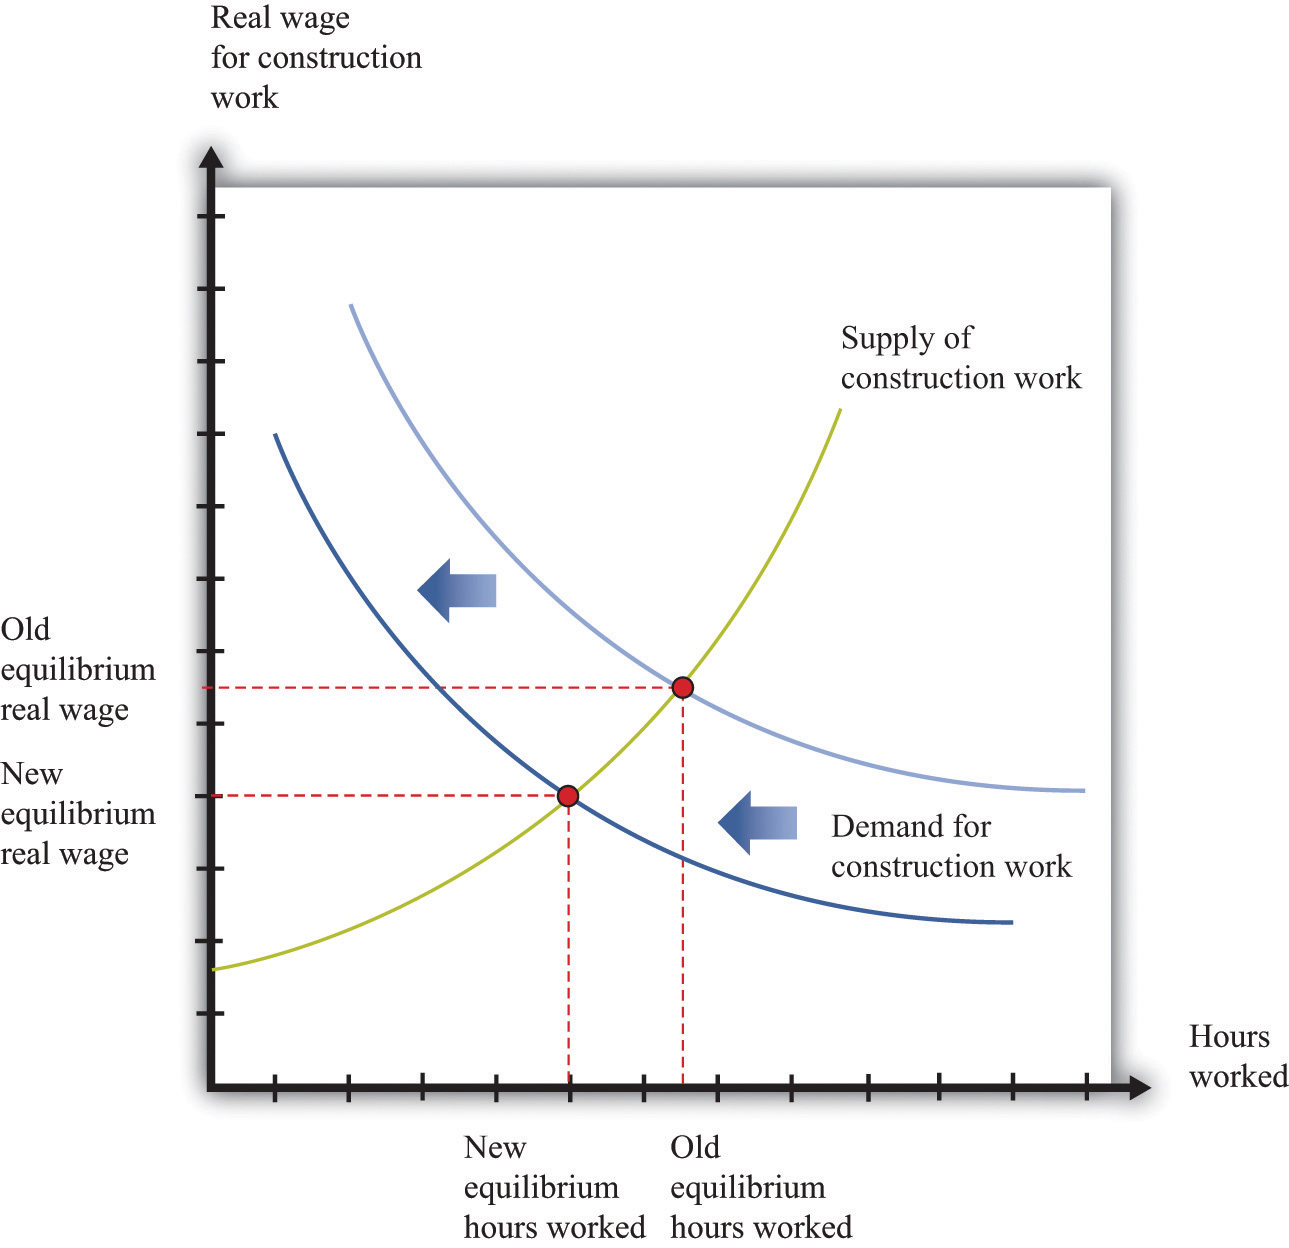
Because builders are building fewer houses, they hire fewer construction workers, causing the labor demand curve to shift leftward.
The Labor Market in the 2008 Crisis
In the United Kingdom, there was a leftward shift in demand for housing (just like we showed in Figure 19.6 "A Decrease in Demand for Housing"). The response of homebuilders to such a shift is to build fewer homes and, therefore, demand less labor. As a result, there is a leftward shift in the demand curve for construction workers. Based on the supply-and-demand framework, we predict both lower wages and a reduction in employment in the construction sector of the economy, as shown in Figure 19.11 "A Decrease in Demand for Construction Workers".
Similar reductions in demand for labor occurred in the United States and many other countries around the world. There was a consequent reduction in employment and an increase in unemployment. The crisis was not restricted just to financial markets, in other words. It had consequences for the “real” economy as well.
Individual Labor Markets and the Aggregate Labor Market
Because there are many different jobs and many different kinds of workers, there is no single labor market and no single wage. Instead, you can think of there being many different labor markets just as there are many different credit markets. Like different credit markets, different labor markets are linked: households may participate in more than one labor market, and most firms purchase many different kinds of labor. As with the credit market, we sometimes look at the market for a particular kind of labor and the economy as a whole. Most of the time in macroeconomics, it is sufficient to think about an aggregate labor market, as shown in Figure 19.12 "Equilibrium in the Labor Market".In Chapter 23 "Jobs in the Macroeconomy", we pay more attention to the fact that workers and jobs are not all identical. As the real wage increases, households supply more hours, and more households participate in the labor market. For both of these reasons, as the real wage increases, the quantity of labor supplied also increases. Labor demand comes from firms. As the real wage increases, the cost of hiring extra labor increases, and firms demand fewer labor hours. That is, the firm’s labor demand curve is downward sloping.
Toolkit: Section 31.3 "The Labor Market"
The labor market is the market in which labor services are traded. The supply of labor comes from households. At the equilibrium real wage, the number of hours supplied and the number of hours demanded are equal.
Figure 19.12 Equilibrium in the Labor Market
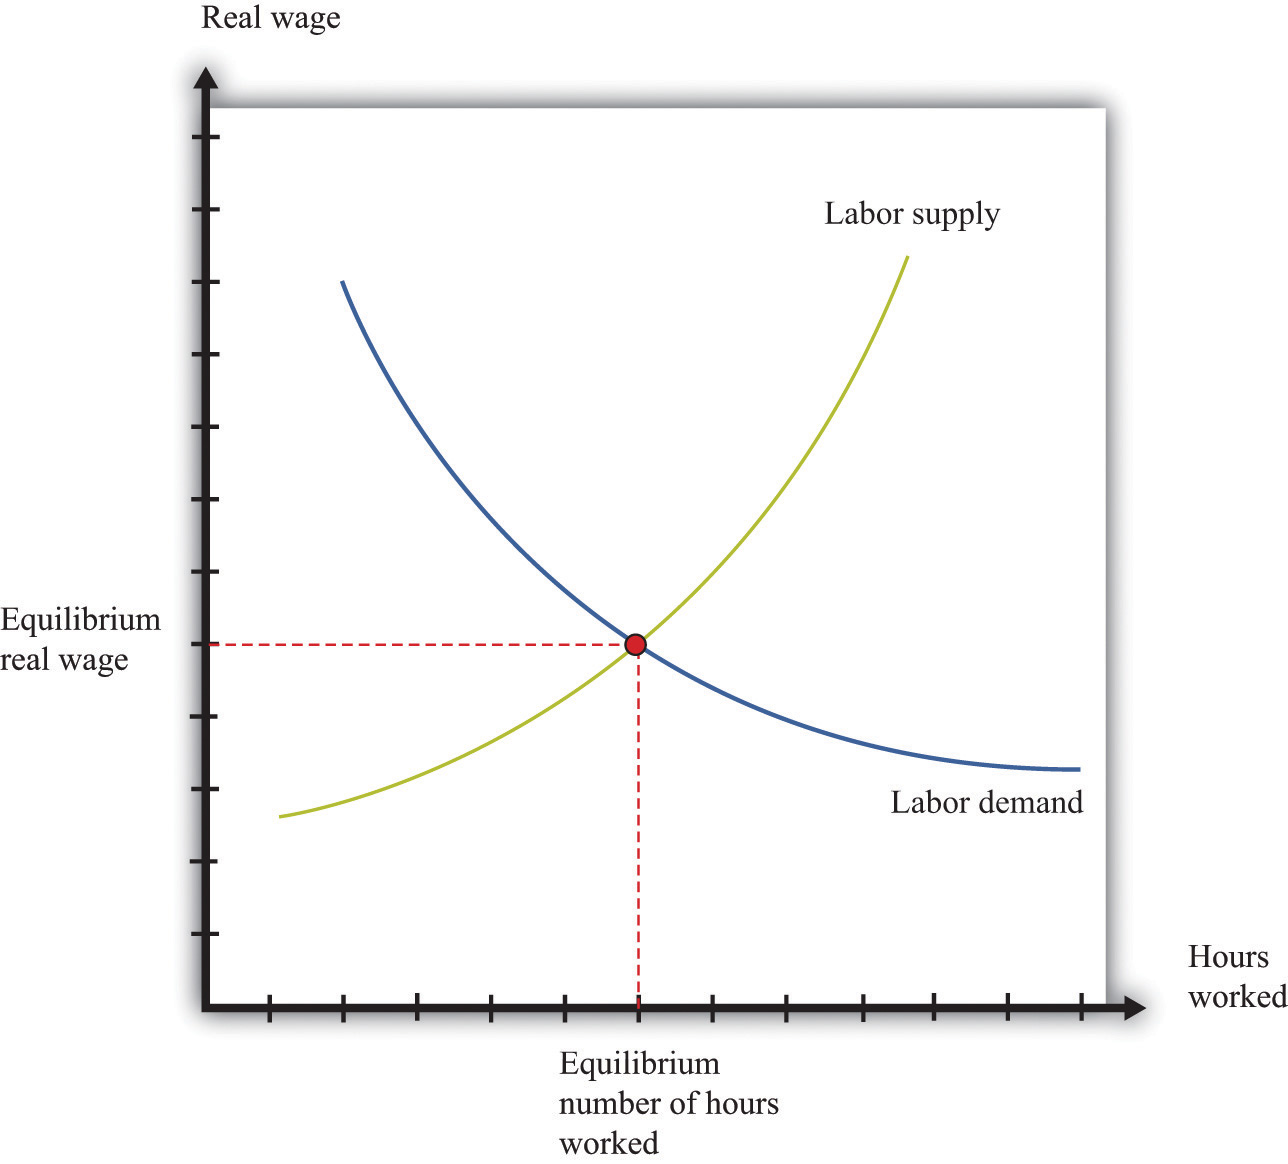
The labor market is the market in which firms hire workers. The equilibrium real wage is the price where the quantity of labor supplied equals the quantity of labor demanded.
The Foreign Exchange Market
The excerpts at the beginning of this chapter reveal that the financial crisis also impacted other countries. For example, we included an excerpt about the effects of the crisis on the value of a dollar and also an excerpt about exports from China. We could have also cited effects of the crisis on other countries: for example, India’s information technology sector and Canada’s lumber industry were both affected. To understand the transmission of the crisis to other countries, we have to learn about another market—the market where different currencies are bought and sold.
If you travel abroad, you must acquire the currency used in that region of the world. For example, if you take a trip to Finland, Russia, and China, you will buy euros, rubles, and yuan along the way. To do so, you need to participate in various foreign exchange marketsThe place where suppliers and demanders of currencies meet and trade..
Toolkit: Section 31.20 "Foreign Exchange Market"
The foreign exchange market is the market where currencies are traded. The price in this market is the price of one currency in terms of another and is called the nominal exchange rateThe price of one currency in terms of another..
Dollars are supplied to foreign exchange markets by US households, firms, and governments who wish to purchase goods, services, or financial assets that are denominated in the currency of another economy. For example, if a US auto importer wants to buy a German car, it must sell dollars and buy euros. As the price of a dollar increases, the quantity supplied of that currency will increase.
Foreign currencies are supplied by foreign households, firms, and governments that wish to purchase goods, services, or financial assets (such as stocks or bonds) denominated in the domestic currency. For example, if a Canadian bank wants to buy a US government bond, it must sell Canadian dollars and buy US dollars. The law of demand holds: as the price of a dollar increases, the quantity of that currency demanded decreases.
Figure 19.13 "Equilibrium in the Foreign Exchange Market Where Dollars and Euros Are Exchanged" shows an example of a foreign exchange market: the market in which euros are bought with and sold for US dollars. The horizontal axis shows the number of euros bought and sold on a particular day. The vertical axis shows the exchange rate—the price of a euro in dollars. This market determines the dollar price of euros just like the gasoline market determines the dollar price of gasoline.
Figure 19.13 Equilibrium in the Foreign Exchange Market Where Dollars and Euros Are Exchanged
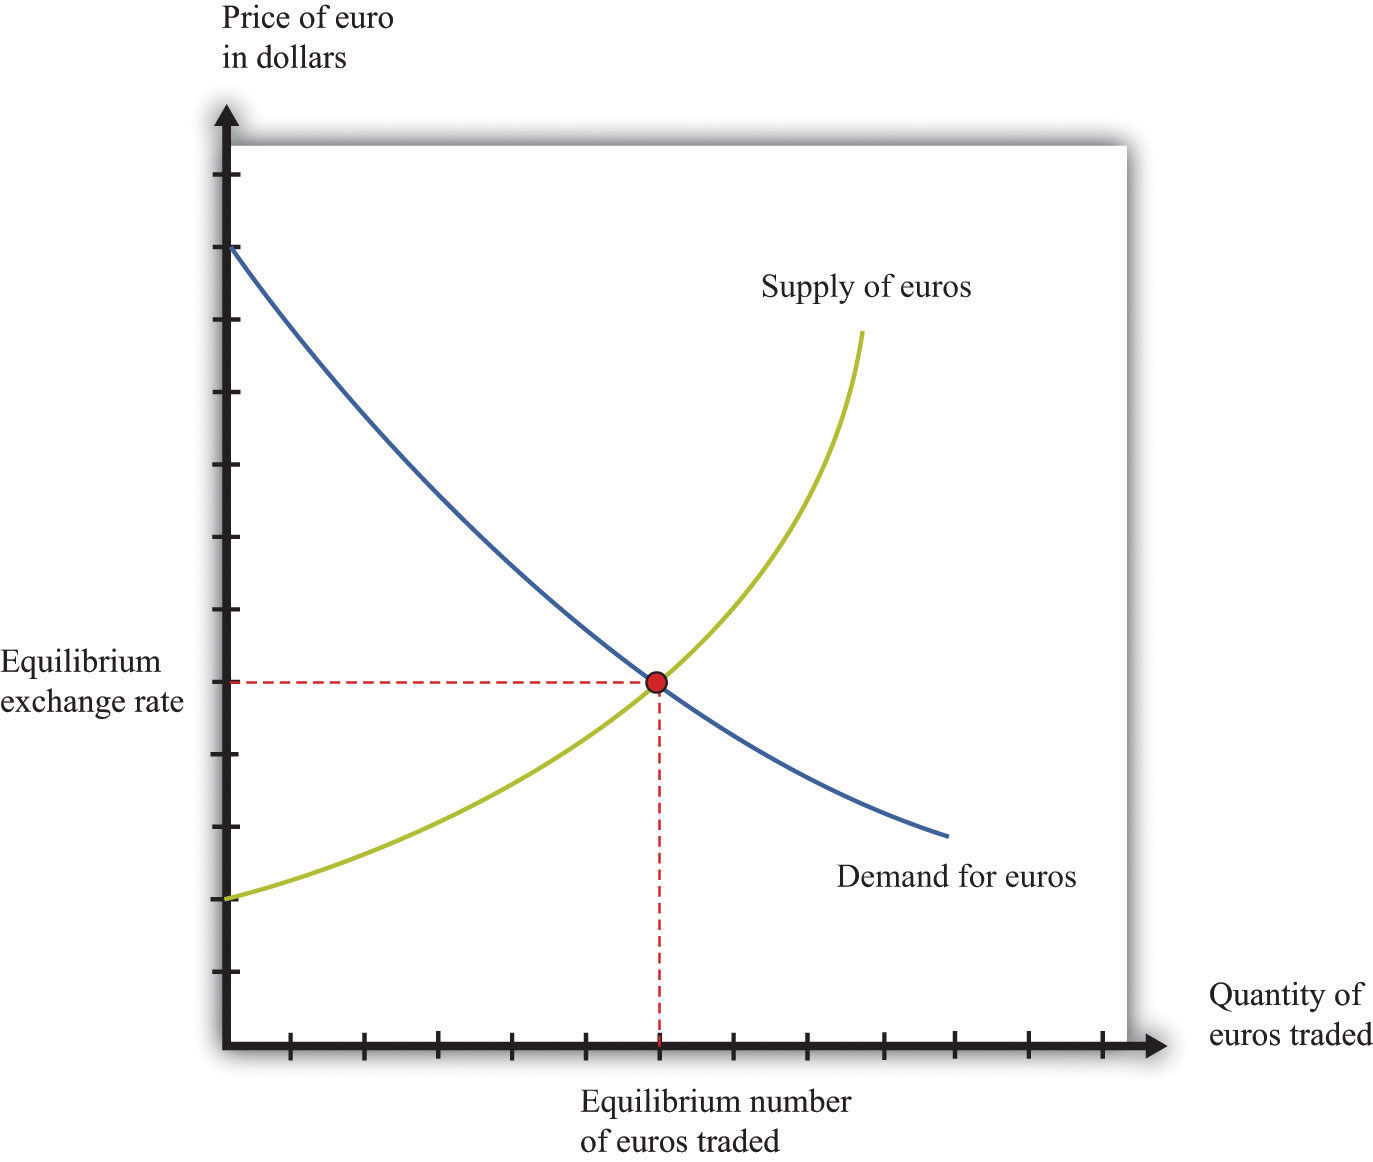
Currencies are traded in foreign exchange markets, such as the market shown here in which dollars and euros are exchanged. The equilibrium exchange rate is the price where the quantity of euros supplied equals the quantity of euros demanded.
On the supply side, there are households and firms in Europe who want to buy US goods and services. To do so, they need to buy dollars and, therefore, must supply euros to the market. This supply of euros need not come only from European households and firms. Anyone holding euros is free to sell them in this market. On the demand side, there are households and firms who are holding dollars and who wish to buy European goods and services. They need to buy euros.
There is another source of the demand for and the supply of different currencies. Households and, more importantly, firms often hold assets denominated in different currencies. You could, if you wish, hold some of your wealth in Israeli government bonds, in shares of a South African firm, or in Argentine real estate. But to do so, you would need to buy Israeli shekels, South African rand, or Argentine pesos. Likewise, many foreign investors hold US assets, such as shares in Dell Inc. or debt issued by the US government. Thus the demand for and the supply of currencies are also influenced by the asset choices of households and firms. In practice, banks and other financial institutions conduct the vast majority of trades in foreign exchange markets.
As well as households and firms, monetary authorities also participate in foreign exchange markets. For example, the US Federal Reserve Bank monitors the value of the dollar and may even intervene in the market, buying or selling dollars in order to influence the exchange rate.
Foreign Exchange Markets in the 2008 Crisis
One of the articles we used to open this chapter dealt with changes in the value of the dollar in the fall of 2008. The article pointed out that the dollar was getting stronger relative to other currencies, such as the euro. This means that the price of a dollar in euros was increasing or, equivalently, the price of a euro in dollars was decreasing. In fact, the euro price of a dollar was about 0.67 in late September 2008; the price increased to nearly 0.81 by late October and then decreased again through December 2008.
We can use the foreign exchange market to understand these events. Figure 19.14 "Comparative Statics in the Euro Market" shows the dollar market for euros once again. The increase in the value of the dollar discussed in the article is seen here as a rightward shift in the supply of euros, which decreases the value of the euro and—equivalently—increases the value of the dollar.
Figure 19.14 Comparative Statics in the Euro Market
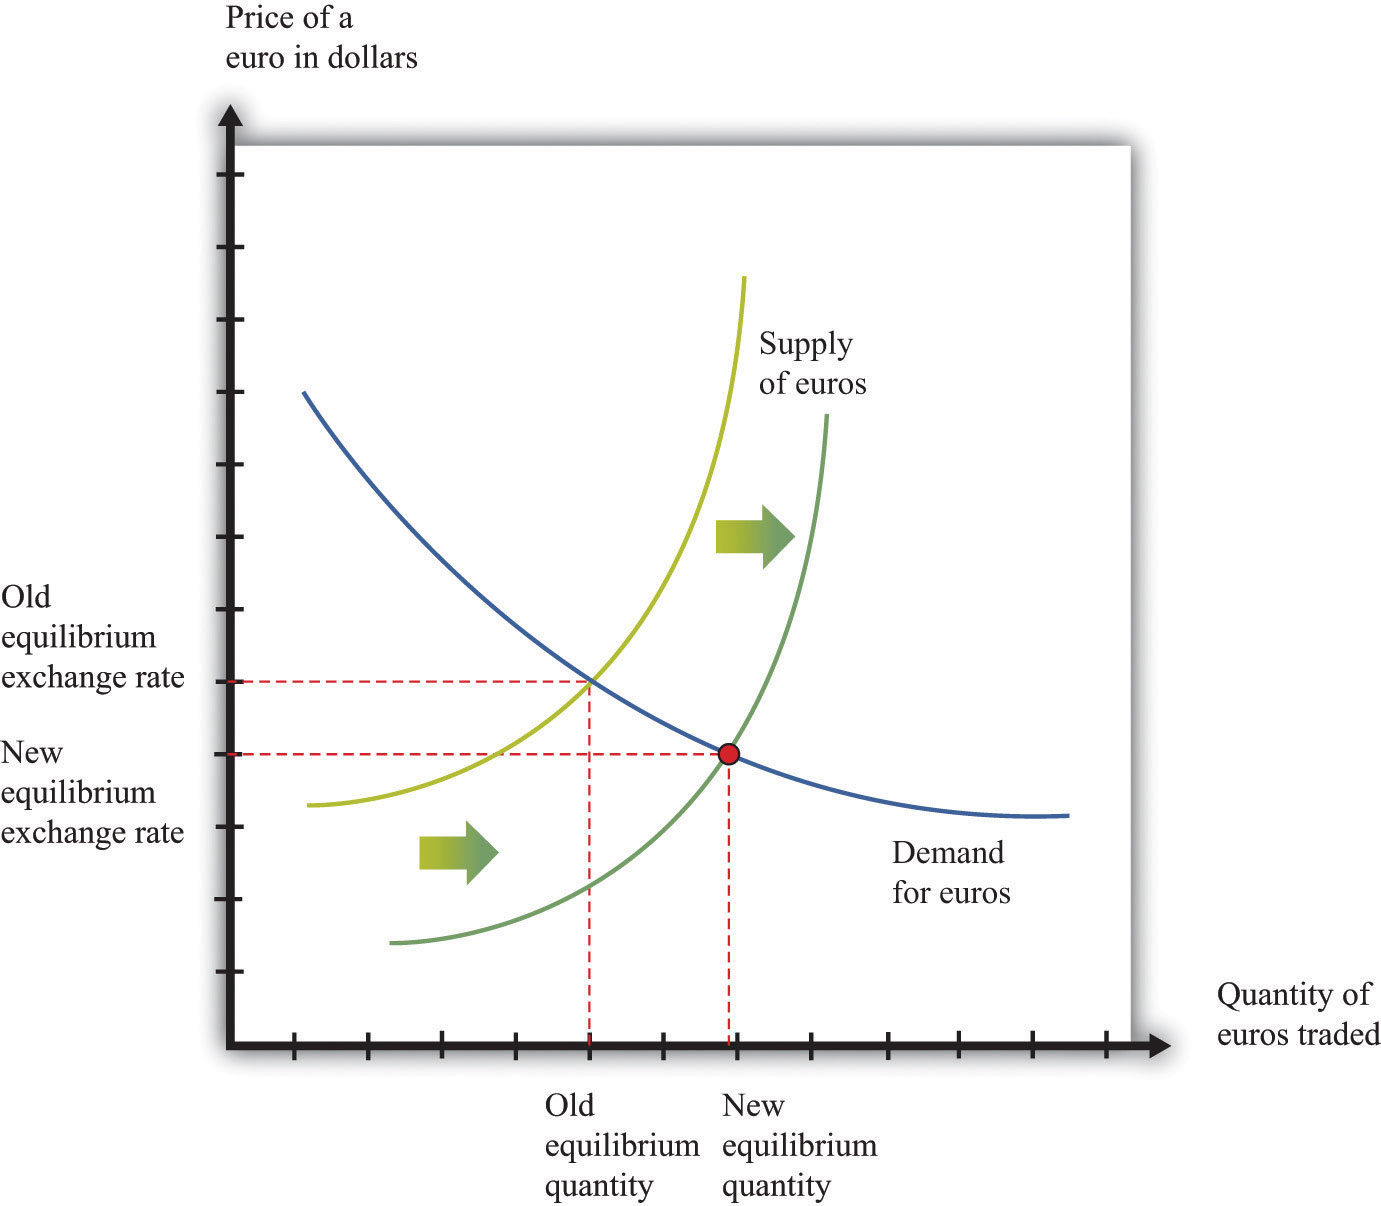
The rightward shift in the supply of euros leads to a decrease in the price of a euro in terms of dollars.
There are two consequences of this shift in the supply curve. First, the shift in supply decreases the dollar price of the euro. So people in the United States who are planning to visit, say, France will find that they can obtain more euros for a given amount of dollars. Second, the quantity of euros actually bought and sold is higher. This is not inconsistent with the lower dollar price of a euro since the supply curve shifts along the demand curve for euros.
Individual Foreign Exchange Markets and the Aggregate Foreign Exchange Market
We sometimes look at an individual exchange rate (e.g., dollar-euro) by thinking of the market where dollars are exchanged for euros. However, there are many different currencies that are exchanged for the US dollar. There are markets where dollars are exchanged for British pounds, Japanese yen, and so on. We can combine these into an aggregate foreign exchange market. Think of this as being the market where US dollars are bought with and sold for all the other currencies in the world. In this market, there is an aggregate exchange rate, which you can think of as an average of the exchange rates in all the individual markets.More precisely, you should think of a weighted average. Because the United States trades much more with Canada than with, say, South Africa, movements in the US dollar–Canadian dollar exchange rate matter more than movements in the US dollar–South African rand exchange rate. Chapter 24 "Money: A User’s Guide" has more on exchange rates. We show this market in Figure 19.15 "Foreign Exchange Market Equilibrium".
Figure 19.15 Foreign Exchange Market Equilibrium
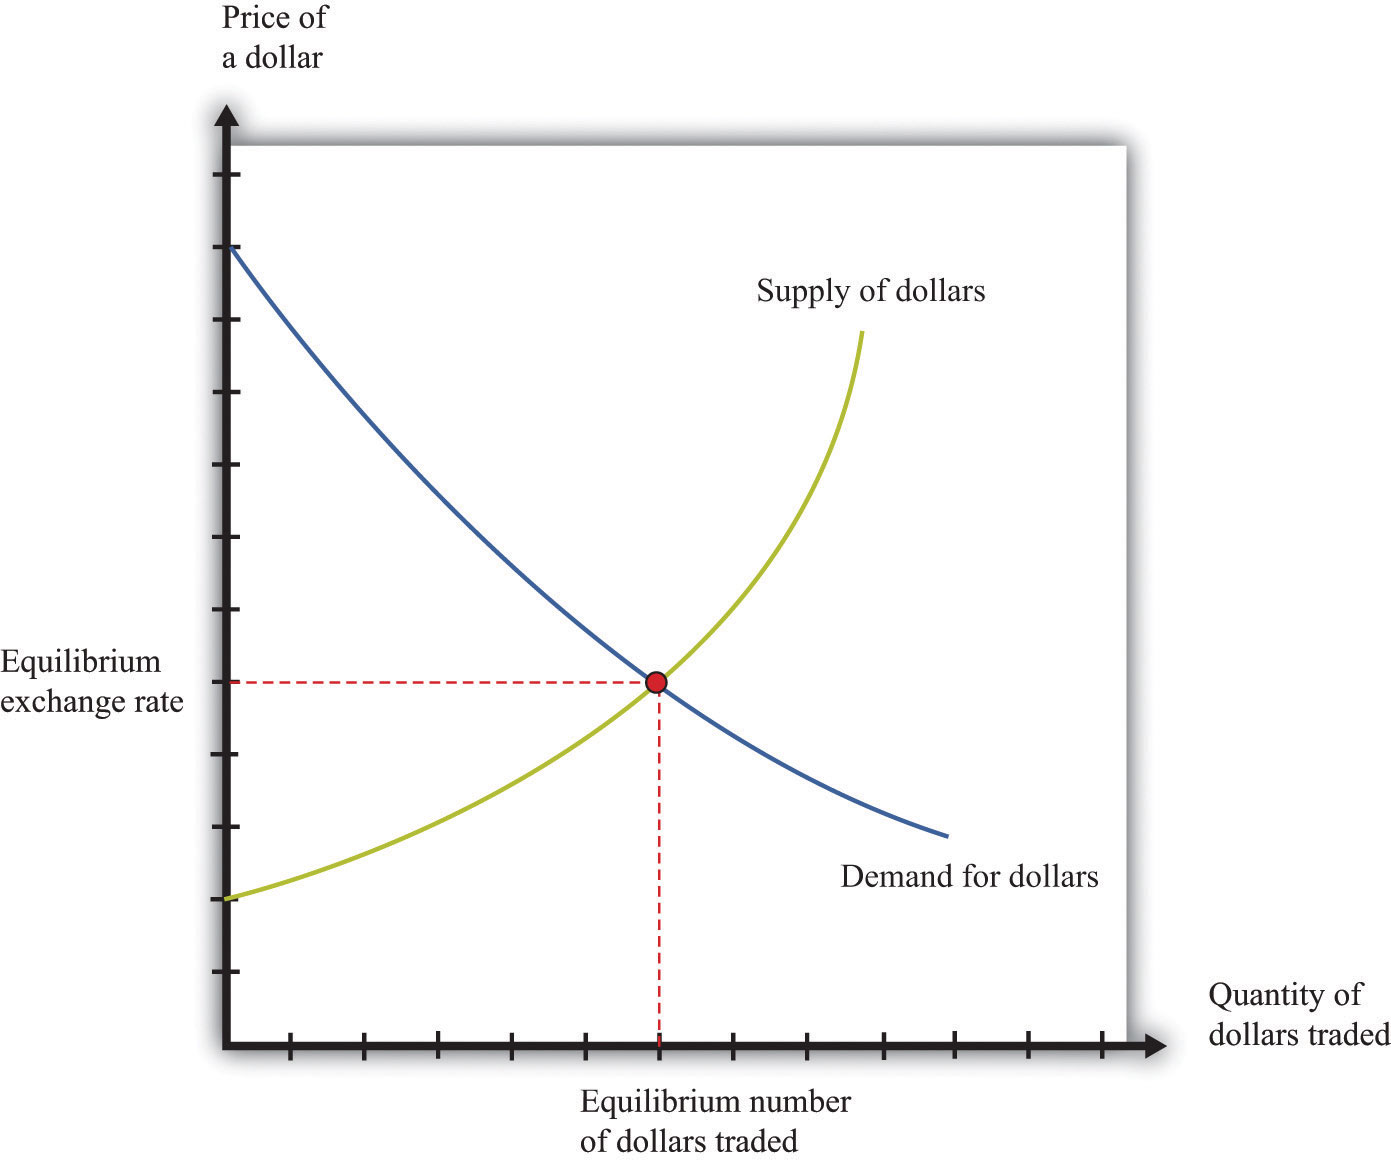
Currencies are traded in foreign exchange markets, such as the market shown here in which dollars are bought and sold.
Key Takeaways
- The credit market brings together the suppliers of credit (households) with those who are demanding credit (other households, firms, and the government). The interest rate adjusts to attain a market equilibrium.
- The labor market is where labor services are traded. Households supply labor, and firms demand labor. The real wage adjusts to attain a market equilibrium.
- The foreign exchange market brings together demanders and suppliers of foreign currency. The exchange rate, which is the price of one currency in terms of another, adjusts to attain a market equilibrium.
Checking Your Understanding
- Figure 19.13 "Equilibrium in the Foreign Exchange Market Where Dollars and Euros Are Exchanged" shows the market where euros are bought and sold using dollars. We could equivalently think about this as the market where dollars are bought and sold using euros. Draw the graph for this market. How are the supply and demand curves in the two markets related to each other?