This is “Comparative Statics: Changes in the Price of Housing”, section 19.2 from the book Theory and Applications of Economics (v. 1.0). For details on it (including licensing), click here.
For more information on the source of this book, or why it is available for free, please see the project's home page. You can browse or download additional books there. To download a .zip file containing this book to use offline, simply click here.


19.2 Comparative Statics: Changes in the Price of Housing
Learning Objectives
After you have read this section, you should be able to answer the following questions:
- What are exogenous and endogenous events?
- How does the equilibrium of a market respond to changes in exogenous variables?
- What is comparative statics, and how is it used?
A driving factor in the crisis of 2008 was a decrease in the price of new housing. We can use our supply-and-demand tool to help us understand that. We use the framework to make predictions about the effects of events on economic outcomes. More precisely, economists predict the effects of exogenous events on equilibrium prices and quantities.
Toolkit: Section 31.16 "Comparative Statics"
An exogenousSomething that comes from outside a model and is not explained in our analysis. variable is something that comes from outside a model and is not explained in our analysis. An endogenousSomething that is explained within our analysis. variable is one that is explained within our analysis. When using the supply-and-demand framework, price and quantity are endogenous variables; everything else is exogenous.
A Shift in Demand for Housing
The following is a typical account of the housing market crisis in 2008:
The immediate cause or trigger of the crisis was the bursting of the United States housing bubble which peaked in approximately 2005–2006. High default rates on “subprime” and adjustable rate mortgages (ARM), began to increase quickly thereafter. An increase in loan incentives such as easy initial terms and a long-term trend of rising housing prices had encouraged borrowers to assume difficult mortgages in the belief they would be able to quickly refinance at more favorable terms. […] However, once interest rates began to rise and housing prices started to drop moderately in 2006–2007 in many parts of the U.S., refinancing became more difficult. Defaults and foreclosure activity increased dramatically as easy initial terms expired, home prices failed to go up as anticipated, and ARM interest rates reset higher. Falling prices also resulted in 23% of U.S. homes worth less than the mortgage loan by September 2010, providing a financial incentive for borrowers to enter foreclosure.“Subprime Mortgage Crisis,” Wikipedia, accessed June 28, 2011, http://en.wikipedia.org/wiki/Subprime_mortgage_crisis.
This quote identifies two forces that influenced the demand for housing in 2007–8. The first was expectations of future home prices. One of the gains from owning a house is the possibility that you can sell it at a higher price in the future. Prior to 2007, there had been a fairly consistent tendency for house prices to increase, but the quote seems to indicate that people began to doubt that this trend would continue. As a consequence, the demand for new homes decreased. The second force in the market for new housing was the availability of credit. Most households buy a new home by obtaining a loan (a mortgage) to cover some of the price of the house. During 2007 and 2008, it became increasingly difficult to obtain a mortgage. This was in contrast to a few years earlier when lending standards were easier, and many households easily qualified for mortgages.
These forces affect market demand. The anticipation of lower home prices in the future implies that fewer individuals will choose to buy a home now. Further, if financing is more expensive, then less housing will be purchased. These effects operate given the current price of housing. That is, at any given current price of houses, a smaller quantity of houses is demanded. The market demand curve shifts leftward: at each given price, market demand is lower.
The shift in demand is shown in Figure 19.6 "A Decrease in Demand for Housing". Once the demand curve shifts, the market for new houses is no longer in equilibrium. At the original price, there is now an imbalance between supply and demand: at that price, buyers want to purchase fewer homes than sellers wish to sell. To restore equilibrium in the market, there needs to be a reduction in housing prices and a reduction in the quantity of new houses produced. The decrease in production comes about because the lower price of houses makes suppliers less willing to produce houses for the market. The shift in the demand curve leads to a movement along the supply curve.
Figure 19.6 A Decrease in Demand for Housing
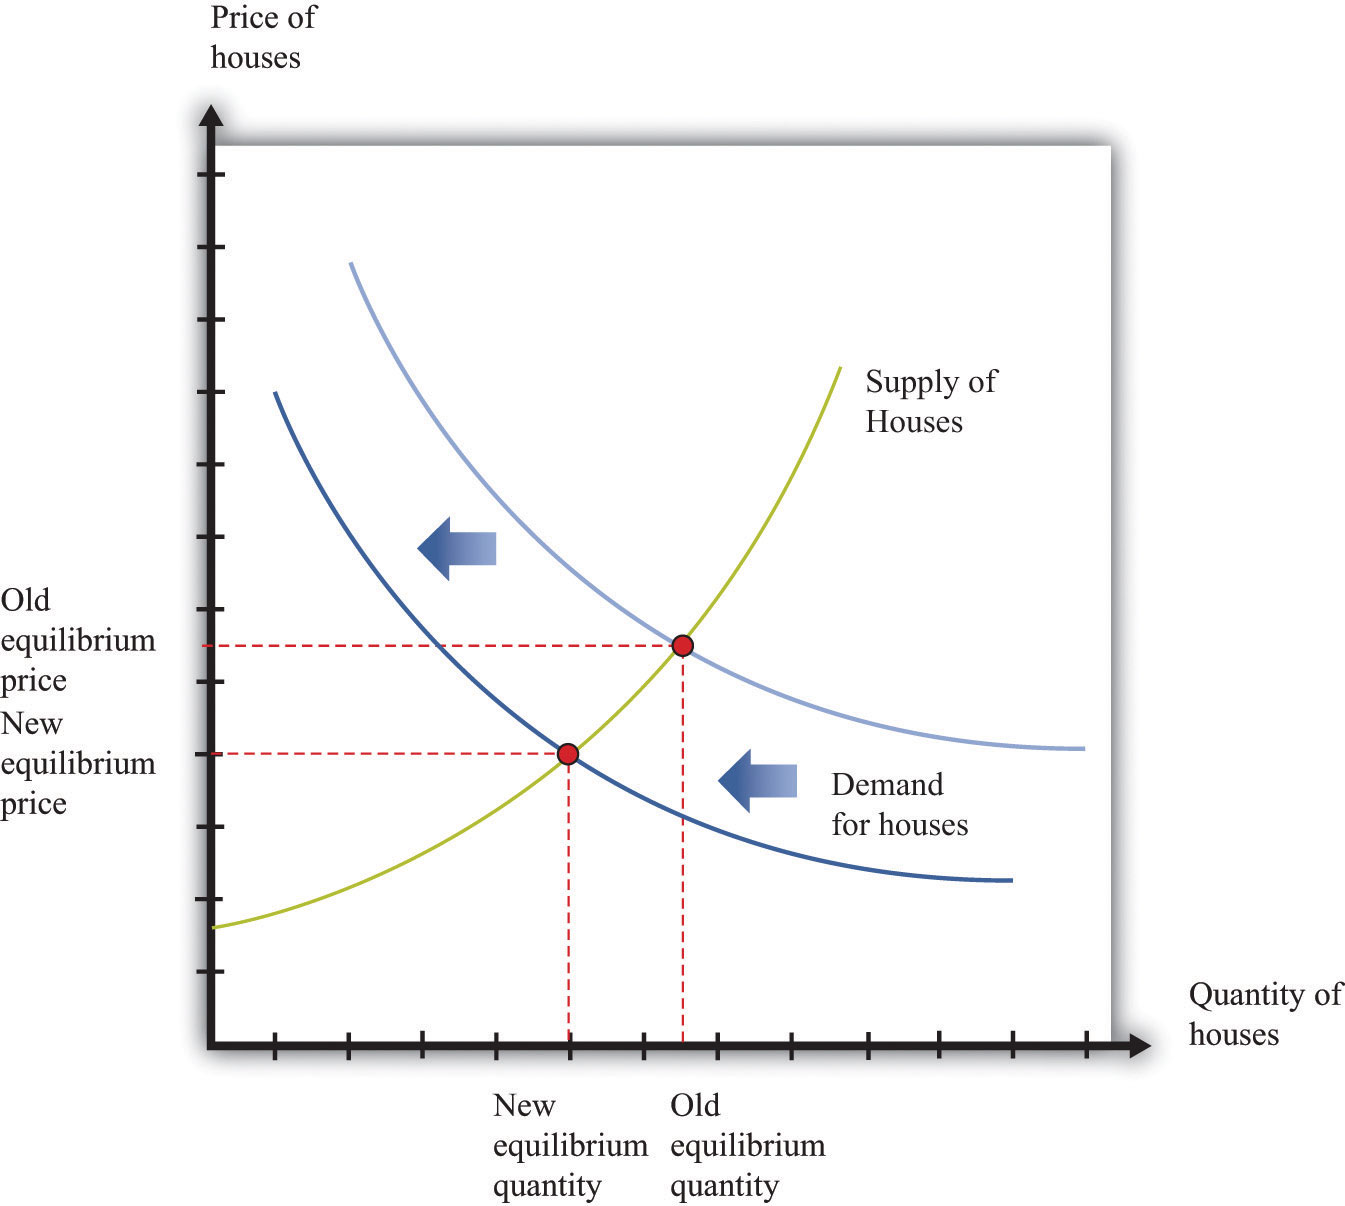
A decrease in demand for houses means that the demand curve shifts leftward, leading to a decrease in both the price of houses and the quantity of houses that are produced and sold.
Shifts in a Curve versus Movements along a Curve
Understanding the distinction between moving along a curve (either supply or demand) and shifting the curve is the hardest part about learning to use the supply-and-demand framework. Journalists and others frequently get confused about this—and no wonder, for it requires practice to learn how to use supply and demand properly.
First, consider the market demand curve. As the price of houses increases, the quantity demanded will decrease. This is a movement along the market demand curve. Changes in anything else—anything other than price—that affects the quantity demanded appears as a shift in the market demand curve. That is, at each given price, the quantity demanded changes.
Analogously, as the price of houses increases, the quantity supplied will increase. This is a movement along the market supply curve. If a change in anything else leads to a change in the quantity supplied, this appears as a shift in the market supply curve. That is, at each given price, the quantity supplied changes.
Comparative Statics
The example that we just discussed is an illustration of a general technique used by economists for two purposes. First, we use it to explain changes in prices and quantities that we have observed in the past. Second, we use it to predict what will happen to market prices and quantities in the future. The technique is called comparative staticsA technique that allows us to describe how market equilibrium prices and quantities depend on exogenous events..
Toolkit: Section 31.16 "Comparative Statics"
Comparative statics is a technique that allows us to describe how market equilibrium prices and quantities depend on exogenous events. As such, much of economics consists of exercises in comparative statics. In a comparative statics exercise, you must do the following:
- Begin at an equilibrium point where the quantity supplied equals the quantity demanded.
- Based on a description of an event, determine whether the change in the exogenous factor shifts the market supply curve or the market demand curve.
- Determine the direction of this shift.
- After shifting the curve, find the new equilibrium point.
- Compare the new and old equilibrium points to predict how the exogenous event affects the market.
The most difficult part of a comparative statics exercise is to determine, from a description of the economic problem, whether it is the supply or demand curve (or both) that shifts. Once you conquer the economics of determining which curve is shifting, then it is a matter of mechanically using the framework to find the new equilibrium. A comparison of the old and new equilibrium points allows you to predict what will happen to equilibrium prices and quantities following an exogenous change.
Key Takeaways
- Exogenous variables are determined from outside a framework, while endogenous variables are determined within the framework.
- Changes in exogenous variables lead to shifts in market supply and/or market demand curves. These shifts in supply and demand then lead to changes in quantities and prices.
- Comparative statics is a technique that describes how changes in exogenous variables influence equilibrium quantities and prices. It is used to answer questions about how markets respond to changes in exogenous variables.
Checking Your Understanding
- Name two exogenous variables that might affect the equilibrium outcome in the market for used cars.
- Draw the market for housing when there is a decrease in supply and a decrease in demand. What happens to the price? Why can you not say for sure what happens to the quantity of houses bought and sold?