This is “Raising the Wage Floor”, chapter 11 from the book Theory and Applications of Economics (v. 1.0). For details on it (including licensing), click here.
For more information on the source of this book, or why it is available for free, please see the project's home page. You can browse or download additional books there. To download a .zip file containing this book to use offline, simply click here.


Chapter 11 Raising the Wage Floor
Working at Minimum Wage
Even in rich economies like those of the United States or Western Europe, there are numerous jobs where the level of pay is very low. Perhaps you have experienced this yourself—for example, waiting tables, bagging groceries, or working at a fast-food restaurant. Strikingly, many of these jobs pay exactly the same hourly wage. In 2010 in the United States, for example, the wage for jobs in fast-food restaurants was often $7.25. If you worked for Burger King in Georgia or Arby’s in Iowa, you were likely to receive exactly the same wage. In Washington State, you would have earned more—$8.67 an hour—but you would have again found that many different employers were offering exactly the same wage. Had you looked for a job in a fast-food restaurant in 1995 in the United States, you would probably have been offered $4.25. The story is similar in many other countries. In New Zealand, the wage at fast-food restaurants in 2010 was typically NZ$12.75 (about $9.50); in France it was €9.00 (about $12.50).
The fact that different US employers from Wisconsin to Pennsylvania offer the same hourly wage is not a coincidence. It is the result of legislation by the federal government that sets a lower limit on the wage that firms can pay. Such regulations are called minimum wage laws, and they are found in many different countries. Figure 11.1 "US Department of Labor Poster" is a poster you might have seen where you have worked. This is from the US Department of Labor and outlines your rights as an employee. This chapter is about the origins and consequences of the government intervention summarized in this poster.
Figure 11.1 US Department of Labor Poster
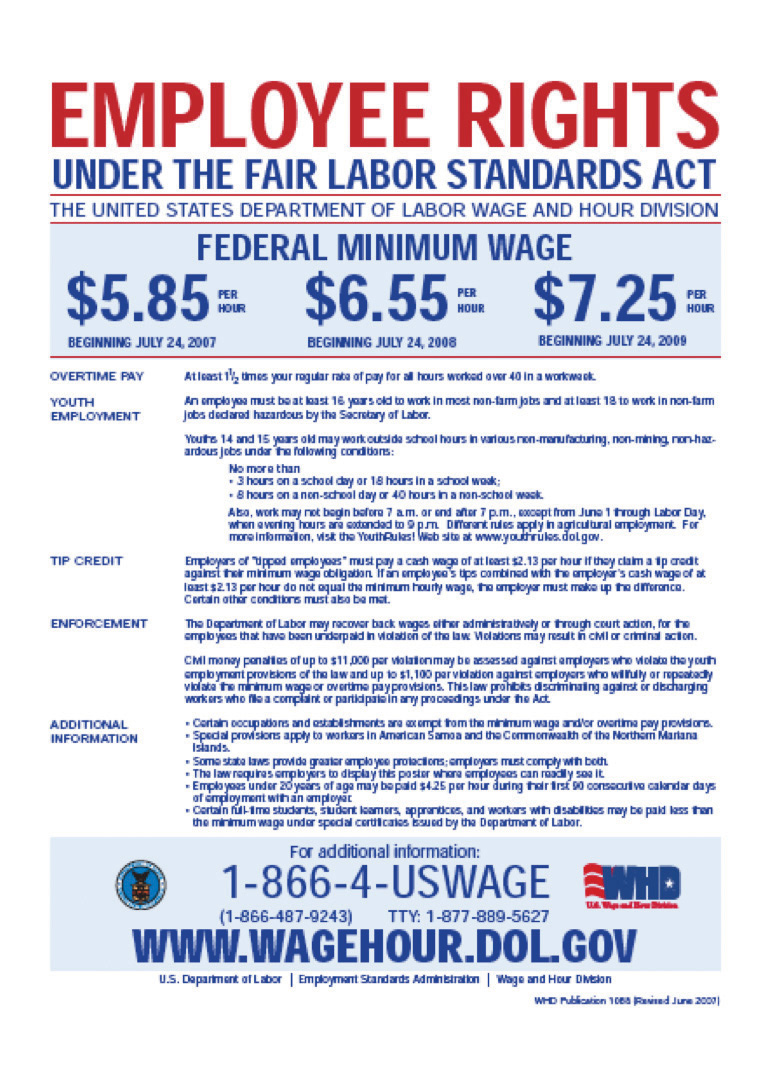
Governments enact such laws because they want to ensure that those who work earn a “living wage.” Were you to work in the United States at the current federal minimum wage for 40 hours a week, 50 weeks a year (a total of 2,000 hours), you would earn $14,500. This is slightly above the current poverty level for an individual (which is $11,369) but is well below the average income in the United States. Without minimum wage legislation, the wage earner in a family could have a full-time job, work hard every day, and still not be able to keep the family out of poverty.
Minimum wage laws have been in existence in some parts of the world for a long time. The Industrial Conciliation and Arbitration Act of New Zealand set a minimum wage more than a century ago, in 1894. The first minimum wage in the United States was established in Massachusetts in 1912. Working conditions at that time were terrible in comparison to those in modern developed economies. Women, men, and children worked long hours in very dangerous working conditions for extremely low pay. It was quite natural, confronted with these sweatshops, to feel that the government could do more to actively protect the rights of workers and secure a fair standard of living for them. Those of us fortunate to live in rich economies are now largely spared from such working conditions, but in much of the world, people continue to work in unsafe and unhealthy conditions for very low pay.
The US federal government first established a minimum wage in 1938, as part of the Fair Labor Standards Act. Not all workers were covered by this act, however. The US Constitution charges the federal government with the duty of regulating interstate trade, so the act originally covered only those workers who were involved with trade that crossed state lines. Over time, however, amendments to the legislation have increased its coverage, and it now applies to all workers.See the following discussion for more details: US Department of Labor, Wage and Hour Division (WHD), “Fact Sheet #14: Coverage Under the Fair Labor Standards Act (FLSA),” revised July 2009, accessed March 14, 2011, http://www.dol.gov/whd/regs/compliance/whdfs14.htm.
Prior to the Fair Labor Standards Act, many states instituted their own minimum wage laws, and minimum wages still differ from state to state. For example, Oregon’s current minimum wage is $8.50, about 17 percent higher than the federal minimum. These state-by-state differences complicate the life of economic historians who wish to study minimum wages. But for the economic analyst, these differences are extremely valuable because they are like an experiment: we can compare the experiences of different states with different laws.
In the United States, the minimum wage was raised in 2007, 2008, and 2009. Prior to that, the minimum wage had been constant for a decade; it had last been raised in 1997 following an act of Congress passed in 1995. President Clinton’s 1995 message to the Congress, accompanying his minimum wage proposal, laid out arguments for the minimum wage increase. The following quote is from the Congressional Record:
To the Congress of the United States:
I am pleased to transmit for your immediate consideration and enactment the ‘Working Wage Increase Act of 1995.’ This draft bill would amend the Fair Labor Standards Act to increase the minimum wage in two 45 cents steps—from the current rate of $4.25 an hour to $4.70 an hour on July 4, 1995, and to $5.15 an hour after July 3, 1996.
…
To reform the Nation’s welfare system, we should make work pay, and this legislation would help achieve that result. It would offer a raise to families that are working hard, but struggling to make ends meet. Most individuals earning the minimum wage are adults, and the average worker affected by this proposal brings home half of the family’s earnings. Numerous empirical studies indicate that an increase in the minimum wage of the magnitude proposed would not have a significant impact on employment. The legislation would ensure that those who work hard and play by the rules can live with the dignity they have earned.
I urge the Congress to take prompt and favorable action on this legislation.Congressional Record, February 13, 1995 (House), page H1677-H1678, accessed March 3, 2011, http://frwebgate2.access.gpo.gov/cgi-bin/TEXTgate.cgi?WAISdocID=C6M4yE/0/1/0&WAISaction=retrieve.
President Clinton’s words were forceful, and legislators in many different countries have been convinced by arguments such as these. Yet despite their widespread existence, minimum wage laws are highly contentious. Some commentators and analysts think that minimum wage laws are badly misguided and do much more harm than good.
The superficial appeal of minimum wage legislation is clear: it allows us to know that people who hold down jobs will at least earn a basic living wage—hard work will be rewarded by a minimum standard of living. Sometimes this is expressed differently: those who work hard should receive a “fair” wage for their efforts. (Fair is in quotation marks because not everyone agrees on what is fair and what is unfair, so it is hard to define exactly what the word means here.)Chapter 13 "Superstars" contains more discussion. In other words, minimum wage legislation has a redistributive goal: the aim is to put more of society’s resources in the hands of the working poor.
Economics, however, teaches us that many policy actions can have unintended consequences. To assess whether it is a good idea for the government to intervene in this manner, we need to develop a framework for understanding the effects of minimum wage laws. In particular, we want to answer the following questions:
- What are the consequences of a statutory minimum wage?
- Why is there so much disagreement about whether the minimum wage is a good idea?
We will not tell you whether or not the minimum wage is a good thing. By the end of this chapter, you should be in a position to make your own informed opinion about this controversial public policy question.
Road Map
Because the minimum wage says that firms are not allowed to pay below a certain price for the labor they hire, it is natural that our analysis focuses on the labor market. Of course, there is no single labor market—rather, we might think about there being many different markets for different types of skilled individuals. Lawyers, plumbers, engineers, web designers, and airline pilots earn much more than the minimum wage. In this chapter, though, we are focusing on people who earn relatively low wages, which means that we should look at the unskilled labor market. Sellers of labor in this market are not bringing any specialized skills; buyers of labor are not looking for any particular qualifications. The unskilled labor market is largely a market for time.
The minimum wage is set in terms of money—dollars in the United States, euros in France, and so on. Over time, increases in prices can erode the value of the minimum wage. We therefore begin this chapter by explaining how to adjust for the effects of higher prices. We then turn to the unskilled labor market. We look at what happens when we impose a minimum wage in that market, and then we look at what happens when the minimum wage changes.
Who is affected by minimum wage changes? Recognizing that people move in and out of jobs, we go beyond a supply-and-demand framework and consider these dynamic changes in the labor market. When we take into account these movements, we obtain a more sophisticated answer to this question. Then, once we are done with theory, we turn to evidence. We look at what different studies have found about the effects of changes in the real wage, and we assess how well these studies match up with our theory.
11.1 Nominal Wages and Real Wages
Learning Objectives
- What is the difference between the real minimum wage and the nominal minimum wage?
- What determines the equilibrium real wage and the level of employment?
When the federal minimum wage was first introduced in the United States in 1938, it was set at $0.25 per hour. Since then, Congress has raised the minimum wage several times. Figure 11.2 "Nominal Federal Minimum Wage in the United States" shows the minimum wage since 1938. You can see that the wage increases in steps whenever Congress enacts an increase in the wage.
Figure 11.2 Nominal Federal Minimum Wage in the United States
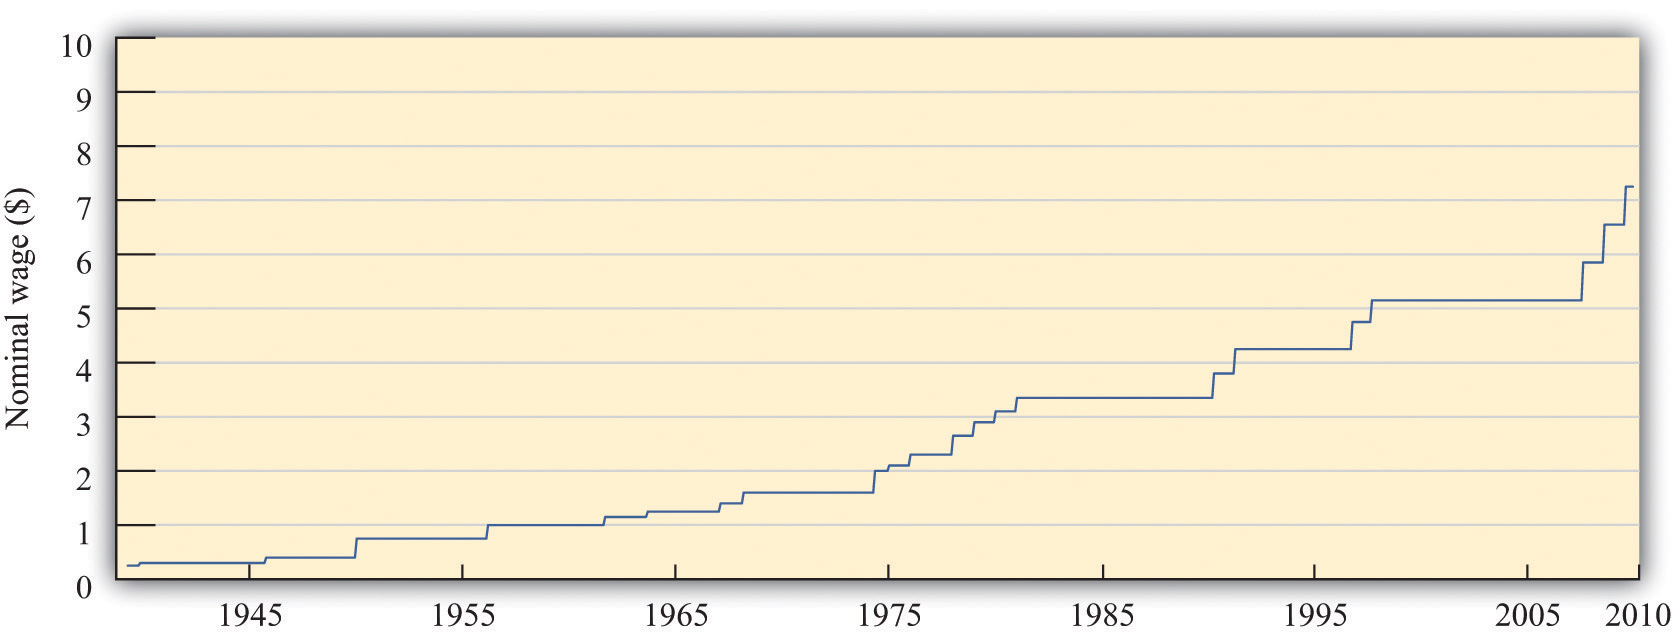
The figure shows the federal minimum wage in the United States. When introduced in 1938 the minimum wage was set at $0.25 per hour. The minimum wage, since 2009, is $7.25 per hour.
Source: US Department of Labor.
The repeated increases in the minimum wage are not primarily due to the increased generosity of the US Congress. As you probably know, prices and wages have also tended to increase over time—a process we call inflationA situation where, on average, the prices of goods and services are increasing.. The price level in 2007 was, on average, 14.8 times higher than in 1938, so $0.25 per hour is equivalent in modern terms to $3.70 ($0.25 × 14.8 = $3.70). Most of the increase in the minimum wage has simply been about keeping up with inflation. That said, the current minimum wage is $7.25, so the federal minimum wage has increased faster than the rate of inflation since its inception.
We call the wage in dollars the nominal wage. It is not the most useful measure of the amount that workers are receiving. Inflation means that a given nominal wage becomes worth less and less over time in terms of the goods and services that it buys. Between 1938 and 1957, for example, the general price level in the United States doubled. Had there been no change in the minimum wage, the $0.25 per hour minimum wage would have been worth only half as much in 1957 as it was when it was established.
From Nominal to Real Wages
The nominal wage is the wage measured in money (dollars in the United States). The real wageThe nominal wage (the wage in dollars) divided by the price level. is the nominal wage in an economy adjusted for changes in purchasing power. It is defined as the nominal wage divided by the general price level:
Workers care about the real wage, not the nominal wage, because the real wage captures the trade-off between leisure time and goods and services. Firms care about the real wage, not the nominal wage, because it measures the true cost of hiring labor. Figure 11.3 "Real Minimum Wage in the United States" shows the real minimum wage—that is, the minimum wage adjusted for inflation. The real minimum wage is defined as
Toolkit: Section 31.8 "Correcting for Inflation"
The conversion from nominal wages to real wages is an example of the more general idea of correcting for inflation. If you have data expressed in nominal terms (for example, in dollars) and want to covert them to real terms, you should follow the following four steps:
- Select your deflator. In most cases, the Consumer Price Index (CPI) is the best deflator to use. You can find data on the CPI (for the United States) at the Bureau of Labor Statistics website (http://www.bls.gov).
- Select your base year. Find the value of the index in that base year.
- For all years (including the base year), divide the value of the index in that year by the value in the base year. Notice that the value for the base year is 1.
- For each year, divide the value in the nominal data series by the number you calculated in step 3. This gives you the value in “base year dollars.”
Figure 11.3 Real Minimum Wage in the United States
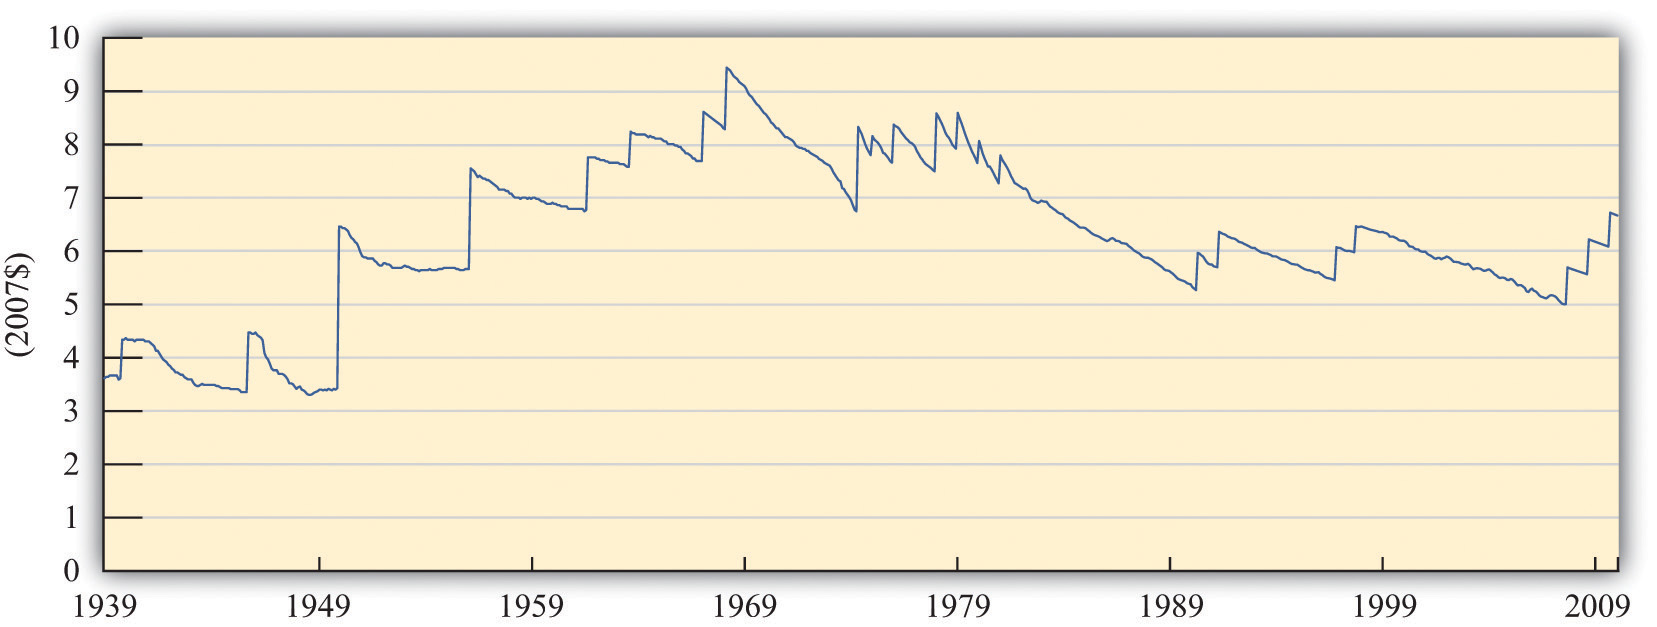
The minimum wage was at its highest in real terms in the 1960s, and the current minimum wage it is still well below that level.
Source: US Department of Labor and Bureau of Labor Statistics. Estimates for 2008 and 2009 are based on 2.5 percent annual inflation (equivalent to the average of the previous two years).
The real minimum wage increases in jumps whenever the nominal wage is increased, but it declines over time as it is eroded by inflation. The erosion of the minimum wage by inflation was recognized by President Clinton in the address that we quoted in our introduction. In that request to Congress he also said:
The first increment of the proposal simply restores the minimum wage to its real value following the change enacted in 1989.
If the Congress does not act now, the minimum wage will fall to its lowest real level in 40 years. That would dishonor one of the great promises of American life—that everyone who works hard can earn a living wage. More than 11 million workers would benefit under this proposal, and a full-time, year-round worker at the minimum wage would get a $1,800 raise—the equivalent of 7 months of groceries for the average family.
When President Clinton referred to “7 months of groceries,” he was converting the increase in the minimum wage into real terms, just as our technique for converting to inflation does. Instead of using the bundle of goods that goes into the CPI, however, he was using a bundle of goods representing groceries for the average family.
Nominal and Real Wages in the Labor Market
The challenge when analyzing the minimum wage is that it is set in nominal terms, but workers and firms care about the real minimum wage. To help us understand the difference, we begin with a specific numerical example of the labor market. Suppose we have the following labor supply-and-demand equations, where labor supply and labor demand are measured in hours:
labor supply = 10,000 × real wageand
labor demand = 72,000 – 8,000 × real wage.Think of this example as referring to the weekly demand for and supply of unskilled labor in a small city. It is reasonable to think of this as a competitive market, in which market participants will typically agree on a price at or close to the point where supply equals demand. In the supply-and-demand framework, the intersection of the supply and demand curves tells us the equilibrium price in the market and the equilibrium quantity traded. In the labor market, the place where supply and demand meet tells us the equilibrium wage and the equilibrium number of hours worked.
Toolkit: Section 31.3 "The Labor Market", and Section 31.9 "Supply and Demand"
You can find more detail about the underpinnings of labor market supply and demand and the workings of the competitive market in the toolkit.
First we solve for the equilibrium in this market. In equilibrium, the quantity of labor supplied equals the quantity of labor demanded, so
10,000 × real wage = 72,000 – 8,000 × real wage.Add (8,000 × real wage) to each side:
18,000 × real wage = 72,000.Then divide both sides by 18,000 to obtain
real wage = 4.If we plug this value of the real wage back into either the supply or the demand equation, we find that the equilibrium quantity of hours worked is 40,000 hours. For example, we might have 1,000 workers, each of whom works a 40-hour week. The equilibrium is illustrated in Figure 11.4 "Labor Market Equilibrium".
Figure 11.4 Labor Market Equilibrium
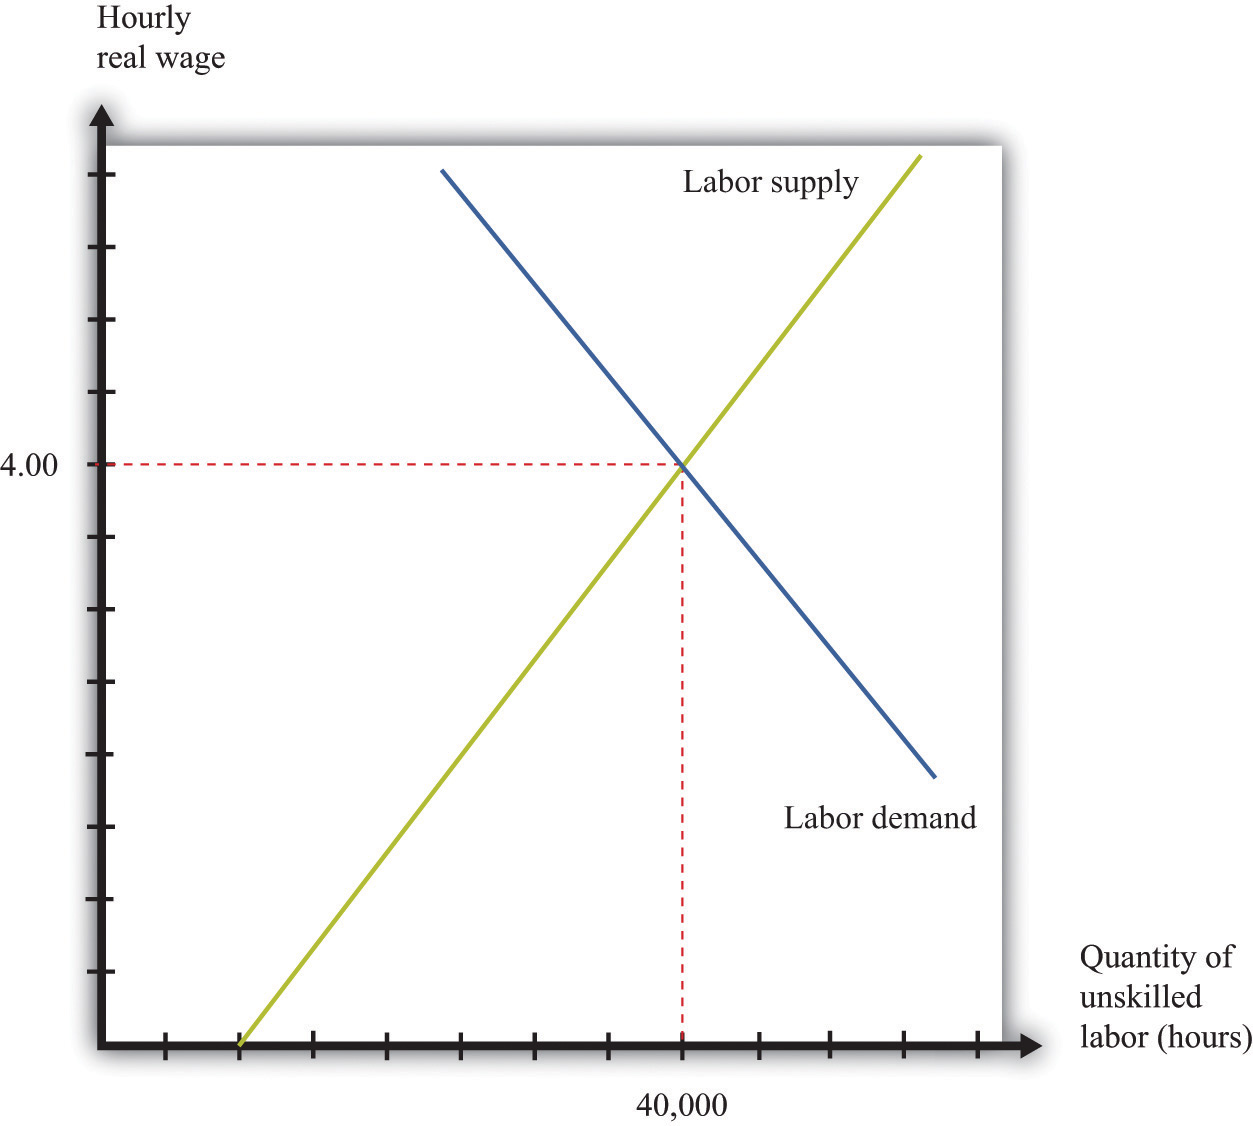
The market for unskilled labor is in equilibrium at an hourly wage of $4 and a total of 40,000 hours. In this diagram, we assume that the price level is 1, so the real wage equals the nominal wage.
Suppose that this example pertains to the base year. From our discussion of correcting for inflation, we know that in the base year we set the price level equal to 1. When the price level is 1, the real wage equals the nominal wage. In the initial year, therefore,
and
In the base year, the nominal wage is $4 per hour.
Now imagine we have 10 percent inflation, which means that the price of all goods and services in the economy increases by 10 percent over the course of a year. If a household paid $100 a week for groceries last year, it must pay $110 this year; if a household used to pay $500 a month in rent, it must now pay $550; and so on. Turning this around, a dollar is worth less than it used to be; you need $1.10 to purchase what you could have bought for $1 this year. The price level has increased from 1 to 1.1.
To see what this means in terms of the labor market diagram, think about the situation at a given nominal wage, such as $2.20 per hour. Last year, when the price level was 1, households were willing to supply 22,000 hours (= 10,000 × 2.2). But $2.20 now is worth the equivalent of only $2, so households are willing to supply only 20,000 (10,000 × = 10,000 × 2) hours of labor instead. The same idea applies at every wage; households will supply only the amount of labor that they would previously have supplied when the wage was 10 percent higher.
A similar logic applies to the demand for labor. The increase in the price level means that firms get 10 percent more dollars for the goods that they sell. As a consequence, the labor performed by workers generates more dollars than it used to. If it was worth paying $7 for an hour of work before, it is now worth paying $7.70 for that same hour of work.
In terms of real wages, however, nothing has changed. The equilibrium real wage is still $4, as it was before. But because
the nominal wage must increase by 10 percent to match the increase in the price level. The equilibrium in the labor market is shown in Figure 11.5 "Labor Market Equilibrium after 10 Percent Inflation". It is no coincidence that this diagram looks exactly the same as Figure 11.4 "Labor Market Equilibrium"; that is the point. An increase in the price level is matched by an increase in the nominal wage, and nothing changes in terms of the real wage or the real equilibrium quantity of labor.
Figure 11.5 Labor Market Equilibrium after 10 Percent Inflation

If there is 10 percent inflation, the price level increases from 1 to 1.1, the real wage is unchanged, and the nominal wage increases by 10 percent.
Key Takeaways
- The nominal minimum wage is set by governments. The real minimum wage is the real value of the nominal minimum wage. It is determined by dividing the nominal minimum wage by the price level.
- The levels of the real wage and employment are determined by labor market equilibrium.
Checking Your Understanding
- Looking at Figure 11.3 "Real Minimum Wage in the United States", explain why the real minimum wage increases very quickly but never decreases very quickly.
- Why do labor demand and supply depend on the real and not the nominal wage?
11.2 The Effects of a Minimum Wage
Learning Objectives
- What happens when a government imposes a minimum wage?
- If there is inflation under a minimum wage system, what happens to the level of employment?
- What are the efficiency costs of a minimum wage?
Adam Smith, the 18th-century economist who founded modern economics, had a vivid metaphor for the idea that supply would equal demand in a competitive market: he referred to an “invisible hand” guiding markets to equilibrium. Joan Robinson, a famous economist at Cambridge University in the first half of the 20th century, wrote that “the hidden hand will always do its work but it may work by strangulation.”Joan Robinson, “The Pure Theory of International Trade,” in Collected Economic Papers (Oxford: Basil Blackwell, 1966), 189. What she meant by this was there is no guarantee that the equilibrium wage in the market would in fact be a living wage.
The Imposition of a Minimum Wage
When the government imposes a minimum wage, firms are not permitted to pay less than the amount that the government mandates. Suppose we are again in the base year, so the price level is 1. Imagine that the market equilibrium wage is $4 per hour, but the government now passes legislation stating that all firms must pay at least $5 per hour. At this wage, supply does not equal demand. Figure 11.6 "Labor Market with a Minimum Wage" illustrates what happens.
Figure 11.6 Labor Market with a Minimum Wage
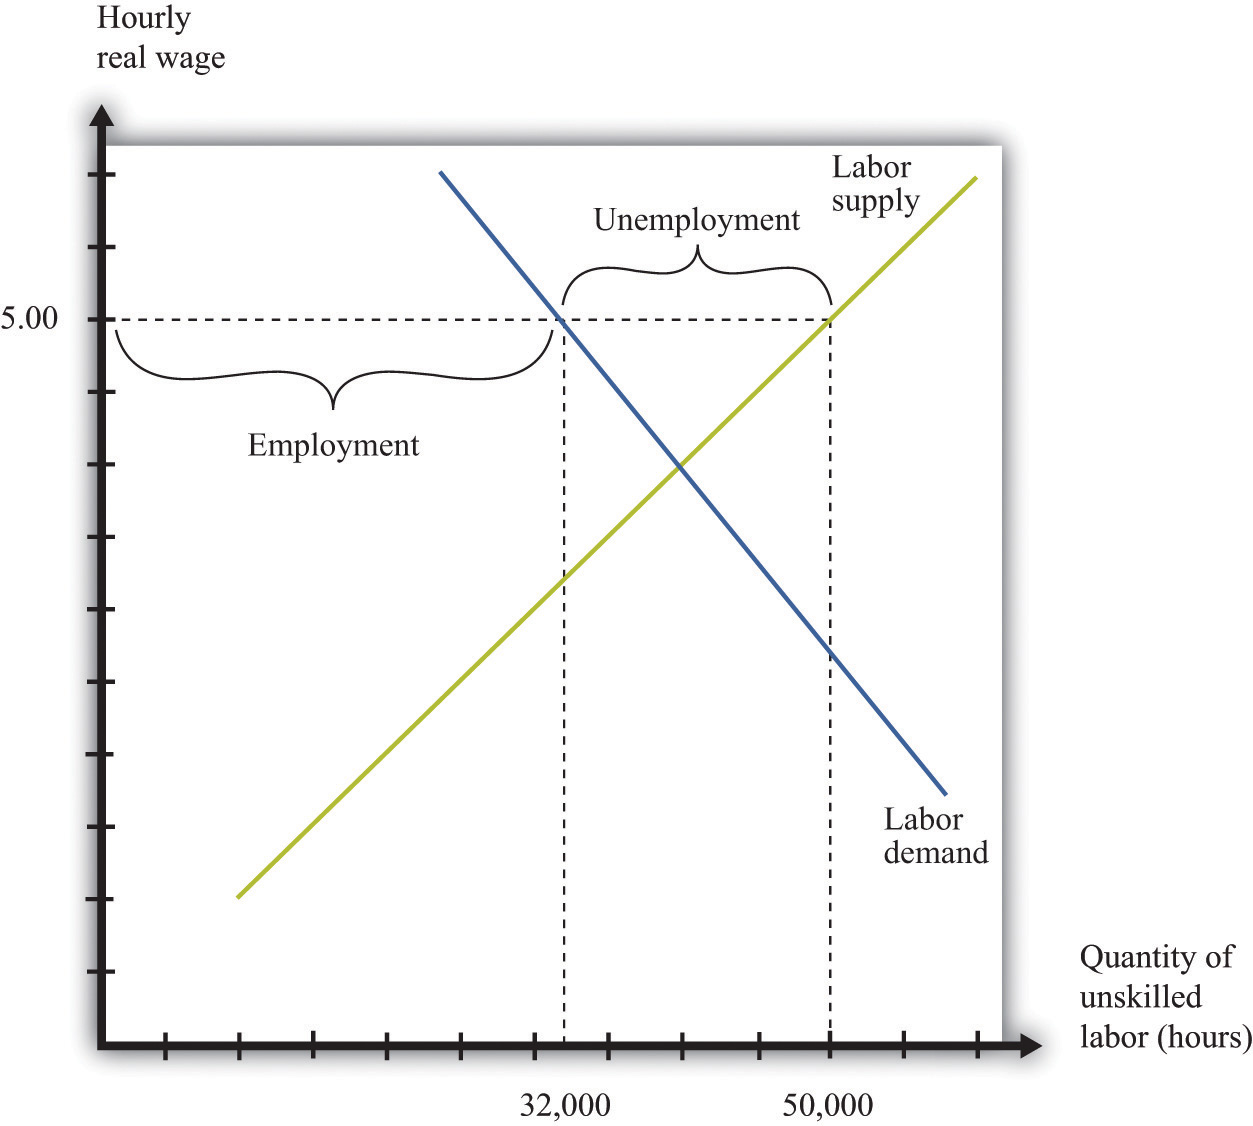
With a minimum wage of $5, the supply of labor is 50,000 hours, but firms demand only 32,000 hours of labor, so the labor market is not in equilibrium.
Markets are based on voluntary trades. In Figure 11.6 "Labor Market with a Minimum Wage", we see that sellers (the workers who supply labor) would like to sell 50,000 hours of labor to the market at the set minimum wage—that is, 250 more people would like to have a 40-hour-a-week job when the wage increases from $4 to $5. But firms wish to purchase only 32,000 hours of labor—firms want to hire 200 fewer workers (8,000 fewer hours). In a market with voluntary trade, no one can force firms to hire workers. As a result, the equilibrium quantity of labor traded in the market will be determined by how much the firms wish to buy, not how much workers want to sell.
We can now answer our first motivating question of the chapter: what is the consequence of imposing a minimum wage? Two things happen when the government imposes a minimum wage:
- The amount of labor hired in the market decreases. In our example, the number of unskilled workers employed decreases from 1,000 to 800. Thus while those who have jobs earn a higher wage, there are now some individuals who no longer have jobs. Employment has decreased.
- At the government-imposed wage, there are more people who want to work than are able to find jobs. Thus the minimum wage has created unemployment. Because 1,250 people would like jobs at a wage of $5 but only 800 jobs are available, 450 people are unemployed; they would like a job at the prevailing wage, but they are unable to find one.
The number of unemployed workers is 450, even though employment decreased by only 200 workers. The difference comes from the fact that the higher wage also means that more people want to work than before. In this case, the higher wage means 250 more people would like a job.
We have assumed in this discussion that everyone works for 40 hours, in which case the number of people employed must decrease by 200. Another possibility is that everyone who wants a job is able to get one, but the number of hours worked by each individual decreases. Because there are 32,000 hours of work demanded and 1,250 people who want jobs, each worker would work 25.6 hours a week. In this situation, we say that there is underemployment rather than unemployment. Yet another possibility is that, after the introduction of the minimum wage, the number of people employed stays the same as before (1,000), but those individuals are allowed to work only 32 hours per week. In this case, we have both underemployment (of the previously employed) and unemployment (of the extra workers who want a job at the higher wage). In real-life situations, there may be both unemployment and underemployment.
Inflation and the Minimum Wage
Although inflation made no difference to our basic analysis of the labor market, it does change our analysis of the minimum wage. Minimum wages are fixed in nominal terms and do not automatically change when there is inflation. So if the minimum wage is set at $5 and the price level increases from 1 to 1.1, the real minimum wage declines. Looking back at the definition of the real minimum wage, we find that
The effect of a reduction in the real minimum wage is shown in Figure 11.7 "A Reduction in the Real Minimum Wage". At the lower real wage, firms are willing to hire more workers. Employment increases from 32,000 hours to 35,600 hours: 90 more people can find jobs.
Figure 11.7 A Reduction in the Real Minimum Wage
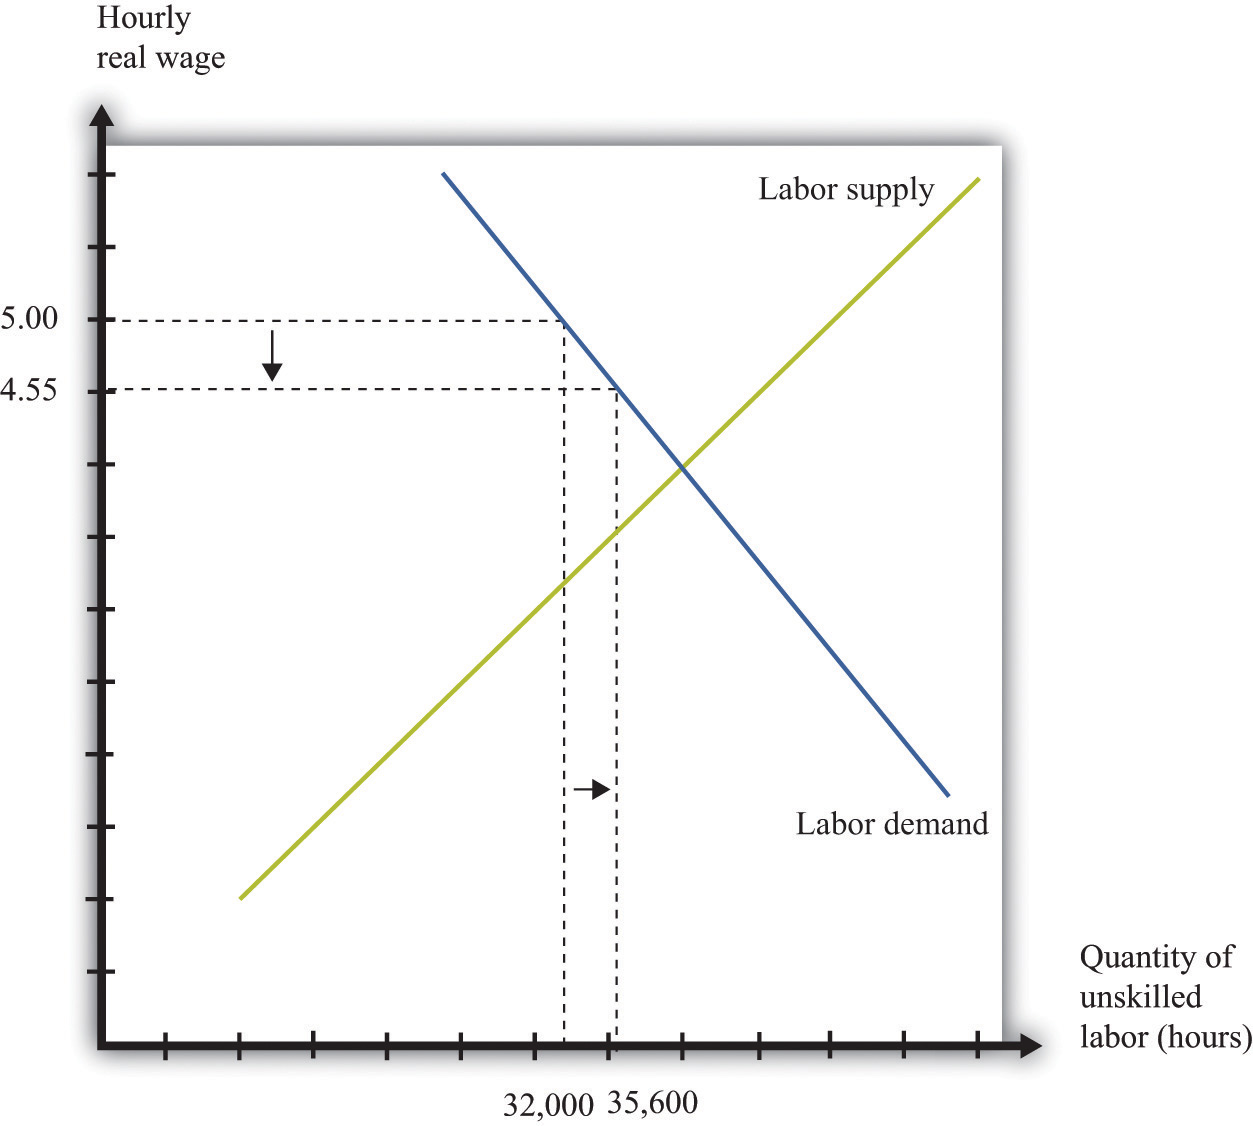
A 10-percent increase in the price level leads to a reduction in the real minimum wage to $4.55 and an increase in employment from 32,000 to 35,600.
In Figure 11.7 "A Reduction in the Real Minimum Wage", the real minimum wage of $4.55 is still higher than the equilibrium wage of $4.00. To put the same point another way, the equilibrium nominal wage has increased to $4.40, but this is still below the nominal minimum wage of $5.00. However, if the price level were to increase by 25 percent or more from the base year, the minimum wage would become completely irrelevant. The minimum wage would be below the market wage. Economists say that the minimum wage would no longer be “binding” in this case.
It is exactly this process of increasing prices that lies behind Figure 11.3 "Real Minimum Wage in the United States". As the price level increases, the minimum wage becomes worth less in real terms (and has less of an effect on employment). Eventually, Congress acts to increase the minimum wage to bring it back in line with inflation—although, as Figure 11.3 "Real Minimum Wage in the United States" shows, Congress has allowed the real minimum wage to decline substantially from its high point in the late 1950s. The reduction in the real minimum wage also leads to a reduction in unemployment, as shown in Figure 11.8 "Effects on Unemployment of a Reduction in the Real Minimum Wage".
Figure 11.8 Effects on Unemployment of a Reduction in the Real Minimum Wage
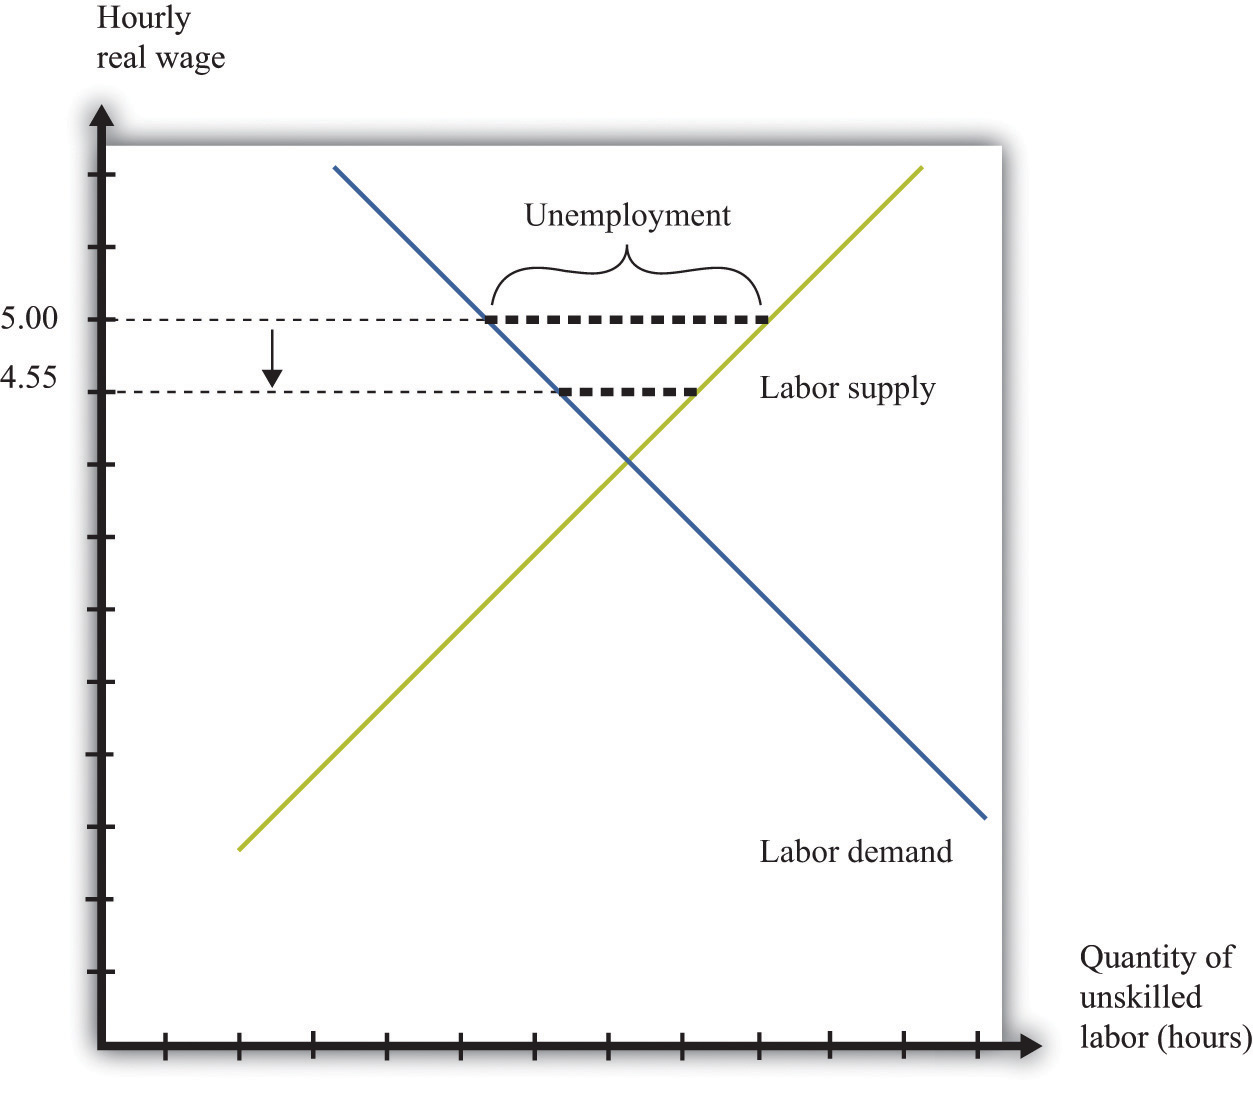
The reduction in the real minimum wage to $4.55 leads to a decrease in unemployment.
Efficiency Implications of a Minimum Wage
Markets are a mechanism that allow individuals to take advantage of gains from trade. Whenever a buyer has a higher valuation than a seller for a good or service, they can both benefit from carrying out a trade. This is how economies create value—by finding opportunities for mutually beneficial trades.
The minimum wage interferes with this process in the unskilled labor market. It reduces employment, which is the same as saying that fewer transactions take place. Because each voluntary transaction by definition generates a surplus, anything that reduces the number of transactions causes a loss of surplus. In economists’ terminology, the minimum wage leads to a departure from efficiencyThe basis that economists use for judging the allocation of resources in an economy.. We can represent that inefficiency graphically. Figure 11.9 "Deadweight Loss from Minimum Wage" shows the effect of the minimum wage, using the ideas of buyer surplus and seller surplus.
Toolkit: Section 31.10 "Buyer Surplus and Seller Surplus" and Section 31.11 "Efficiency and Deadweight Loss"
You can review the different kinds of surplus, as well as the concepts of efficiency and deadweight loss, in the toolkit.
Figure 11.9 Deadweight Loss from Minimum Wage
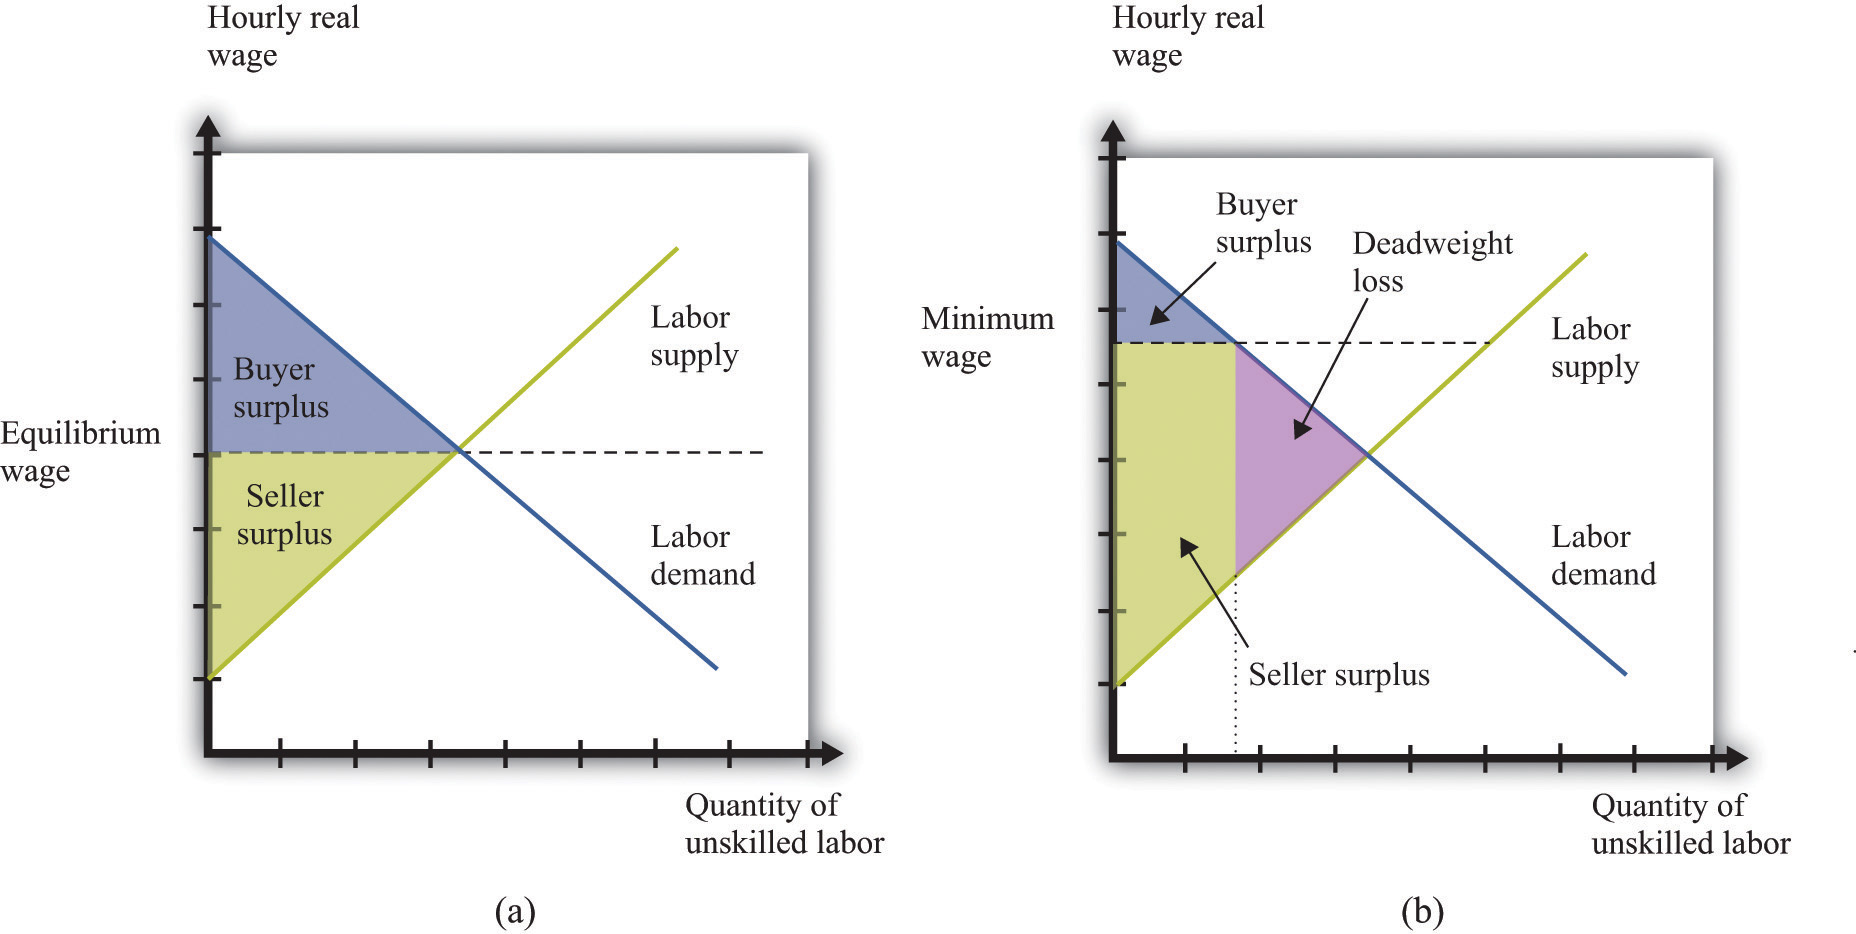
With no minimum wage (a), all the possible gains from trade in the market are realized, but with a minimum wage (b), some gains from trade are lost because there are fewer transactions.
In part (a) of Figure 11.9 "Deadweight Loss from Minimum Wage", we see the market without the minimum wage. In the labor market, it is the firm who is the buyer. The total buyer surplus is the profitRevenues minus costs. that firms obtain by hiring these workers; it is the difference between the cost of hiring these workers and the revenues that they generate. Graphically, it is the area below the labor demand curve and above the market wage. The total sellersellers’ surplus#8217;s surplus is the benefit that accrues to workers from selling labor time. Sellers of labor (workers) receive surplus equal to the area below the market wage and above the supply curve.
In part (b) of Figure 11.9 "Deadweight Loss from Minimum Wage", we show the effect of the minimum wage. As we already know, the higher wage leads to a reduction in employment. Fewer transactions occur, so the total surplus in the market is reduced. Economists call the lost surplus the deadweight lossThe economic surplus that disappears as a result of any policy that distorts a competitive market and thus causes the total volume of trade to differ from the equilibrium level. from the minimum wage policy.
The most obvious cost of the minimum wage is this loss of surplus. But there may be other hidden costs as well. Whenever people are prevented from carrying out mutually beneficial trades, they have an incentive to try to get around these restrictions. Firms and workers may try to “cheat,” conducting hidden transactions below the minimum wage. For example, a firm might pay a worker for fewer hours than he or she actually worked. Alternatively, a firm might reduce other benefits of the job. Such cheating not only subverts the minimum wage law but also uses up resources because the firm and the worker must devote effort to devising ways around the law and ensuring that they do not get caught.
The loss in surplus could also be greater than is shown in Figure 11.9 "Deadweight Loss from Minimum Wage". The figure is drawn under the presumption that the trades taking place in the labor market are the ones that generate the most surplus. But suppose that the minimum wage is $5.00. It is possible that someone who would be willing to work for, say, $2.00 an hour loses her job, whereas someone willing to work for, say, $4.50 is employed.
Remember that if there were no restrictions in the labor market, the wage would adjust so that anyone wanting to work could find a job. This means that both the person willing to work for $2.00 and the person willing to work for $4.50 could both find a job as long as the wage is above $4.50. If the equilibrium wage were $4.00, then the person willing to work for only $4.50 would not be employed. In either case, this is the efficient outcome, consistent with obtaining all the gains from trade.
Key Takeaways
- When the government imposes a minimum wage, the real wage is determined by the minimum wage divided by the price level, not by the interaction between labor supply and demand.
- If there is inflation and a fixed nominal minimum wage, then the level of employment will increase and the real minimum wage will decrease.
- The minimum wage creates deadweight loss because some trades of labor services do not take place.
Checking Your Understanding
- Draw a diagram for a labor market where the minimum wage is not binding.
- What happens to the real minimum wage and the level of employment if there is deflation—that is, if the price level decreases?
11.3 Minimum Wage Changes
Learning Objectives
- What happens to the levels of employment and unemployment if the real minimum wage increases?
- What determines the size of the change in employment when the real minimum wage increases?
- What determines the size of the change in unemployment when the real minimum wage increases?
Suppose that the government is considering an increase in the minimum wage. What should we expect to happen? How will firms and workers respond? One might be tempted simply to ask firms what they would do in the face of an increase in the minimum wage. Unfortunately, this is likely to be both infeasible (or at least prohibitively expensive) and inaccurate. It would be an immense amount of work to interview all the firms in an economy. What is more, there is no guarantee that managers of firms would give accurate answers if they were asked hypothetical questions about a change in the minimum wage. Instead, government statisticians use statistical sampling techniques to interview a random sample of firms in an economy, and they ask them about their actual behavior—they ask questions such as the following: “How many workers do you employ at present?” and “How much do you pay them?” The data from such surveys are useful but do not directly help us determine the effects of a change in the minimum wage. For this we need more theory.
The Effect of a Minimum Wage Increase on Employment and Unemployment
Figure 11.10 "Effects of Increasing the Real Minimum Wage" amends our view of the labor market to show an increase in the minimum wage from $5 to $6. (We suppose that the price level is constant, so an increase in the nominal minimum wage implies an increase in the real minimum wage.) The increase in the minimum wage leads to a reduction in the level of employment: employment decreases from 32,000 to 24,000. Labor is now more expensive to firms, so they will want to use fewer hours. At the same time, the higher minimum wage means that more people would like jobs. The increase in the amount of labor that people would like to supply, and the decrease in the amount of labor that firms demand, both serve to increase unemployment.
Figure 11.10 Effects of Increasing the Real Minimum Wage
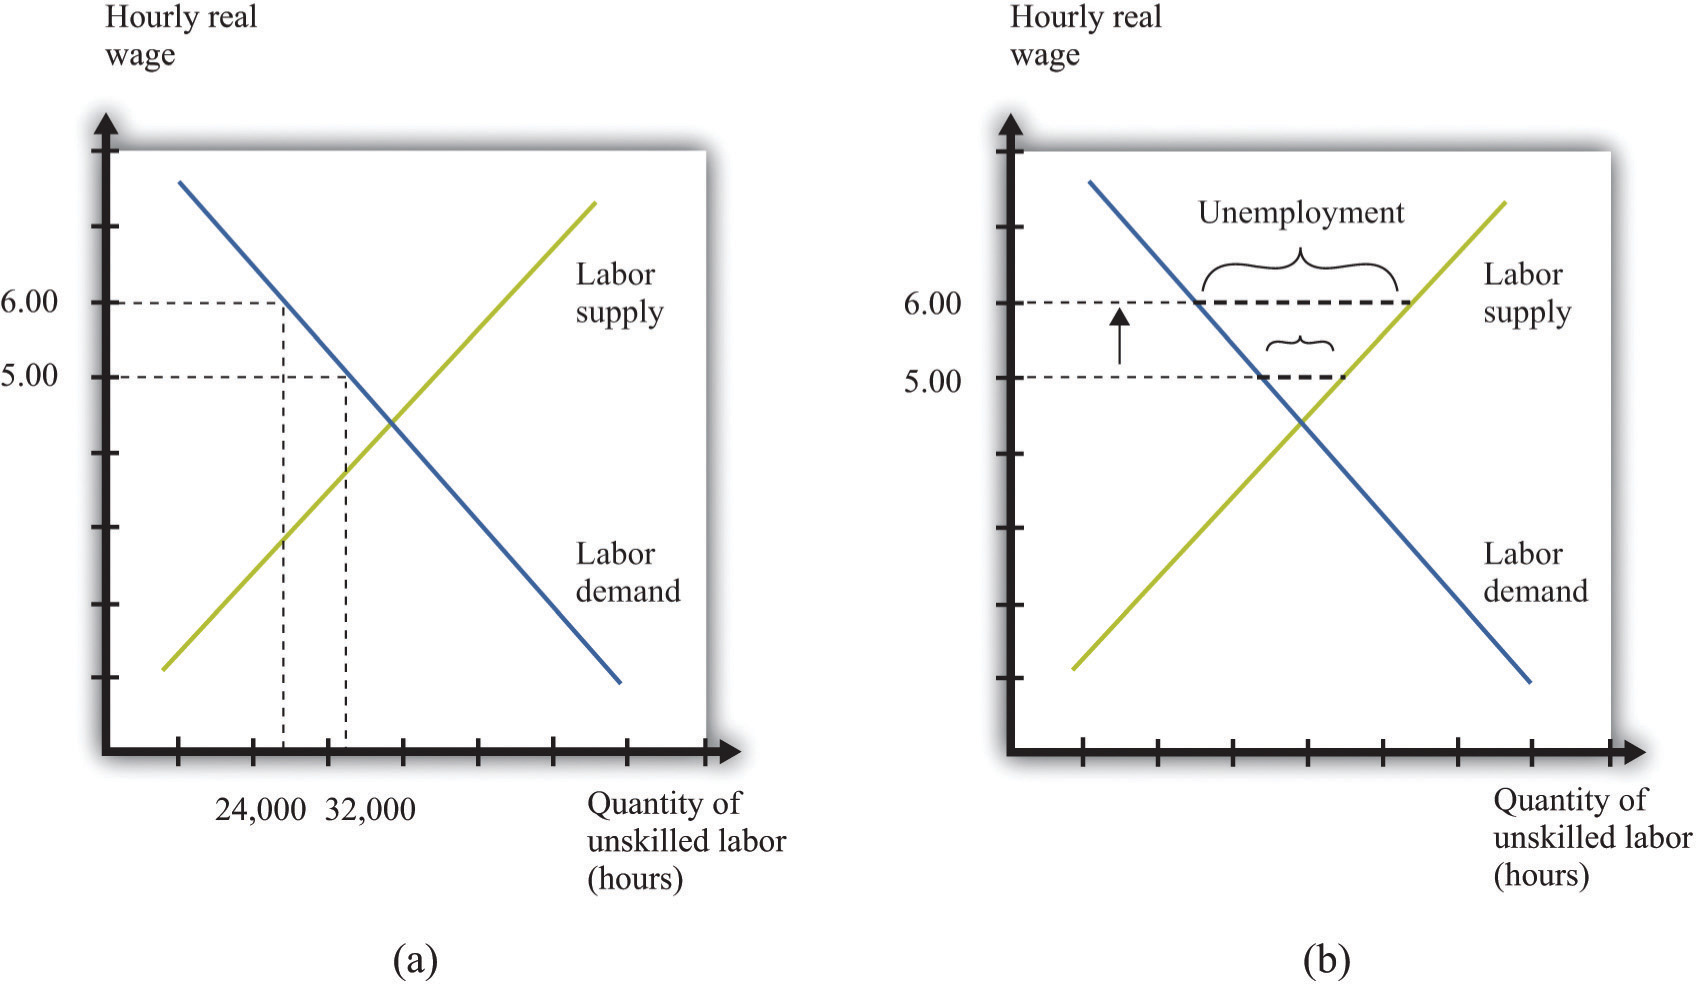
An increase in the value of the hourly real minimum wage from $5 to $6 leads to a decrease in employment from 32,000 hours to 24,000 hours (a) and an increase in unemployment (b).
Our model generates a qualitative prediction: an increase in the minimum wage will decrease employment and increase unemployment. At the same time, the wage increase will ensure that those with jobs will earn a higher wage. So we can see that there may be both advantages and disadvantages of increasing the minimum wage. To go further, we have to know how big an effect such a change would have on employment and unemployment—that is, we need the quantitative effects of a higher minimum wage.
To understand the quantitative effects, we want to know when to expect big or small changes in employment or unemployment—which depends on the wage elasticity of labor demandThe percentage change in the quantity of labor demanded divided by the percentage change in the wage. and the labor supply. Remembering that the wage is simply the price in the labor market, the wage elasticity of demand is an example of the price elasticity of demandThe percentage change in the quantity demanded in the market divided by the percentage change in price. in a market:
From Figure 11.10 "Effects of Increasing the Real Minimum Wage", we can see that the wage elasticity of labor demand tells us everything we need to know about the effects of a change in the wage on employment. If the demand curve is relatively elastic, then a change in the minimum wage will lead to a relatively large change in employment. If the demand curve is relatively inelastic, then a change in the minimum wage will lead to a relatively small change in employment. This is intuitive because the elasticity of labor demand tells us how sensitive firms’ hiring decisions are to changes in the wage. An elastic demand for labor means that firms will respond to a small change in the wage by laying off a large number of workers, so the employment effect will be large. The elasticity of labor supply is not relevant if we are concerned only with employment effects. This is illustrated in Figure 11.11 "The Employment Effect of a Change in the Minimum Wage" and summarized in Table 11.1 "Employment Effects of a Change in the Real Minimum Wage".
Figure 11.11 The Employment Effect of a Change in the Minimum Wage
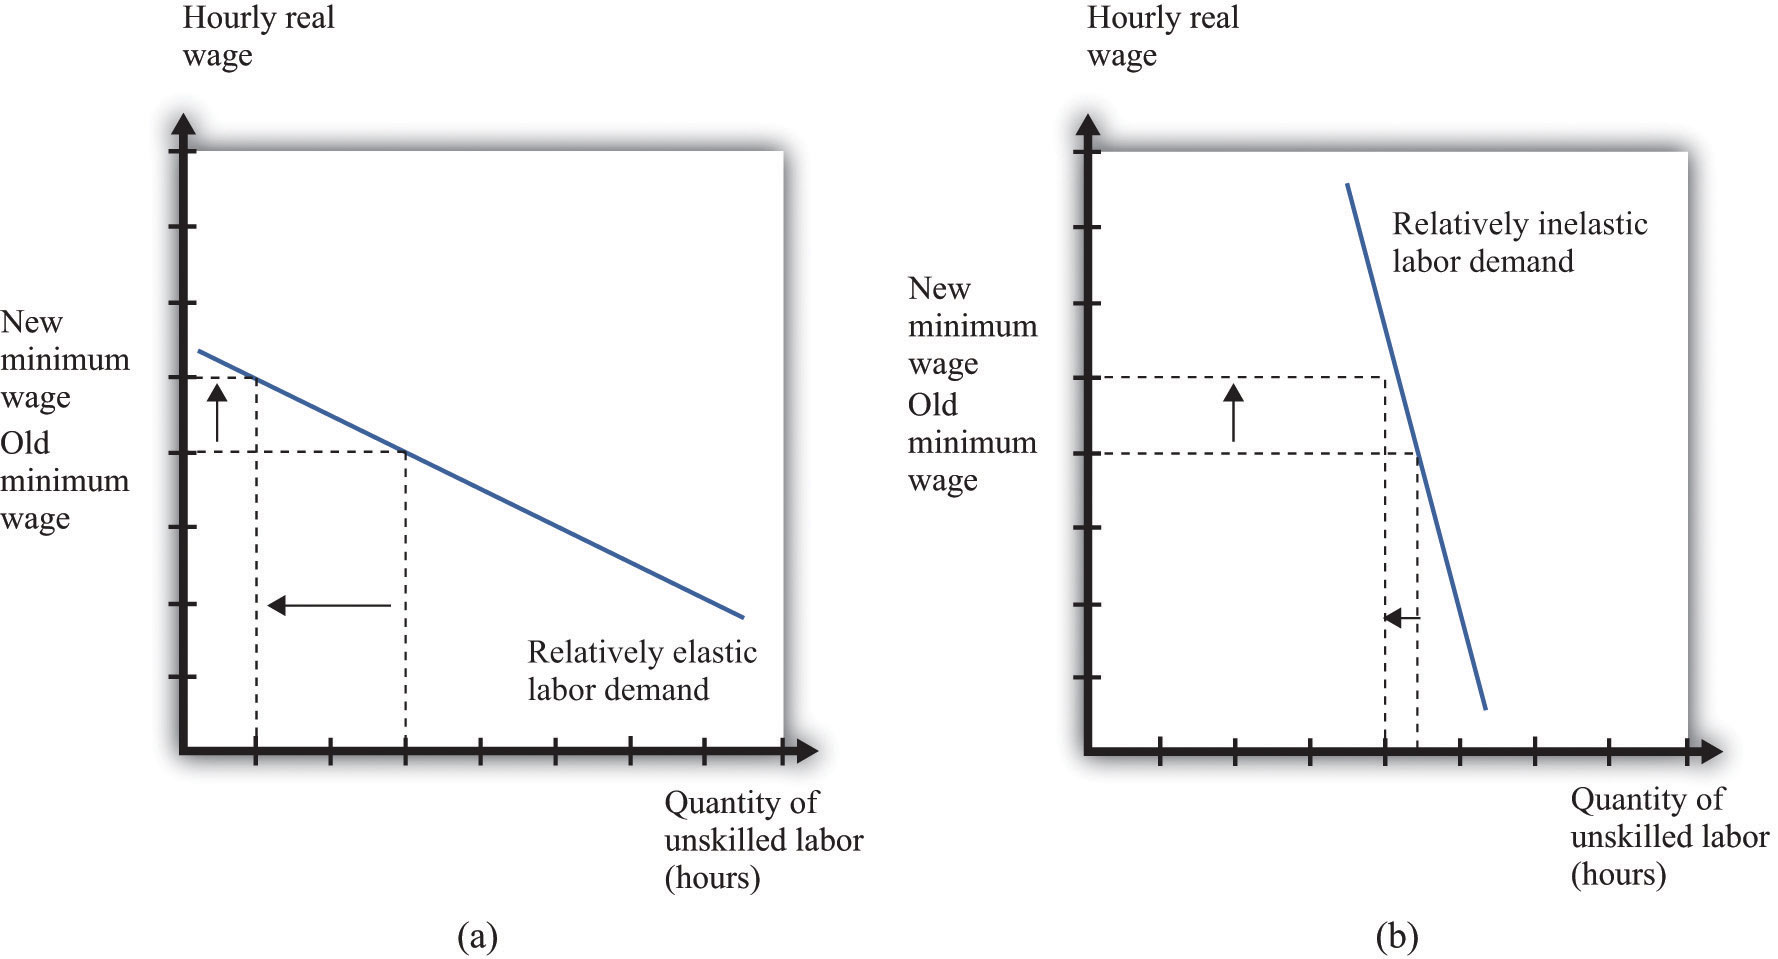
If labor demand is relatively elastic (a), a change in the minimum wage has a big effect on employment, while if labor demand is relatively inelastic (b), the same change in the minimum wage has a much smaller effect on employment.
Table 11.1 Employment Effects of a Change in the Real Minimum Wage
| Effect on Employment | |
|---|---|
| Elastic demand | Large change |
| Inelastic demand | Small change |
If we are interested in the effect on unemployment, however, we must look at both demand and supply. A worker is counted as unemployed if he or she is looking for a job but does not currently have a job. The labor supply curve tells us how many workers are willing to work at a given wage; those who are not employed are looking for a job. To understand the effects of the minimum wage on unemployment, we need to look at the mismatch between supply and demand at the minimum wage, so we must look at the supply of labor as well as the demand for labor. The price elasticity of supplyThe percentage change in the quantity supplied to the market divided by the percentage change in price. measures the responsiveness of the quantity supplied to a change in the price: in the case of the labor market, we obtain the wage elasticity of labor supplyThe percentage change in the quantity of labor supplied divided by the percentage change in the wage.:
Toolkit: Section 31.2 "Elasticity"
You can review the general definition and calculation of elasticities in the toolkit.
The more elastic the labor supply curve, the bigger the change in labor supply for a given change in the real wage (Figure 11.12 "The Unemployment Effect of a Change in the Minimum Wage"). A bigger change in labor supply means a bigger change in unemployment. Combining this with Table 11.1 "Employment Effects of a Change in the Real Minimum Wage", we get the results summarized in Table 11.2 "Unemployment Effects of a Change in the Real Minimum Wage". If demand and supply are both inelastic, the change in the minimum wage has little effect on unemployment. The higher wage does not make much difference to firms’ hiring decisions (inelastic demand), and it does not induce many additional workers to look for a job (inelastic supply). The overall effect on unemployment is small. By contrast, if both curves are elastic, then an increase in the wage will lead to a big decrease in the number of jobs available and a big increase in the number of job seekers. If we can find good estimates of the elasticities of labor demand and supply, we will be able to make good predictions about the likely effect of an increase in the minimum wage.
Figure 11.12 The Unemployment Effect of a Change in the Minimum Wage
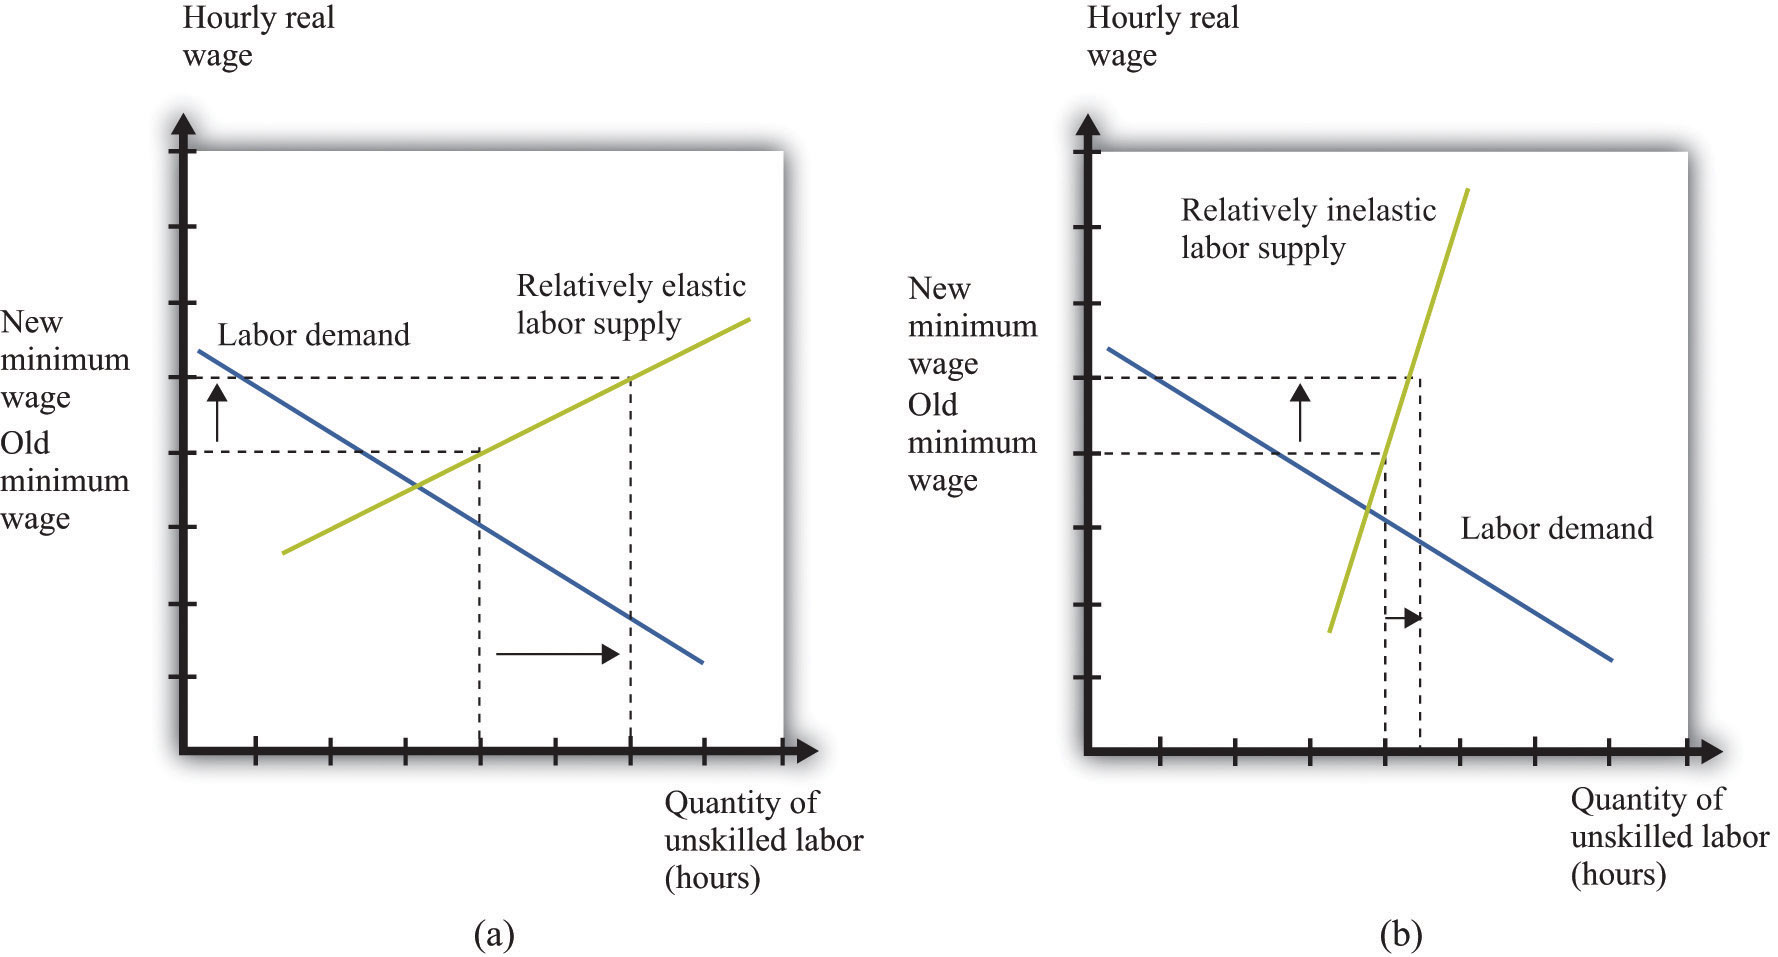
If the labor supply is relatively elastic (a), a change in the minimum wage has a big effect on unemployment, while if the labor supply is relatively inelastic (b), the same change in the minimum wage has a much smaller effect on unemployment.
Table 11.2 Unemployment Effects of a Change in the Real Minimum Wage
| Effects on Unemployment | ||
|---|---|---|
| Elastic Supply | Inelastic Supply | |
| Elastic demand | Very large change | Large change |
| Inelastic demand | Large change | Small change |
Key Takeaways
- All else being the same, an increase in the real minimum wage will reduce employment and increase unemployment.
- The size of the change in employment when the minimum wage increases is determined by the elasticity of the labor demand curve.
- The size of the change in unemployment when the minimum wage increases is determined by the elasticities of the labor demand and supply curves.
Checking Your Understanding
- Why doesn’t the elasticity of labor supply matter for the effects of changes in the real minimum wage on employment?
- If prices increase, what will happen to the level of unemployment when there is a binding minimum wage?
11.4 The Minimum Wage and the Distribution of Income
Learning Objectives
- Which parts of the economy are affected by the minimum wage?
- When the minimum wage increases, who gains and who loses?
- What is an equity-efficiency trade-off?
We said earlier that governments impose minimum wages because they care about ensuring that the working poor earn a fair wage. Another way of saying this is that the minimum wage is an intervention by the government that is meant to change the distribution of society’s resources. If unskilled workers are going to earn more, then this means they are obtaining more of the total resources available in an economy. And if they are getting more, then somebody else must be getting less. We would like to have some way of thinking about the effects of the minimum wage on the distribution of income.
To talk about distribution, we need to divide society into groups and then examine how much each group gets. One group is obviously those who receive the minimum wage—the working poor. Another group we need to consider is the unemployed. And then there is everybody else: all of those individuals who are sufficiently skilled to have jobs that pay more than the minimum wage. This is a large group, encompassing electricians and CEOs, but—for our present purposes—it makes sense to group them all together. Let’s call them the “relatively rich,” by which we mean that they are richer than unemployed or employed unskilled workers. So we have three groups: the unemployed, the working poor, and the relatively rich. How are these groups affected by an increase in the minimum wage?
Winners and Losers from the Minimum Wage
We know that the working poor are made better off by an increase in the minimum wage—after all, the whole point of the increase is to ensure that these individuals earn more. We can see this gain in Figure 11.9 "Deadweight Loss from Minimum Wage": it is the extra surplus that sellers obtain at the expense of buyers. Remember, though, that some of the working poor will lose their jobs as a result of the higher minimum wage. So our first conclusion is that those members of the working poor who keep their jobs are unambiguously made better off.
The increase in the minimum wage means that there are more people who are unemployed. Those who are already unemployed are not directly affected by the increase in the minimum wage. These unemployed individuals may be indirectly affected, however, because it becomes harder for them to find jobs.
Are there any effects on the relatively rich? The answer is yes. The increase in the minimum wage means that firms will earn lower profits. We can see this because buyer surplus is reduced in Figure 11.9 "Deadweight Loss from Minimum Wage". Although firms are just legal entities, they are owned by individuals. When a firm earns lower profits, the shareholders of that firm receive lower income. The working poor and the unemployed are not, for the most part, individuals with portfolios of stocks; the shareholders of firms are the relatively rich. Thus the relatively rich are made worse off by the increase in the minimum wage. Our broad conclusion is therefore that the working poor benefit from an increase in the minimum wage, but everybody else in society is made worse off.
There is another concern when we think about the distribution of income. One consequence of the minimum wage is that jobs become a scarce resource: more people want jobs than there are jobs available. We must consider how this scarce resource is allocated. Do workers line up outside factory gates? In this case, the time that they spend waiting in line is an additional cost of the minimum wage. Does some individual control who gets hired? Then there is the potential for corruption, whereby jobs are sold, meaning that the gains from the minimum wage flow not to workers but to this individual instead.
Does the Minimum Wage Benefit Unskilled Labor as a Whole?
We have concluded so far that the minimum wage benefits the working poor but at the cost of creating unemployment: some people who used to have jobs will lose them as a result of the minimum wage. Because of the flows between unemployment and employment in a dynamic labor market, it does not really make sense to think of the unemployed and the employed as different people. If we instead think about unskilled labor as a whole—a group that includes both those with jobs and those unable to find jobs—what can we conclude about the effects of an increase in the minimum wage? There are a few different ways of looking at this question.
The Wage Bill
First, we can look at total wages paid in the labor market, sometime called the wage bill. By looking at the wage bill, we can find out if the additional wages earned by the working poor exceed the wages lost by those who find themselves unemployed.
Total wages are equal to the total hours worked multiplied by the hourly wage:
total wages = real minimum wage × hours worked.Because we are measuring the wage in real terms, total wages are likewise measured in real terms. Figure 11.13 "The Wage Bill" provides a graphical interpretation of the wage bill: total wages paid are given by the shaded rectangle.
Figure 11.13 The Wage Bill
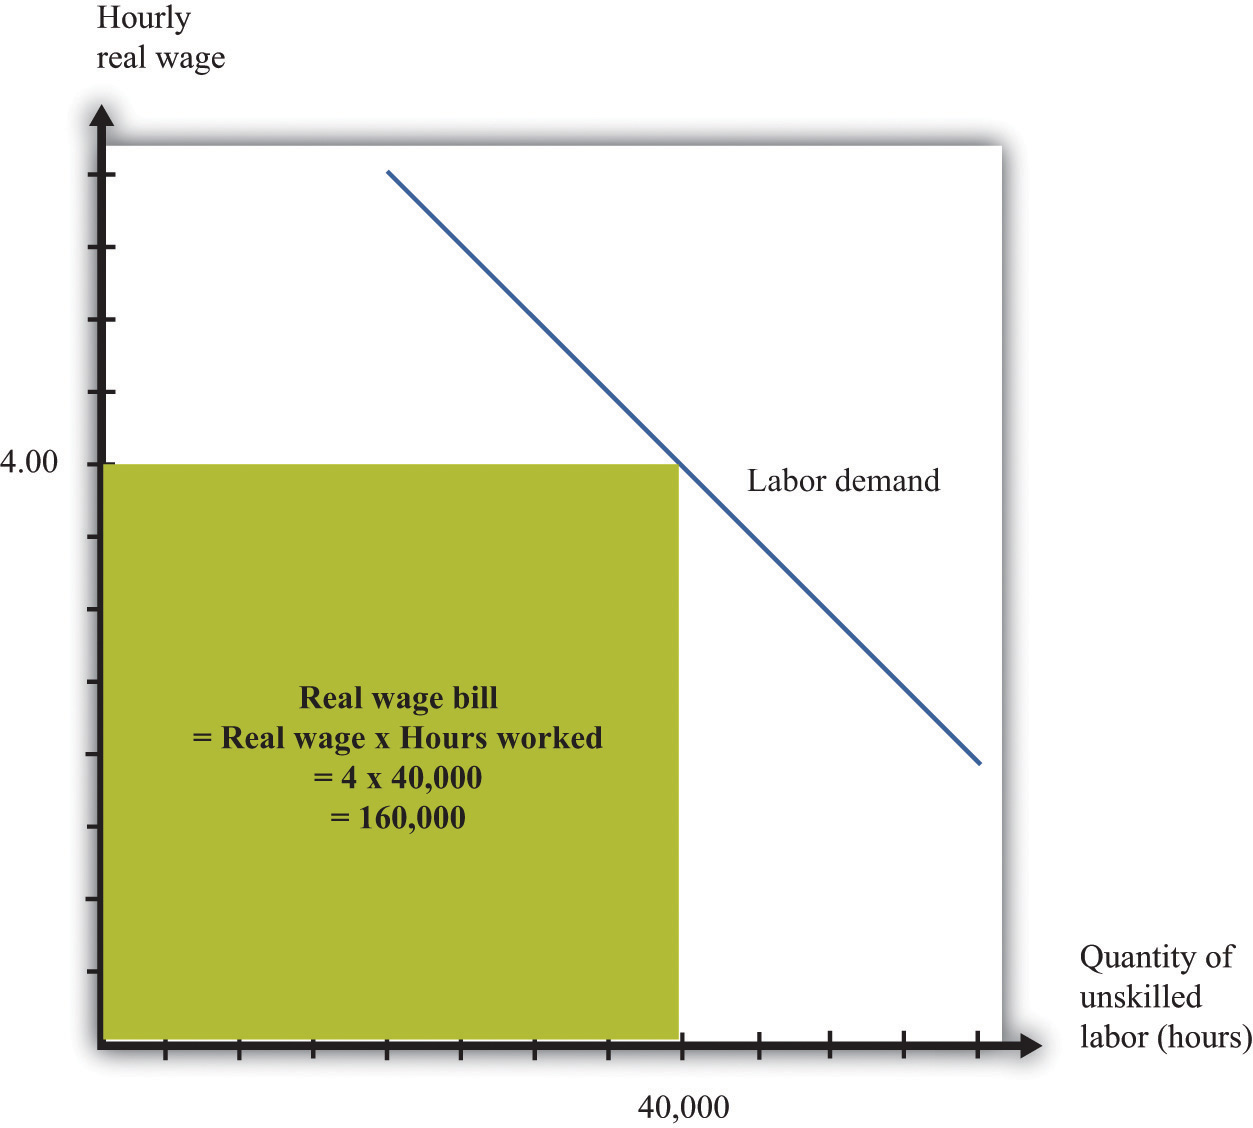
The wage bill is equal to the rectangle under the demand curve. For example, if the real wage is $4 per hour and employment is 40,000 hours, then the wage bill is 160,000.
From this equation it can be shown thatTo derive this equation, we first apply the rules of growth rates to obtainpercentage change in total wages = percentage change in real minimum wage + percentage change in hours worked.Then divide both terms by the percentage change in the minimum wage and use the definition of the elasticity of demand:
percentage change in total wages = percent change in real minimum wage × (1 – [–(elasticity of demand)]).The elasticity of demand is a negative number: if wages increase (that is, the change in the wage is positive), then hours worked decreases (that is, the change in hours worked is negative). It is therefore easier if we use –(elasticity of demand) because this is a positive number. The equation tells us that the change in the total wage is positive if the percentage increase in wages is greater than the percentage decrease in hours worked—in other words, if –(elasticity of demand) is less than 1.
If the demand for labor is relatively sensitive to changes in the wage, employment will decrease significantly following an increase in the minimum wage. Total wages paid will decrease. This is shown in part (a) of Figure 11.14 "Effects of an Increase in the Minimum Wage on the Wage Bill". Before the increase, total wages are given by the sum of areas A and B. After the increase, total wages are given by the sum of areas A and C. We get the opposite conclusion if labor demand is inelastic. In this case, an increase in the wage increases the total wages paid. The conclusion is intuitive: if employers do not change their hiring very much when wages increase, then total wages will increase. But if an increase in the minimum wage leads to a big decrease in the demand for labor, total wages paid will decrease.
Figure 11.14 Effects of an Increase in the Minimum Wage on the Wage Bill
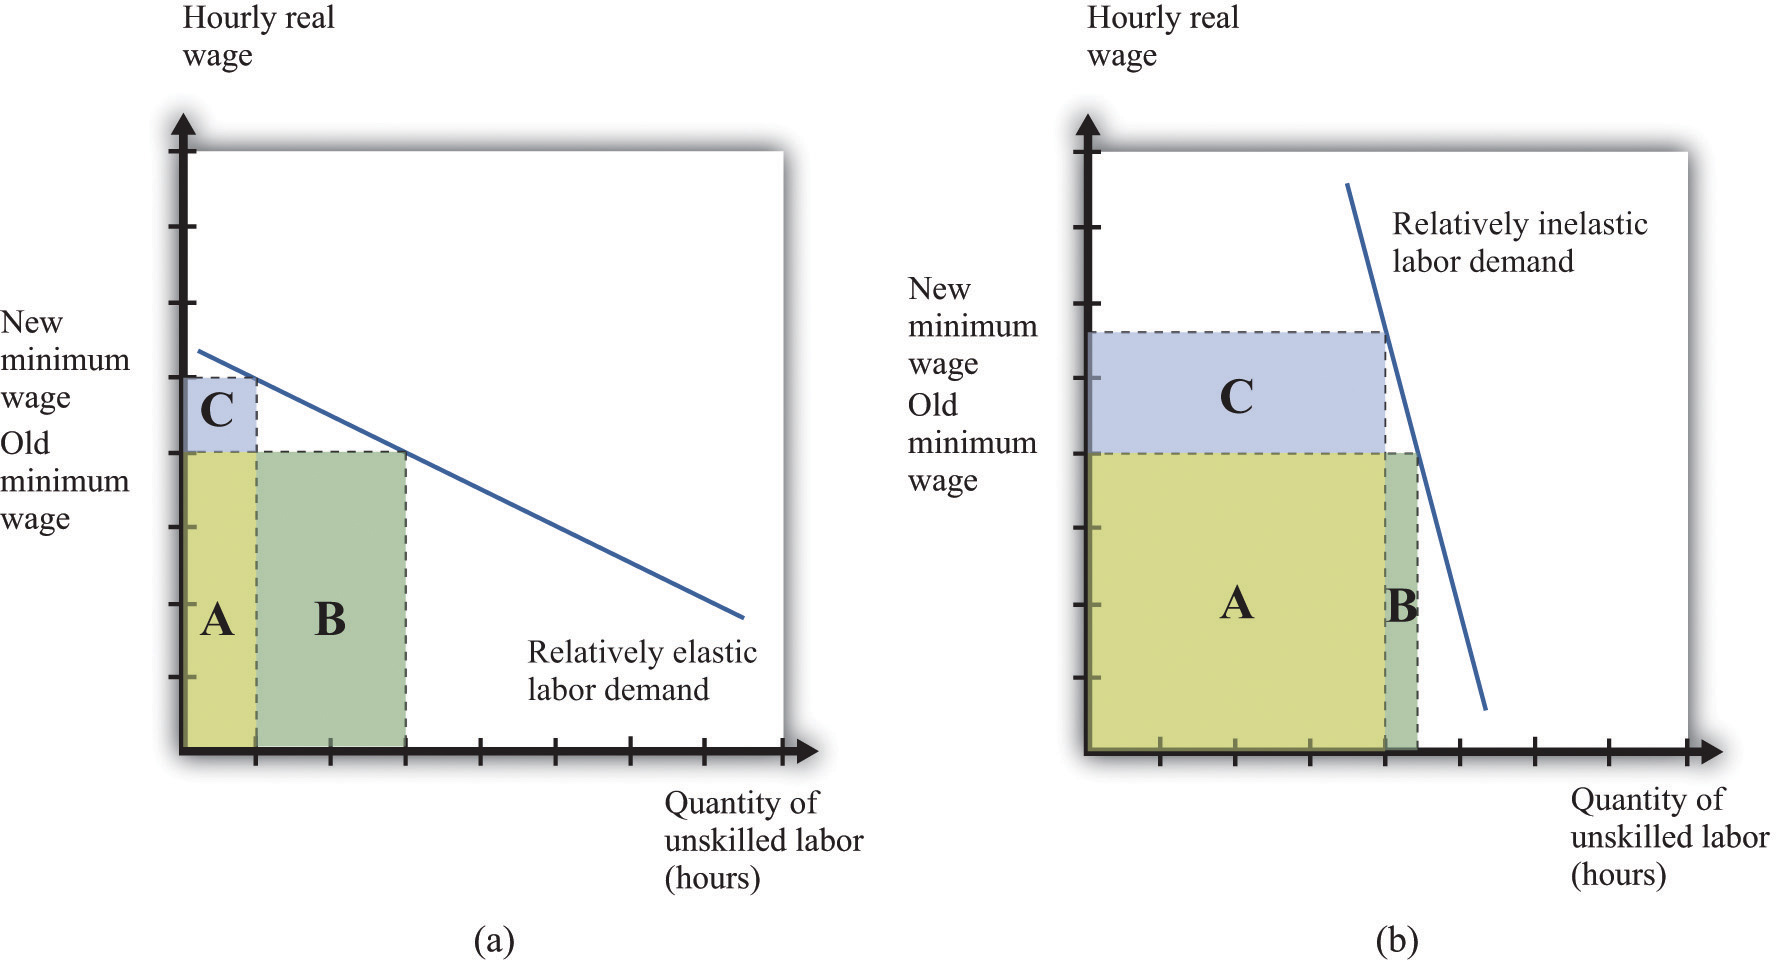
If labor demand is relatively elastic (a), a change in the minimum wage leads to a reduction in the wage bill: the original wage bill is A + B, and the new wage bill is A + C. If labor demand is relatively inelastic (b), the same change in the minimum wage leads to an increase in the wage bill.
Seller Surplus
The wage bill tells us how much workers are paid in total. A better measure of the benefits obtained by workers is the total sellersellers’ surplus#8217;s surplus in the market. We cannot measure this exactly unless we know exactly what the labor supply curve looks like, but we can conclude that just looking at the wage bill understates the benefits to workers of the increased wage. The reason is simple and does not even need any diagrams. Following an increase in the minimum wage, workers work fewer hours in total. Everything else being the same, people prefer leisure time to working. For example, suppose that total wages increase following an increase in the minimum wage. Then workers gain twice: they are being paid more, and they are working less.
Even if total wages decrease, workers might still be better off. They might be more than compensated for the lower wages by the fact that they don’t have to work as many hours. We are not saying that having a job is a bad thing; those who are working prefer having a job to being unemployed. But those who are working also prefer working fewer hours.
Expected Wage
So far, we have looked at the minimum wage through the lens of a competitive labor market. This is not a bad approach: as we have argued, the unskilled labor market is probably a reasonably good example of a competitive market. It is, however, a static way of thinking about the labor market, when the labor market is in fact highly dynamic.Chapter 9 "Growing Jobs" contains more discussion. People move in and out of jobs: they quit or are laid off from old jobs, and they search for new jobs. A worker who is employed this month may find herself unemployed next month; a worker with no job this month may be hired next month.
Earlier we claimed that an increase in the minimum wage has no direct effect on the unemployed. This is true in the static labor market picture, but once we take a more dynamic view of the labor market, it no longer makes very much sense to draw a hard-and-fast distinction between the employed and the unemployed. Over time, they will include many of the same people. So when we look at the distributional effects of the minimum wage, it is better to draw the distinction between unskilled workers (that is, the employed and unemployed together) and the relatively rich. With this in mind, let us now consider whether the unskilled as a group are likely to benefit from the minimum wage.
We might expect that unskilled workers will spend some of their time employed and some unemployed. When employed, they earn the minimum wage, but when unemployed, they receive much less. To keep things simple, suppose these workers earn nothing when unemployed. On average, the fraction of time that workers spend employed rather than unemployed is given by
We can think of this as the probability that a typical unskilled worker will be employed at any given time. Combining this with the idea of expected value, we can calculate the expected wage of such a worker. If a worker earns nothing when unemployed, then the expected wage is as follows:
Toolkit: Section 31.7 "Expected Value"
You can review probability and expected values in the toolkit.
How does this expected wage change when there is an increase in the minimum wage? The answer, as you might expect by now, depends on the elasticities of demand and supply. Specifically, it turns out that the expected wage will increase if
–(elasticity of labor demand) + elasticity of labor supply < 1.If both demand and supply are sufficiently inelastic, the average wage will increase. Conversely, if they are both relatively elastic, then expected wages will decrease.
There are some things missing from this story. In a more careful analysis, we would take into account the fact that workers are probably risk-averseBeing willing to pay more than a gamble’s expected loss in order to avoid that gamble. and dislike the randomness of their earnings. We would likewise take into account that unemployed workers obtain some income—perhaps from unemployment insurance. This actually makes it more likely that an increase in the minimum wage will increase the expected wage. These are details, however. We can draw two big conclusions from our discussion so far:
- Under some circumstances at least, an increase in the minimum wage will have the effect of redistributing income from the relatively rich to unskilled workers. Policymakers may wish to reduce inequality in society, and the minimum wage is one possible tool that they can use. At the same time, the minimum wage comes at a cost to society: it distorts decisions in the labor market and leads to deadweight loss. This is an equity-efficiency trade-offTrade-off that arises when policies that deliver a more equitable distribution of resources also generate deadweight loss..
- The distributional impact of a change in the minimum wage cannot be deduced from economic theory. It depends on the elasticities of labor demand and supply in the market for unskilled labor and is an empirical question. In the next section, therefore, we turn to the evidence on minimum wages.
Key Takeaways
- The minimum wage affects buyers and sellers of labor services in the markets where the minimum wage is binding. It also affects the owners of these firms.
- Buyers and sellers of labor services in low wage (unskilled) labor markets are directly affected by changes in the real wage. Workers in this market who keep their jobs are better off. Those that lose their jobs are made worse off, at least in the short run. Owners of the firms are hurt because of reduced profits from the minimum wage. The magnitude of these effects depends on the elasticities of labor demand and supply.
- The equity-efficiency trade-off means that policies that increase equity can create inefficiencies. The minimum wage provides an example of that trade-off.
Checking Your Understanding
- Why does an increase in the minimum wage reduce the profits of a firm?
- If the real minimum wage is reduced by inflation, can the real wage bill paid to workers increase?
11.5 Empirical Evidence on Minimum Wages
Learning Objectives
- How do economists determine the elasticities of labor supply and labor demand?
- What are the estimates of these elasticities?
- What are the estimated effects of an increase in the minimum wage?
For the most part, economists cannot carry out experiments to test their theories and must use much more indirect methods. They must rely on observations that are generated by the everyday experience of individuals in an economy. In a textbook like this, we constantly draw demand and supply curves, and we get so used to seeing these diagrams that we might be fooled into thinking that we can just go out and observe them in the real world. In fact, all we observe are the market outcomes—the equilibrium price and quantity that are traded. Our conception of the labor market might look like part (a) of Figure 11.15 "Models and Data", but the data that we actually gather look like part (b) of Figure 11.15 "Models and Data".
Figure 11.15 Models and Data
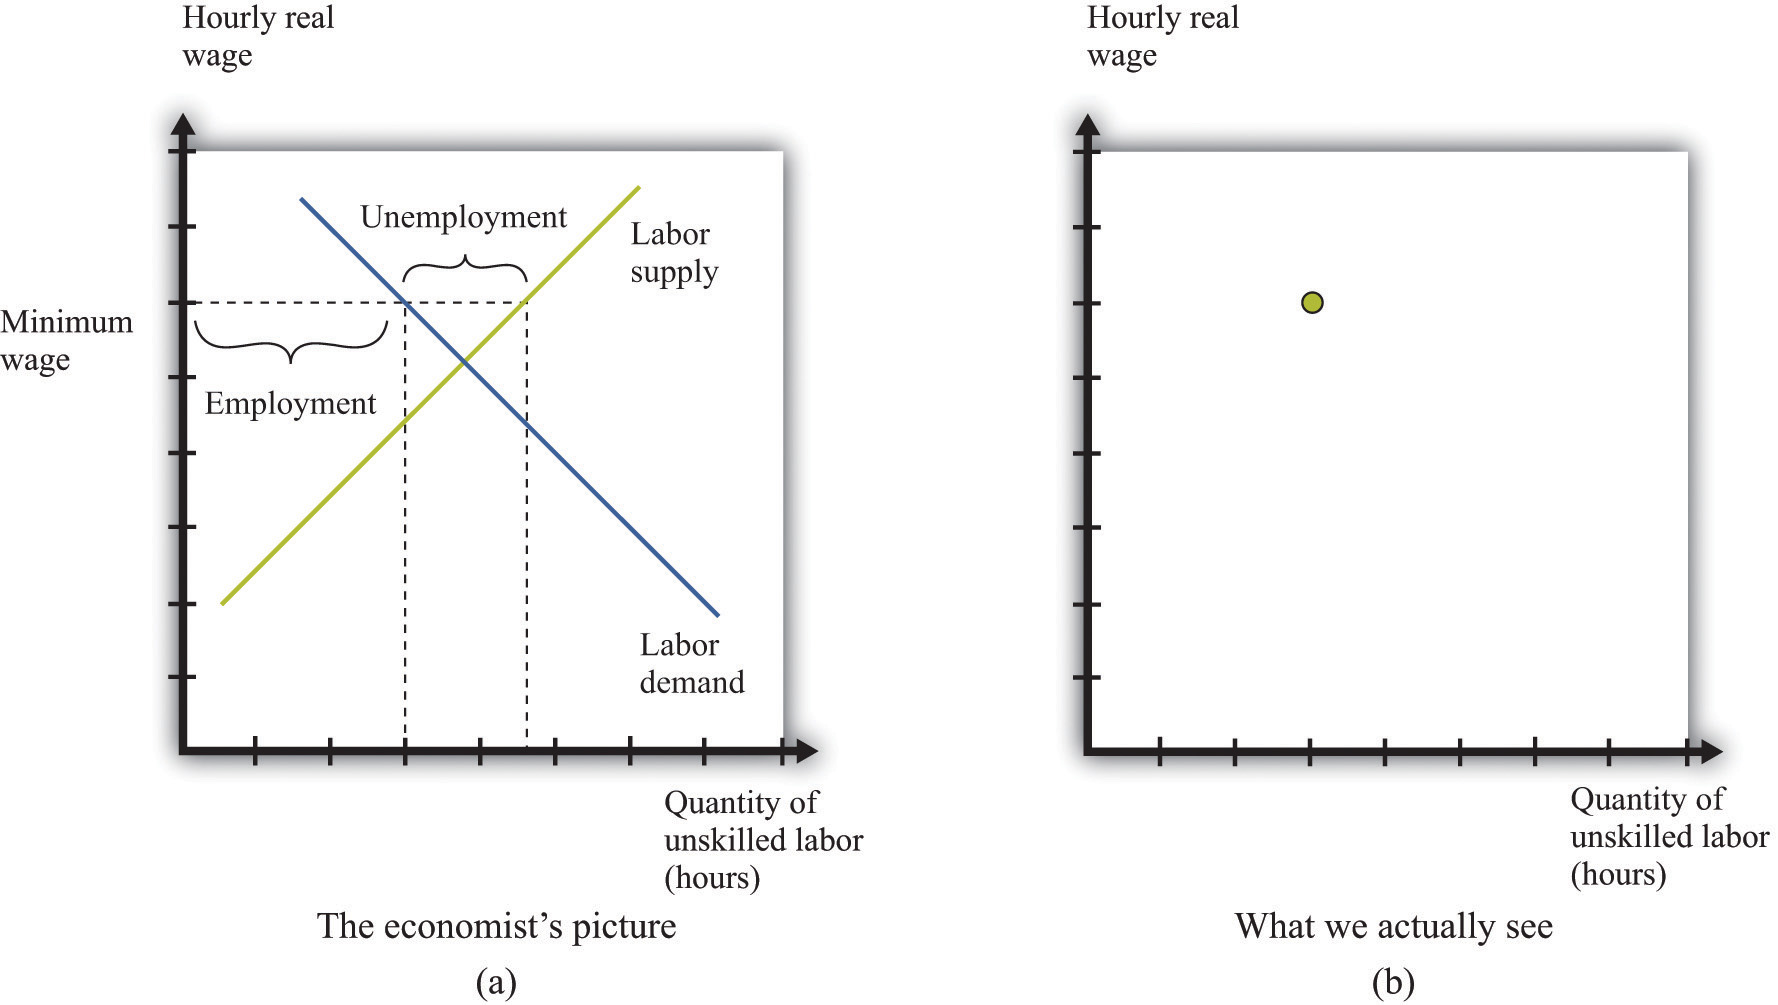
We construct an entire framework based on the supply and demand curves for labor (a), but at any time we observe only a single data point: the wage and the level of employment (b).
If we want to estimate a demand curve, we need much more than part (b) of Figure 11.15 "Models and Data". We need more data points. We need different observations. In the case of the labor market, we might be able to use the fact that the minimum wage changes over time. Figure 11.16 "Inferring Labor Demand from Data" shows an example. Minimum wage changes allow us to observe different points on the labor demand curve. Given enough observations, we might be able to get a good idea of what the demand curve looks like and come up with an estimate of labor elasticity.
Figure 11.16 Inferring Labor Demand from Data
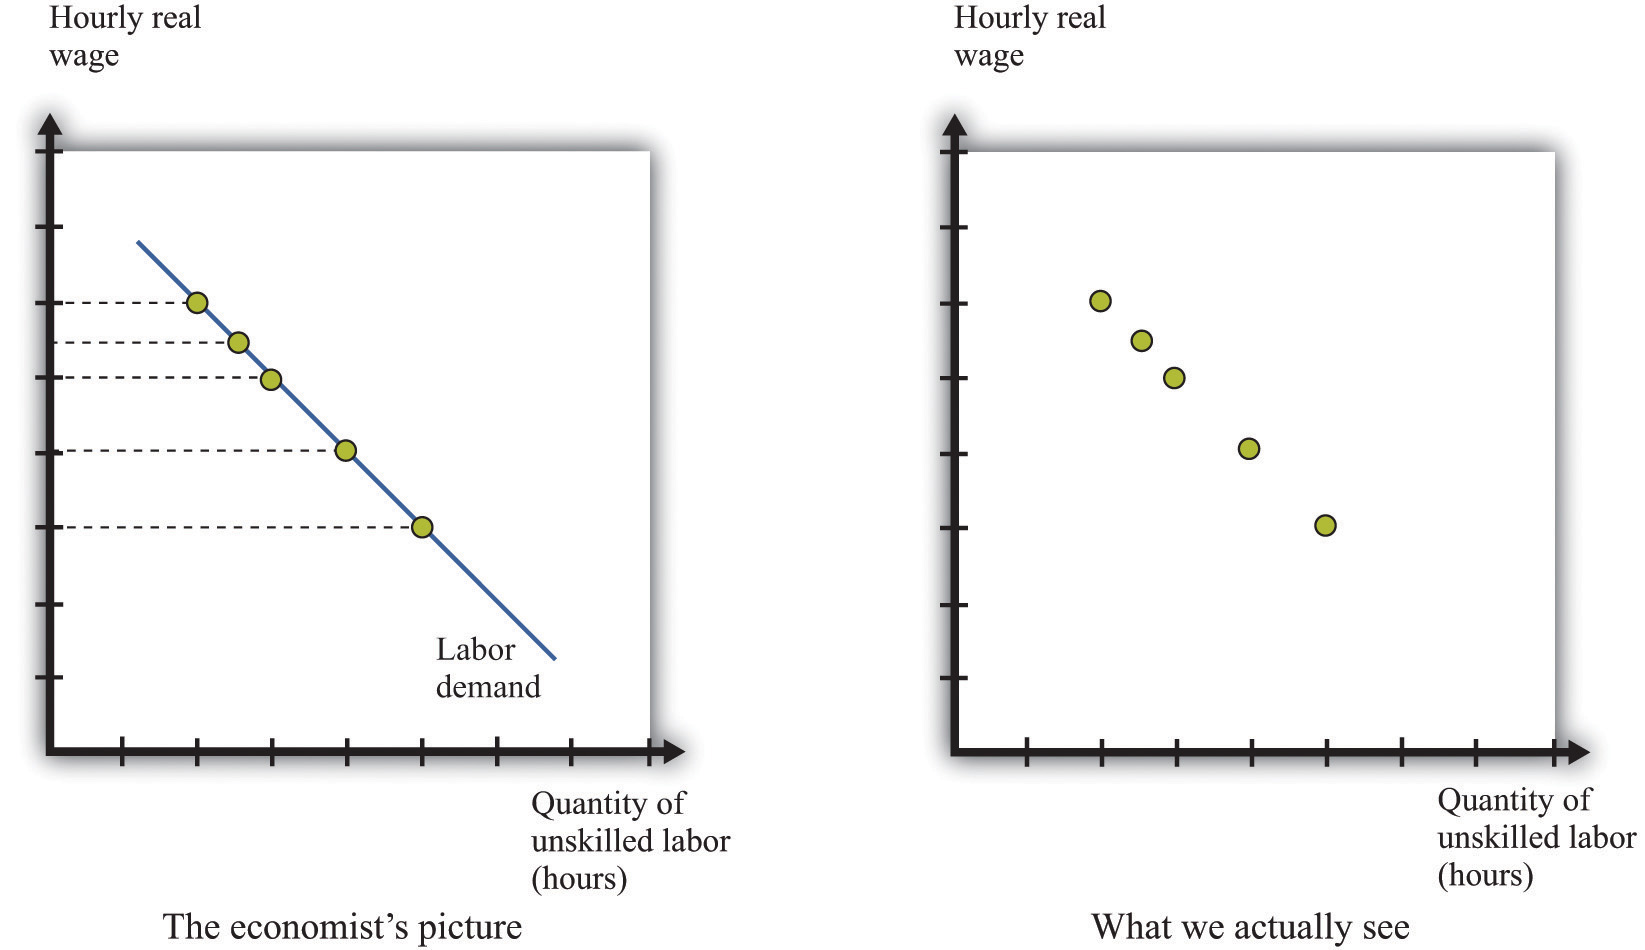
We may be able to infer a demand curve for labor by looking at what happens to the quantity of hours worked as the minimum wage changes.
Reality is messier. In actual labor markets, many things are going on at once. At the same time that the wage is changing, firms might be facing changes in the demand for their products, changes in the costs of other inputs, changes in their technology, or changes in their competitive environment. All of these changes would cause the labor demand curve to shift. As an example, look at Figure 11.17 "Difficulties Inferring Labor Demand from Data". The story here is as follows: The minimum wage is increasing over time, but—perhaps because of increased product demand—the demand for labor is also increasing over time. What we observe is shown in Figure 11.17 "Difficulties Inferring Labor Demand from Data". The unwary analyst, looking at these data, might conclude that minimum wages have little or no effect on the demand for labor.
Figure 11.17 Difficulties Inferring Labor Demand from Data

When the demand curve for labor is shifting at the same time as the minimum wage is changing, it is more difficult to see the effects of the minimum wage.
Economists who analyze data are forever trying to distinguish effects of interest (for example, minimum wage changes) from those caused by changes in other variables (for example, product demand). The key to successful empirical work is obtaining informative sources of variation and excluding irrelevant sources of variation. In the case of the minimum wage, we might look at differences in the minimum wage at different times, or we might look at differences in the minimum wage in different places (such as specific states in the United States).
Estimates of Labor Demand Elasticity
Labor economist Daniel Hamermesh summarizes the findings from numerous studies in his book, Labor Demand.Daniel S. Hamermesh, Labor Demand (Princeton, NJ: Princeton University Press, 1996). Based on his review of all these studies, Hamermesh argues that a good estimate of −(elasticity of labor demand) is about 0.3. This means that if we increase the minimum wage by 10 percent, employment will decrease by about 3 percent. With these, we would conclude that labor demand is relatively inelastic, and the employment and welfare implications of the minimum wage are not that large. Labor supply also tends to be relatively inelastic, partly because the income effectsWhen a good decreases in price, the buyer can afford more of everything, including that good. and substitution effectsIf one good becomes cheaper relative to other goods, this leads the buyer to purchase less of other goods and more of that particular good. of changes in the wage tend to be offsetting. It certainly seems possible, then, that an increase in the minimum wage will raise expected wages.
We must be careful, though. Hamermesh notes that labor demand becomes more elastic as the skill level of workers decreases. It is difficult to find substitutes for workers with specialized skills. If you need an electrician, then you must hire an electrician, even if plumbers are much cheaper. If you need an airline pilot, you can’t hire a computer programmer. If you are running a store, however, and you find that labor is becoming more expensive, you might be able to upgrade your cash registers and inventory control systems and get by with fewer employees. We might expect the elasticity of demand at the minimum wage to be significantly higher.
It is therefore useful to look at studies that focus directly on minimum wage changes. One approach is to look at the relationship over time between the minimum wage and the employment experience of groups that are most directly affected by the minimum wage. Alternatively, one can look across groups that are differentially affected by the minimum wage to gauge its effect.
A reminder before we proceed. The point of going through this material is not only to help you understand the effects of a change in the minimum wage but also to provide you with a glimpse of how economic research proceeds so that you can do a better job of evaluating evidence that economists compile in all sorts of areas.
Economists have focused particular attention on teenage workers because that group is typically unskilled and is likely to be subject to the minimum wage. (This is not to say that the effects of the minimum wage are primarily on teenagers. Indeed, about two-thirds of minimum wage earners are adults.) Figure 11.18 "Teenage Unemployment in the United States" graphs the teenage unemployment rate over the period from 1956 to 2007 along with the real minimum wage for this period. We would like to know if the minimum wage has an impact on the teenage unemployment rate. This figure is suggestive of a relationship, particularly in the last couple of decades. For example, the real minimum wage fell during the 1980s, and the teenage unemployment rate also fell during that time. The teenage unemployment rate also often seems to increase around the time that the minimum wage increases. On the other hand, teenage unemployment also fell substantially during the 1960s at a time when there were several increases in the minimum wage.
Figure 11.18 Teenage Unemployment in the United States
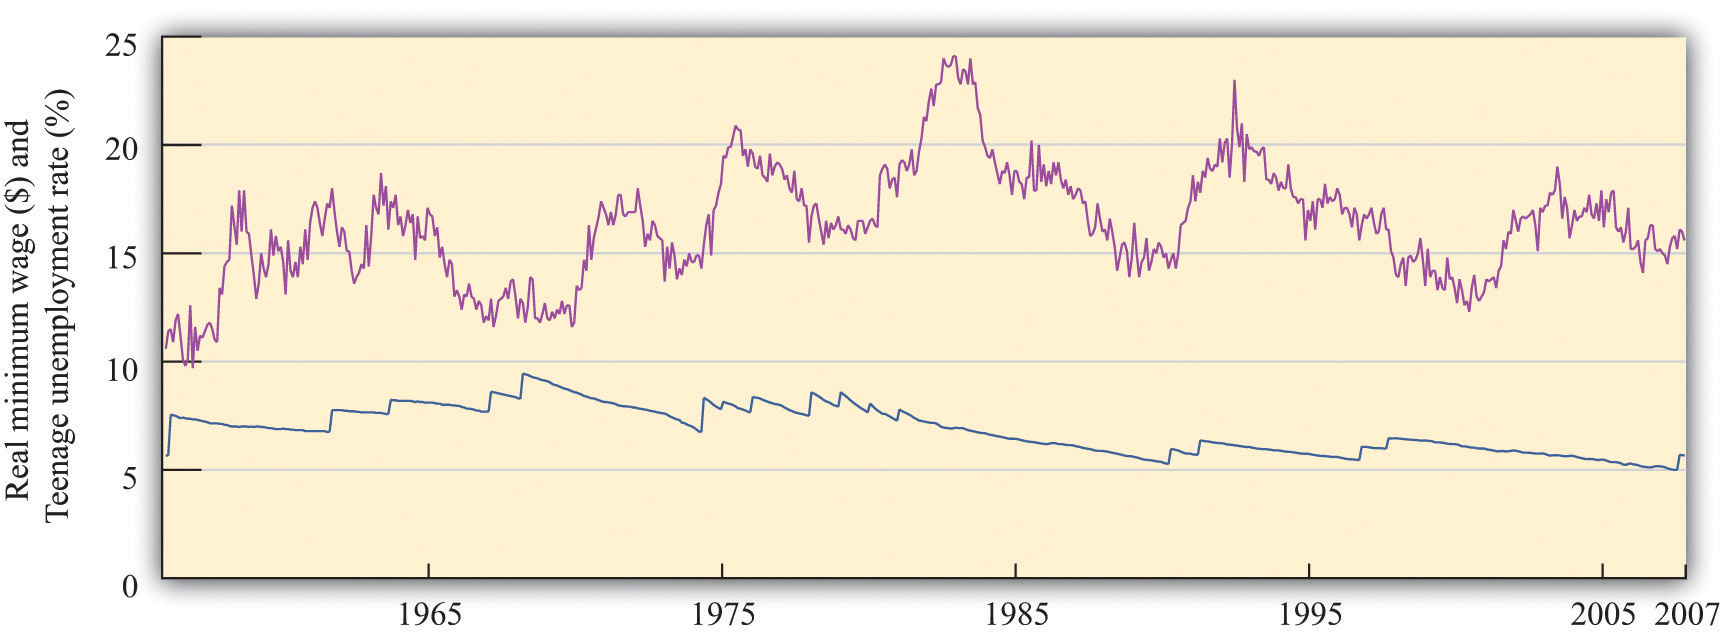
The figure shows the federal minimum wage in the United States, adjusted for inflation, together with the teenage unemployment rate.
Source: US Department of Labor and Bureau of Labor Statistics.
If the only cause of changes in teenage employment were minimum wage changes, Figure 11.18 "Teenage Unemployment in the United States" might give us lots of answers. But this is a very big “if.” In terms of our analysis of supply and demand, it would amount to saying that the supply and demand for labor didn’t change over the entire period. In fact, you can make an enormously long list of things that might have shifted the supply curve, the demand curve, or both. Examples include whether the economy was in a boom or a recession, changes in tax rates, technological advances, and population growth. As we saw in Figure 11.17 "Difficulties Inferring Labor Demand from Data", it is difficult to disentangle the effects of a changing minimum wage from the effects of other changes. Thus we cannot isolate the effects of the minimum wage just by looking at diagrams like Figure 11.18 "Teenage Unemployment in the United States".
We need some way to take into account these other factors so that we can focus on the effects of the minimum wage. This is a complicated statistical problem that arises time and again in economics, and the ways of dealing with it go far beyond this textbook. Indeed, this problem is one of the hardest things about studying economic data. But even though the statistical details are complex, there are three simple ideas that are important to understand:
- The basic idea of these statistical techniques is that economists attempt to include in their analysis—as best they can—all the factors that shift the demand and supply curves. Then they can predict what would have happened if there had been no change in the minimum wage. Once they have done this, they can then determine the effect of minimum wage changes.
- When different economists study the same problem, they do not always reach the same conclusion. The reason that they disagree is usually not because they have different ideas about economic theory. Almost all economists have the same general framework for understanding labor markets, for example. Economists disagree because they use different approaches to take into account all the other factors.
- If economists could conduct direct experiments, such as those performed in the physical sciences, they would not have this problem. They would be able to completely control the stimulus (minimum wage changes), and thus get an accurate estimate of the response (changes in employment). Instead, the best we can do is to look at past minimum wage changes and try to determine what happened.
Studies from the 1970s and early 1980s found some evidence that increases in the minimum wage reduced the employment of 16- to 19-year-olds. According to economists David Card and Alan Krueger, the average estimate is that a 10 percent increase in the minimum wage would reduce employment by about 1.5 percent.David Card and Alan Krueger, Myth and Measurement: The New Economics of the Minimum Wage (Princeton, NJ: Princeton University Press, 1995). So the implied value of −(elasticity of labor demand) is about 0.15. With an average employment rate of about 50 percent, this means that a 10 percent increase in the minimum wage would reduce the rate of teenage employment by about 0.75 percentage points.
It is striking that this estimate is lower than the estimate from looking at labor demand as a whole. What is more, Card and Krueger note that more recent studies produce even smaller estimates of these effects.David Card and Alan Krueger, Myth and Measurement: The New Economics of the Minimum Wage (Princeton, NJ: Princeton University Press, 1995), Table 7.2 "Calculating Revenues". In their own work, they find that the apparent negative effects of the minimum wage on employment are statistically insignificant. This result holds not only for all 16- to 19-year-olds but also when the sample is split by race and sex.
The evidence from teenage employment studies suggests that, as an empirical matter, the effects of the minimum wage on employment may be very small. This result has surprised many economists. Although economic theory did not suggest actual magnitudes for the labor demand elasticity, the existence of substitutes for unskilled labor did suggest that labor demand would be at least somewhat elastic.
Not surprisingly, there have been many other studies of the minimum wage. Some researchers have found larger employment elasticities for teenage employment than those reported by Card and Krueger. Sometimes we are simply unable to give a definitive answer to empirical questions in economics. This can be frustrating for both students of economics and practitioners—but we are not going to pretend that the world is simpler than it actually is.
Cross-Section Studies
The studies we have just discussed analyzed the minimum wage by looking at minimum wage changes over time. Another approach to analyzing the effects of the minimum wage is to take advantage of differences over individuals rather than variations over time. Economists call these cross-section studies because they look at a cross section of different individuals or firms at a point in time. Many of these studies look at the effects of minimum wage changes at the level of an individual worker. Others exploit differences in minimum wage laws across states. Such differences across states give rise to a natural experimentAn exogenous change that can be associated with a shift in either the demand curve only or the supply curve only. because they can substitute, at least in part, for economists’ inability to conduct experiments in which only one thing changes at a time.
Here is an example. Recall that in 1938 a minimum wage of $0.25 per hour was put into effect under the Fair Labor Standards Act. In the United States, this minimum wage was about 40 percent of the average manufacturing wage. However, the law also applied to Puerto Rico, which was much poorer, where this minimum wage was about twice the average factory rates. In a book published more than 25 years ago, researchers John Petersen and Charles Stewart noted that the increase in the minimum wage led to numerous factory closings, and there was a dramatic decrease in output and employment.John M. Peterson, and Charles T. Stewart Jr., Employment Effects of Minimum Wage Rates (Washington: American Enterprise Institute, 1969). In the case of Puerto Rico, the introduction of the minimum wage apparently had a large adverse effect on employment.
Peterson and Stewart also provide an extensive account of early studies of minimum wages that looked at employment and wages at individual production sites. These studies compared employment before and after a change in the minimum wage in an attempt to infer the effects of the policy. A study of the seamless hosiery industry from 1938 to 1941 is of particular interest. This period saw the introduction of the $0.25 per hour minimum wage, followed by an increase to $0.325 per hour in September 1939. A researcher named A. F. Hinrichs looked at 76 different plants and divided them into two groups: those that paid high wages and those that paid low wages. We would expect the minimum wage to have a much bigger effect at the low-wage plants. Between September 1938 and September 1939, the low-wage plants had employment losses of 12 percent. Employment at high-wage plants actually expanded by 23 percent, perhaps in part because workers who lost jobs in the low-wage plants became part of the labor supply for the previously higher-wage plants. A similar pattern was noted for the period from 1938 to 1940.
A much more recent study by Card and Krueger is another example of this approach. They studied employment patterns in fast-food restaurants in New Jersey and Pennsylvania. The key to their research was that, during the period of study, the minimum wage was increased in New Jersey but not in Pennsylvania. (Remember that individual states sometimes set minimum wages above the federal minimum.) From this natural experiment, Card and Krueger found that the increased minimum wage in New Jersey actually seemed to have increased employment.
The evidence from other countries (both cross-section studies and studies over time) is likewise mixed.A recent Organisation for Economic Co-operation and Development report has a summary of minimum wage studies from different countries: “Making the Most of the Minimum: Statutory Minimum Wages, Employment and Poverty,” accessed March 14, 2011, http://www.oecd.org/dataoecd/8/57/2080222.pdf. One study of Greek labor markets, for example, found a negative effect for men but a positive effect for women. Another study found negative effects for Mexico but not for Colombia. Different researchers in France have come to different conclusions about the effects of the minimum wage there; researchers in New Zealand likewise disagree; and so on.
Beyond Employment Effects
We started with what seemed to be some simple questions about the minimum wage. The answers turned out to be quite complex. Empirical research does not deliver a definitive answer about whether minimum wages have a big effect on employment. This leads to some disagreement among economists, particularly because the minimum wage is a politically charged issue. From the perspective of policymaking, the lack of a consensus creates difficulty in formulating good policy. On the other hand, the lack of a consensus provides a stimulus for continued work on these important issues.
Though we have emphasized the employment effects of minimum wage changes, there are other effects of minimum wages as well. First, remember that the main argument in favor of minimum wages is that they are a vehicle for redistributing income toward the working poor. Card and Krueger present a detailed analysis of the types of individuals most likely to be directly affected by minimum wage changes. Although empirical work often focuses on the employment of teenage workers, young workers are not the only group in the labor market that is paid close to the minimum wage. About 50 percent of the workers affected by the April 1990 increase in the minimum wage were older than 24 years old, for example.
How much income then flows to these workers as a consequence of an increase in the minimum wage? Card and Krueger conclude that the increase in the minimum wage during 1990 and 1991 had only a tiny effect on the distribution of income. They calculate that the minimum wage increase from $3.35 to $4.25 transferred about $5.5 billion of income to low-wage earners. This amounts to about 0.2 percent of family earnings. The host of transfer programs in place in the United States swamps the effects of the minimum wage on the redistribution of income. The evidence from other studies and countries is broadly in line with this conclusion: several studies find some effects of minimum wages on income distribution, but these effects are typically small.
Second, we can think about the effect of the minimum wage on firms. An increase in the minimum wage increases firms’ marginal costThe extra cost of producing an additional unit of output, which is equal to the change in cost divided by the change in quantity. of production. As a consequence, firms will increase their prices and sell less output. Because of this, increases in the minimum wage reduce profits, so we might expect to see this reflected in the share prices of firms that employ minimum wage workers. Relative to the large empirical literature on employment effects, the implications for employers have been largely neglected. Card and Krueger survey the evidence and find relatively small effects on the stock market value of firms.
Key Takeaways
- Economists use data from labor market outcomes (wages and employment) to infer the shapes of labor supply and demand curves. A key part of this inference is to isolate economic variation to trace out one of the curves.
- Based on many studies, −(elasticity of labor demand) is about 0.3. So if we increase the minimum wage by 10 percent, employment will decrease by 3 percent.
- Studies that look directly at the effects of minimum wage changes find minimal effects of minimum wage changes on employment and unemployment.
Checking Your Understanding
- Why is it so difficult to determine the effects of minimum wage changes on unemployment?
- What is a natural experiment?
- Why do changes in the real minimum wage allow researchers to trace out the labor demand curve?
11.6 End-of-Chapter Material
In Conclusion
The minimum wage is a public policy that is debated the world over. It has widespread public support because there is something very appealing about the notion that those who work hard will be rewarded with a reasonable standard of living. Economists, living up to their reputation as dismal scientists, point out that this is all very well, but there may be unintended consequences of such a policy:
- A minimum wage leads to a reduction in employment and to unemployment.
- A minimum wage leads to fewer trades than in a competitive market and therefore to inefficiency.
The theory of the minimum wage is straightforward and convinces most economists that, even if the minimum wage has some benefits in terms of the distribution of income, it carries costs with it as well. There is less consensus among economists about whether the redistribution brought about by the minimum wage is desirable. Although the working poor benefit, others are made worse off—including those who are unemployed, who are perhaps even more in need of help than the working poor. Individuals differ in their beliefs about how society’s resources should be distributed, and there is no right answer to the question “what is fair?”
When we looked at the evidence on minimum wages, however, we found that the picture is much less clear. Although some studies are in line with the predictions of theory, many studies suggest that, in practice, the effect of the minimum wage on employment is minimal. At the same time, the effect of the minimum wage on the distribution of income is small as well. In the end, it is difficult to resist concluding that the minimum wage is much less important—in terms of both benefits and costs—than one would think from the rhetoric of the debate.
When you read the newspapers or watch television, you will frequently hear economists offer different viewpoints on economic policies. These disagreements are typically not because economists differ on the theory. The disagreements often come down to different opinions about how to analyze and interpret economic data. Remember as well that television and print journalists go out of their way to find differing points of view because that makes a better story, so the disagreement you see in the media is usually not representative of economists as a whole. That said, economists also have different political viewpoints, and they are sometimes guilty of letting their political preferences cloud their economic analysis.
Having gone through the arguments in this chapter, you should be better able to assess debates and discussion on the minimum wage the next time it comes to the forefront of public debate. This chapter has a much broader purpose, however. We have been studying the effect of government intervention in a market, and we have shown how we can use our tools of supply and demand to understand the likely effects of that intervention. There are many other examples of government interventions that can be investigated using very similar reasoning.
Finally, we have learned something about how empirical work is conducted in economics. Because economists cannot conduct experiments, they are forced to trawl through messy data in an attempt to test their theories. It is difficult to be sure that the variables in which we are interested are indeed changing enough to be useful, and it is even more difficult to disentangle those changes from all the other irrelevant changes that affect the data that we observe.
Key Links
- Bureau of Labor Statistics: http://www.bls.gov
- Department of Labor: http://www.dol.gov
- US minimum wage laws: http://www.dol.gov/esa/minwage/america.htm
Exercises
- List three jobs you think probably pay minimum wage and three jobs that you think do not.
- Illustrate an increase in the minimum wage when both demand and supply are (a) relatively inelastic and (b) relatively elastic. Explain why the change in unemployment is smaller when the curves are inelastic.
- Explain why the deadweight loss from the minimum wage is larger if labor demand is relatively elastic.
- How does the elasticity of labor supply affect the deadweight loss from the minimum wage? Specifically, if labor supply is more elastic, is the deadweight loss smaller or larger? What is the economic intuition behind your answer?
- (Advanced) Draw a version of Figure 11.9 "Deadweight Loss from Minimum Wage" for the case where a single individual controls access to scarce jobs. Suppose that she is able to charge job searchers a fee (the same fee for all searchers) equal to the difference between the minimum wage and the wage that workers would be willing to accept. What area of the figure does she obtain?
- In our discussion of the evidence of the effects of minimum wage changes, we said, “If economists could conduct direct experiments, such as those performed in the physical sciences, they would not have this problem.” Exactly what problem were we referring to?
- What is the difference between cross-sectional and time-series studies? Does one hold “more things fixed” than the other?
- Suppose the government imposed a maximum wage in the market for some high-paying job. Draw a diagram to illustrate this market. What would be the consequences of this maximum wage?
- Explain why, when we analyze the minimum wage, the elasticity of labor supply affects the unemployment rate but not the employment rate.
- Why does the government not set a minimum wage for corporate lawyers and airline pilots?
- If the rate of inflation is 10 percent higher than expected, and –(elasticity of labor demand) is 5, what will happen to the employment level in jobs that pay the minimum wage?
- What happens to the rate of unemployment of minimum wage workers if the rate of inflation is lower than expected?
- Does the elasticity of labor supply have an effect on the change in the wage bill when there is an increase in the minimum wage? Does this elasticity have an effect on the unemployment rate when the minimum wage changes?
- (Advanced) Using the discussion of estimation of labor demand, if you could conduct an experiment to see the effects of a minimum wage increase, what exactly would you do?
- (Advanced) Using supply and demand curves in the market for fast food, what are the effects of an increase in the minimum wage in this market? Think about shifts in both the supply curve and the demand curve. Explain your predictions.
- Why isn’t an increase in the minimum wage just a redistribution from firms to workers?
- A politician is in favor of getting rid of the minimum wage entirely. How would you argue against that proposal?
Economics Detective
- Pick three countries and find the minimum wage in each country.
- Find a country that does not have a minimum wage. Do you think the lack of a minimum wage means that workers are badly treated in that country?
- Find some recent discussion of minimum wage legislation in either the United States or some other country. What arguments were made to support the minimum wage? What arguments were made against the minimum wage?
Spreadsheet Exercise
- (Advanced) Find data on the minimum wage and the price level for another country. Construct a real minimum wage series for that country.