This is “Financial Accounting Statements”, section 9.2 from the book Modern Management of Small Businesses (v. 1.0). For details on it (including licensing), click here.
For more information on the source of this book, or why it is available for free, please see the project's home page. You can browse or download additional books there. To download a .zip file containing this book to use offline, simply click here.


9.2 Financial Accounting Statements
Learning Objectives
- Understand what is measured on a balance sheet.
- Understand the term depreciation.
- Understand what goes on an income statement.
- Understand what is measured in a cash-flow statement.
- Appreciate the importance of forecasting when developing a cash-flow projection statement.
It sounds extraordinary, but it’s a fact that balance sheets can make fascinating reading.“Accounting Quotes,” Qfinance, accessed February 14, 2012, www.qfinance.com/finance-and-business-quotes/accounting.
Mary, Lady Archer of Weston
As discussed in Chapter 5 "The Business Plan", all business plans should contain sets of financial statements. However, even after the initial business plan is created, these financial statements provide critical information that will be required for the successful operation of the business. They not only are necessary for tax purposes but also provide critical insights for managing the firm and addressing issues such as the following:
- Are we profitable?
- Are we operating efficiently?
- Are we too heavily in debt or could we acquire more debt?
- Do we have enough cash to continue operations?
- What is this business worth?
There are three key financial statements: the balance sheet, the income statement, and the cash-flow statement. Every business owner or manager needs to be able to correctly interpret these statements if he or she expects to continue successful operations. It should be pointed out that all three financial statements follow general formats. The degree of detail or in some cases terminology may differ slightly from one business to another; as an example, some firms may wish to have an extensive list of operational expenses on their income statements, while others would group them under broad categories. Likewise, privately held businesses would not use the term shareholders’ equity but rather use owner’s equity in their balance sheet, and they would not list dividends. This aim of this chapter is to provide the reader with a broad overview of accounting concepts as they apply to managing small and mid-sized businesses.
The Balance Sheet Statement
One should think of the balance sheetA report that examines a business’s assets, liabilities, and owner’s equity at some particular point in time. statement as a photograph, taken at a particular point in time, which images the financial position of a firm. The balance sheet is dominated by what is known as the accounting equation. Put simply, the accounting equation separates what is owned from who owns it. Formally, the accounting equation states the following:
assets = liabilities + owner’s equity.AssetsEconomic resources that are expected to produce a benefit in the future. are “economic resources that are expected to produce a benefit in the future.”Walter Harrison, Charles Lungren, and Bill Thomas, Financial Accounting, 8th ed. (Boston, MA: Prentice Hall, 2010), 63.LiabilitiesThe amount of money owed to outside claims—people outside of a business. are the amount of money owed to outside claims (i.e., money owed to people outside the business). Owner’s equityThe claims on a business by those who own the business.—also known as stockholders’ equity—represents the claims on the business by those who own the business. As specified in the accounting equation, the dollar value of assets must equal the dollar value of the business’s liabilities plus the owner’s equity. Before proceeding with any numerical example, let us define some important terms.
Current assetsAssets that will be held for less than one year. are assets that will be held for less than one year. They include cashThe most liquid of all assets., marketable securitiesStocks and bonds that a business may hold in the hope that they will provide a greater return to the business rather than just letting cash “sit” in a bank account., accounts receivablesThe amount of money due to a business from prior credit sales., notes receivableA formal debt instrument that will be paid to the company within a year., prepaid expensesAn accrual accounting term that represents payments in advance of their actual occurrence., and inventoryTangible goods, categorized as raw materials, WIP, and finished goods, held by a business for the production of goods and services.. These are listed in a specific order. The order is based on the degree of liquidity of each asset. Liquidity measures the ease in which an asset can be converted into cash. Naturally, cash is the most liquid of all assets. All firms should have cash readily available. The exact amount of the desirable amount of cash to be held at hand will be determined by the sales level of the anticipated cash receipts and the cash needs of the business.
Marketable securities are stocks and bonds that a business may hold in the hope that they would provide a greater return to the business rather than just letting cash “sit” in a bank account. Most of these securities can be easily turned into cash—should the need arise.
Accounts receivables represent the amount of money due to a business from prior credit sales. Not all firms operate on a strictly cash sales basis. Many firms will offer customers the opportunity to purchase on a credit basis. As an example, a furniture store sells a bedroom set worth $6,000 to a newlywed couple. The couple puts down $2,500 to fix the sale and then signs a contract to pay the remaining $3,500 within the next year. That $3,500 would be listed as accounts receivable for the furniture firm.
Prepaid expense is an accrual accounting term that represents a payment that is made in advance of their actual occurrence. Insurance would be an example of a prepaid expense because a company is paying premiums to cover damages that might occur in the near future. If a year’s worth of rent were paid at one time, it too would be viewed as a prepaid expense.
Inventory is the tangible goods held by a business for the production of goods and services. Inventory can fall into three categories: raw materials, work-in-process (WIP), and finished goods. Raw materials inventory represents items or commodities purchased by a firm to create products and services. WIP inventory represents “partially completed goods, part or subassemblies that are no longer part of the raw materials inventory and not yet finished goods.”“Work in Process,” BusinessDictionary.com, accessed December 2, 2011, www.businessdictionary.com/definition/work-in-process.html. The valuation of WIP should include the cost of direct material, direct labor, and overhead put into the WIP inventory. Finished inventory represents products that are ready for sale. Generally accepted accounting principles (GAAP) require that a business value its inventory on either the cost price or the market price—whichever is lowest. This inherent conservative approach to valuation is due to the desire to prevent the overestimation of inventory during inflationary periods.
Total current assets are the summation of the aforementioned items and are defined as follows:
total current assets = cash + marketable securities + accounts receivable + prepaid expenses + inventory.The next set of items in the asset section of the balance sheet is long-term assets. Long-term assetsAssets that will not be turned into cash within the next year. are those assets that will not be turned into cash within the next year. Long-term assets may include a category known as investments. These are items that management holds for investment purposes, and they do not intend to “cash in” within the upcoming year. They might consist of other companies’ stock, notes, or bonds. In some cases, they may represent specialized forms—money put away for pension funds. The next major category of long-term assets is fixed assets. Fixed assetsLong-term assets generally valued at their original cost. include plant, equipment, and land. Generally, these are valued at their original cost. The value of these assets will decline over time. As an example, you purchase a new car for $25,000. If you were to sell the same car one, two, or five years later, its value would be less than the original purchase price. This recognition is known as depreciationA noncash expense that specifically recognizes that assets decline in value over time., which is a noncash expense that specifically recognizes that assets decline in value over time. Accumulated depreciation is a running total of all depreciation on assets. Depreciation is also found on the income statement. Its presence in that financial statement enables a business to reduce its taxable income. There are many methods by which you can compute the depreciation value on fixed assets. These methods can be split into two broad categories: straight-line depreciation and accelerated depreciation. Straight-line depreciation is fairly easy to illustrate. In the example of the car, assume you purchased this car for company use. You intend to use it for five years, and at the end of the five years, you plan on scrapping the car and expect that its salvage value will be zero. This is illustrated in Table 9.1 "Depreciation Calculations".
Table 9.1 Depreciation Calculations
| Year 0 | Year 1 | Year 2 | Year 3 | Year 4 | Year 5 | |
|---|---|---|---|---|---|---|
| Depreciation | $0 | $5,000 | $5,000 | $5,000 | $5,000 | $5,000 |
| Accumulated depreciation | $0 | $5,000 | $10,000 | $15,000 | $20,000 | $25,000 |
| Net asset value | $25,000 | $20,000 | $15,000 | $10,000 | $5,000 | $0 |
Because the useful lifetime of the vehicle was five years, the original value of the vehicle was divided by five; therefore, the annual depreciation would equal $5,000 ($25,000/5 = $5,000 per year). The accumulated depreciation simply sums up the prior years’ depreciation for that particular asset.
Accelerated depreciation methods attempt to recapture a major portion of the depreciation earlier in the life of an asset. Accelerated depreciation yields tax-saving benefits earlier in the life of any particular fixed asset. The appropriate method of depreciating an asset for tax purposes is dictated by the Internal Revenue Service (IRS). One should look at the IRS publication 946—How to Depreciate Property—to get a better understanding of the concept of depreciation and how to properly compute it.
The last category of long-term assets is intangible assetsAssets that provide economic value to a business but do not have a tangible, physical presence.—assets that provide economic value to a business but do not have a tangible, physical presence. Intangible assets include items such as patents, franchises, copyrights, and goodwill. Thus the value of long-term assets can be calculated as follows:
long-term assets = investments + fixed assets − accumulated depreciation + intangible assets.The last element on the asset side of the balance sheet is the total assets. This is the summation of current assets and long-term assets.
On the other side of the balance sheet, we have liabilities plus owner’s equity. The elements of liabilities consist of current liabilities and long-term liabilities. These represent what a business owes to others. Current liabilitiesDebts and obligations that are to be paid within the year. are debts and obligations that are to be paid within a year. These include notes payableMoney, such as lines of credit from banks, short-term bank loans, mortgage obligations, or payments on specific assets, that is owed and must be repaid within the year., accounts payableShort-term obligations that a business owes to suppliers, vendors, and other creditors., other items payable (e.g., taxes, wages, and rents), dividends payable, and the current portion of long-term debt. In equation form,
current liabilities = notes payable + accounts payable + other items payable + dividends payable + the current portion of long-term debt.Notes payable represents money that is owed and which must be repaid within a year. It is fairly inclusive because it may include lines of credit from banks that have been used, short-term bank loans, mortgage obligations, or payments on specific assets that are due within a year.
Accounts payable are short-term obligations that a business owes to suppliers, vendors, and other creditors. It may consist of all the supplies and materials that were purchased on credit.
Other items payable can include items such as the payroll and tax withholdings owed to employees or the government but which have not as of yet been paid.
Dividends payable is a term that is appropriate for businesses structured as corporations. This category represents the amount that a business plans to pay its shareholders.
The current portion of long-term debt represents how much of the long-term debt must be repaid within the upcoming fiscal year. This would include the portion of the principal that is due in this fiscal year.
The other portion of liabilities is represented by long-term liabilities. These are debts payable over a period greater than one year and include long-term debt, pension fund liability, and long-term lease obligations. In equation form,
long-term liabilities = long-term debt + pension fund liabilities + long-term lease obligations.Total liabilities is the sum of current liabilities and long-term liabilities.
The other major component of the right-side of the balance sheet is owner’s (or stockholders’) equity. Owner’s equity represents the value of the shareholders’ ownership in a business. It is sometimes referred to as net worth. It may be composed of items such as paid in capital and retained earnings. Paid in capital is the amount of money provided by investors through the issuance of common or preferred stock.“Paid in Capital,” Investopedia, accessed December 2, 2011, www.investopedia.com/terms/p/paidincapital.asp. Retained earningsThe cumulative net income that has been reinvested in a business and not paid out to shareholders as dividends. is the cumulative net income that has been reinvested in a business and which has not been paid out to shareholders as dividends.“Retained Earnings,” The Free Dictionary, accessed December 2, 2011, financial-dictionary.thefreedictionary.com/Retained+Earnings.
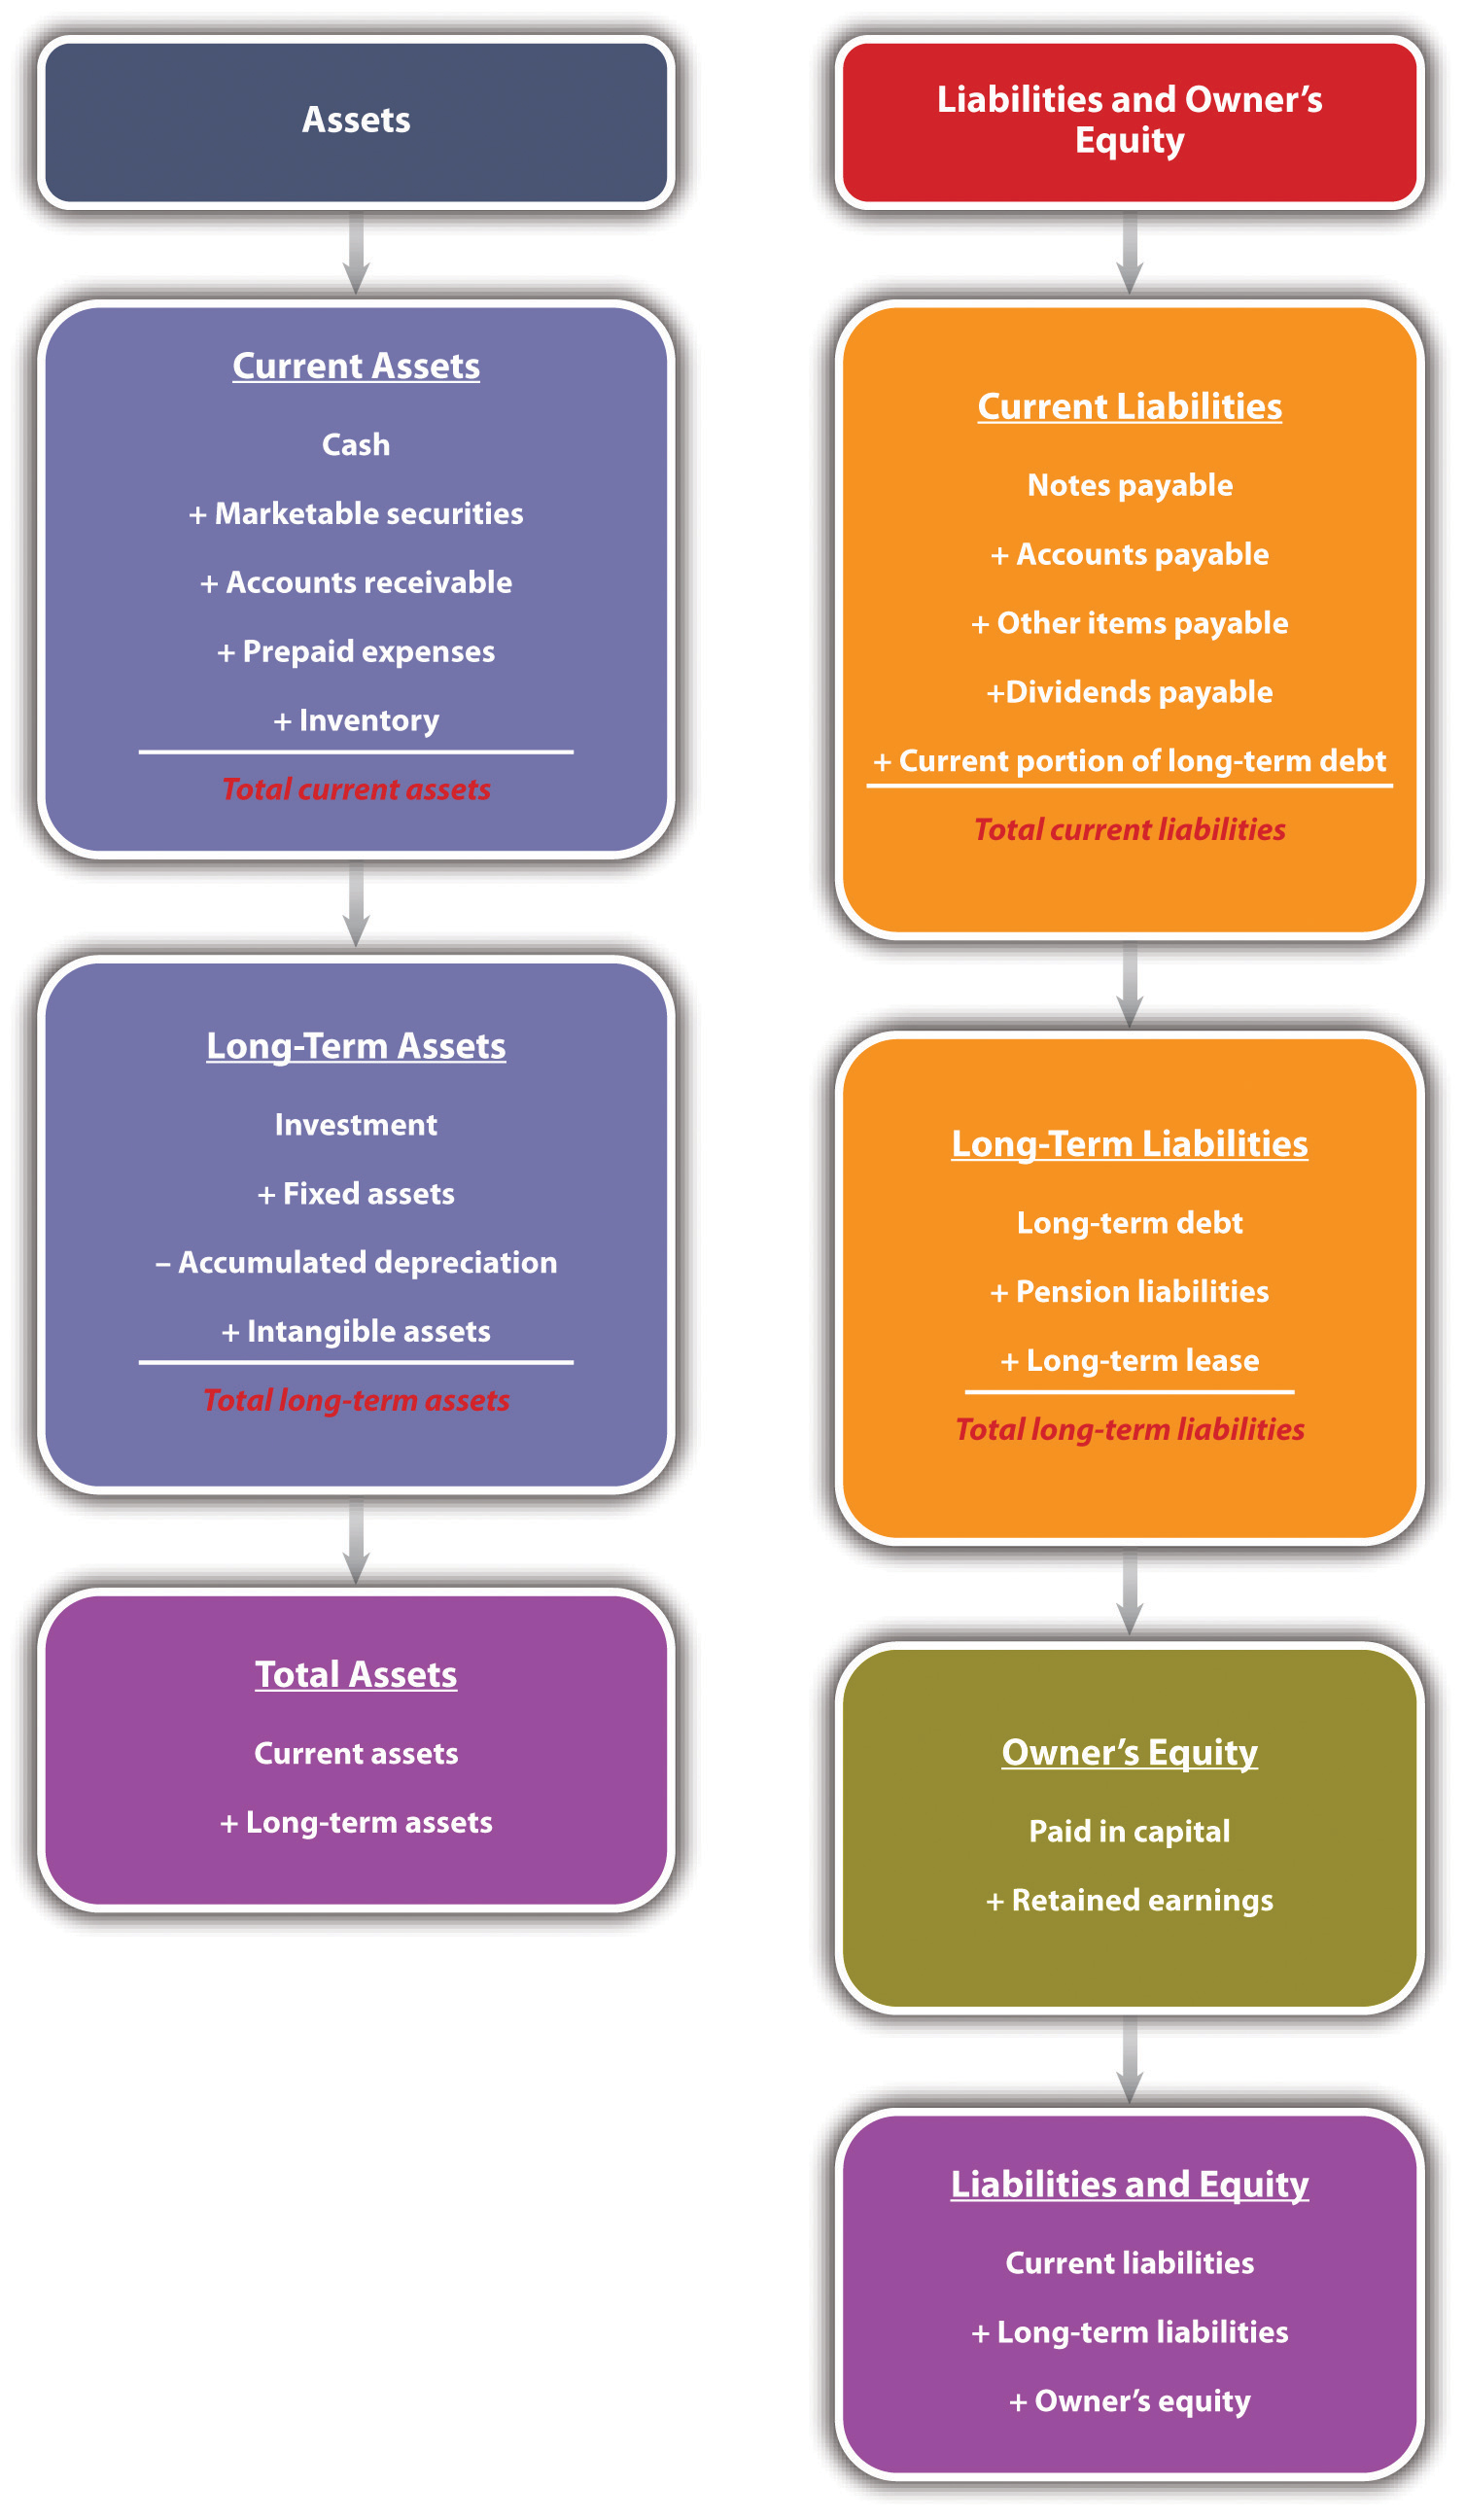
The entire balance sheet and its calculations are summarized in Figure 9.2 "The Balance Sheet".
Figure 9.2 The Balance Sheet
In Table 9.2 "Acme Enterprises’ Balance Sheet, 2005–2010 ($ Thousands)", we provide six years’ worth of balance sheet statements for a hypothetical small business—Acme Enterprises. It is obviously important to have such information, but what exactly might this tell us in terms of the overall success and operation of the business? We will return to these statements in Section 9.3 "Financial Ratio Analysis" to show how those questions can be addressed with ratio analysis.
Table 9.2 Acme Enterprises’ Balance Sheet, 2005–2010 ($ Thousands)
| December 31 | ||||||
|---|---|---|---|---|---|---|
| Assets | 2005 | 2006 | 2007 | 2008 | 2009 | 2010 |
| Cash and marketable securities | $30.0 | $32.3 | $34.7 | $37.3 | $40.1 | $43.1 |
| Accounts receivable | $100.0 | $107.5 | $115.6 | $124.2 | $133.5 | $143.6 |
| Inventories | $70.0 | $75.3 | $80.9 | $87.0 | $93.5 | $100.5 |
| Other current assets | $90.0 | $96.8 | $104.0 | $111.8 | $120.2 | $129.2 |
| Total current assets | $290.0 | $311.8 | $335.1 | $360.3 | $387.3 | $416.3 |
| Property, plant, and equipment—gross | $950.0 | $1,154.5 | $1,387.2 | $1,654.6 | $1,958.1 | $2,306.2 |
| Accumulated depreciation | $600.0 | $695.0 | $810.5 | $949.2 | $1,114.6 | $1,310.4 |
| Property, plant, and equipment—net | $350.0 | $459.5 | $576.7 | $705.4 | $843.5 | $995.7 |
| Other noncurrent assets | $160.0 | $176.0 | $193.6 | $213.0 | $234.3 | $257.7 |
| Total assets | $800.0 | $947.3 | $1,105.5 | $1,278.6 | $1,465.1 | $1,669.7 |
| Liabilities | ||||||
| Accounts payable | $91.0 | $97.8 | $105.2 | $113.0 | $121.5 | $130.6 |
| Short-term debt | $150.0 | $177.5 | $216.3 | $264.2 | $328.1 | $406.0 |
| Other current liabilities | $110.0 | $118.3 | $127.1 | $136.7 | $146.9 | $157.9 |
| Total current liabilities | $351.0 | $393.6 | $448.6 | $513.9 | $596.5 | $694.6 |
| Long-term debt | $211.0 | $211.0 | $211.0 | $211.0 | $211.0 | $211.0 |
| Deferred income taxes | $50.0 | $53.8 | $57.8 | $62.1 | $66.8 | $71.8 |
| Other noncurrent liabilities | $76.0 | $81.7 | $87.8 | $94.4 | $101.5 | $109.1 |
| Total liabilities | $688.0 | $740.0 | $805.2 | $881.4 | $975.8 | $1,086.5 |
| Paid in capital | $— | $— | $— | $— | $— | $— |
| Retained earnings | $112.0 | $207.3 | $300.3 | $397.2 | $489.3 | $583.3 |
| Total owner’s equity | $112.0 | $207.3 | $300.3 | $397.2 | $489.3 | $583.3 |
| Total liabilities + owner’s equity | $800.0 | $947.3 | $1,105.5 | $1,278.6 | $1,465.1 | $1,669.7 |
Video Clip 9.6
Beginner’s Guide to Financial Statements: Balance Sheets
(click to see video)An introduction to the balance sheet.
Video Clip 9.7
What Is the Balance Sheet?
(click to see video)A voice-over PowerPoint presentation describing the balance sheet. Be aware that this is seven minutes long.
Video Clip 9.8
Balance Sheet: How to Explain How a Balance Sheet Works
(click to see video)Another description of the balance sheet.
The Income Statement
Whereas the balance sheet looks at a firm at a particular point (date) in time, the income statementA report that examines the overall profitability of a firm over a particular period of time. examines the overall profitability of a firm over a particular length or period of time. Normally, there are several time periods that may be used: fiscal year, fiscal quarter, or monthly. The income statement is also known as a profit and loss statement. It identifies all sources of revenues generated by a business and all the expenses incurred. The income statement provides the best insight into whether a business is profitable.
The income statement begins by identifying the sales or income for the designated period of time. Sales would be all the revenues derived from all the products and services sold during that time. The term income is sometimes used and represents all revenues and additional incomes produced by a business during the designated period. The next item in the income statement is the cost of goods sold (COGS)All the costs associated with the direct production of goods and services that were sold during the time period., which is composed of all costs associated with the direct production of goods and services that were sold during the time period. It would include the costs of the raw materials used to produce the goods and those costs associated with production, such as direct labor. With these two values, the first measure of profit—gross profitIncome minus COGS.—can be calculated:
gross profit = income − COGS.The next element in the income statement is operating expensesExpenses that are incurred during the normal operation of a business.—expenses that are incurred during the normal operation of a business. Operating expenses can be broken down into four broad categories: selling expenses, general and administrative expenses, depreciation, and other overhead expenses. Selling expenses would include all salaries and commissions paid to the business’s sales staff. It would also include the cost of promotions, advertising expenses, and other sales expenditures. Promotion costs might consist of costs associated with samples or giveaways. Advertising expenses would include all expenditures for print, radio, television, or Internet ads. Other sales expenditures would include money spent on meals, travel, meetings, or presentations by the sales staff. General and administrative expenses are those associated with the operation of a business beyond COGS and direct-selling expenses. Expenditures in this category would include salaries of office personnel, rent, and utilities. Depreciation was covered in the previous subsection. The balance sheet has a component designated accumulated depreciation. This is the summation of several years’ worth of depreciation on assets. In the income statement, depreciation is the value for a particular time period. If you look back in Table 9.1 "Depreciation Calculations", the annual depreciation on the vehicle was $5,000. If a business was developing an income statement for one particular year, then the depreciation would be listed as $5,000. It is a noncash expenditure expense. The last component of operating expenses would be other overhead costs—a fairly generic category that may include items such as office supplies, insurance, or a variety of services a business might use. Having identified all the components of operating expenses, one is now in a position to compute a second measure of profitability—operating profitGross profit minus operating expenses., which is sometimes referred to as earnings before interest and taxes (EBIT):
operating profit (EBIT) = gross profit − operating expenses.The next section of the income statement is designated other revenues and expensesOther nonoperational revenues and interest payments on loans and other debt instruments.. This segment would include other nonoperational revenues (such as interest on cash or investments) and interest payments on loans and other debt instruments. When the other revenues and expenses are subtracted from the operating profit, one is left with earnings before taxes (EBT)Operating profit minus other revenue and expenses.:
EBT = operating profit − other revenues and expenses.Taxes are then computed on the EBT and then subtracted. This includes all federal, state, and local tax payments that a business is obligated to pay. This brings us to our last measure of profitability—net profitEBT minus taxes.:
net profit = EBT − taxes.If a business does not pay out dividends, the net profit becomes an addition to retained earnings. The format of the income statement is summarized in Figure 9.3 "The Income Statement". The income statement is the item that most individuals look at to determine the success of business operations. In Table 9.3 "Acme Enterprises’ Income Statement, 2005–10 ($ Thousands)", the income statements for Acme Enterprises are given for the period 2005 to 2010.
Figure 9.3 The Income Statement
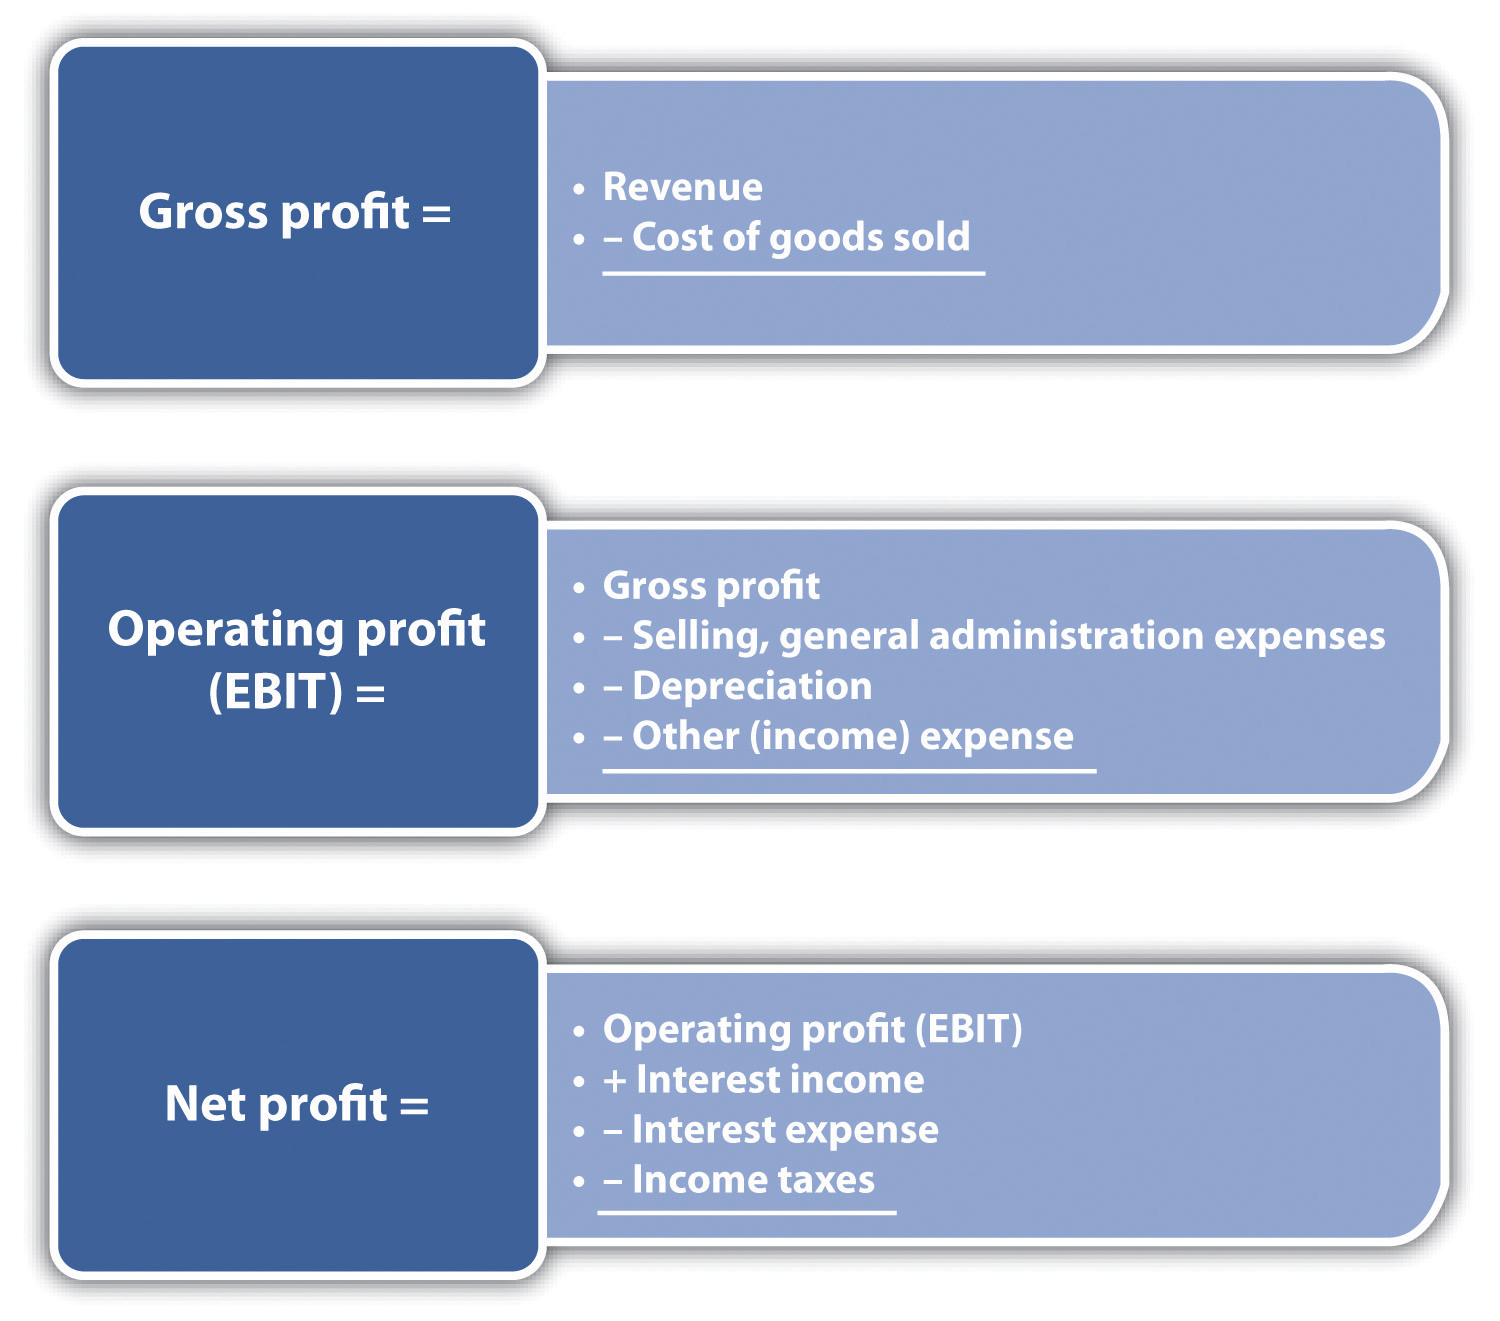
Table 9.3 Acme Enterprises’ Income Statement, 2005–10 ($ Thousands)
| 2005 | 2006 | 2007 | 2008 | 2009 | 2010 | |
|---|---|---|---|---|---|---|
| Sales | $1,000.0 | $1,075.0 | $1,155.6 | $1,242.3 | $1,335.5 | $1,435.6 |
| COGS | $500.0 | $537.5 | $566.3 | $608.7 | $641.0 | $689.1 |
| Gross operating profit | $500.0 | $537.5 | $589.4 | $633.6 | $694.4 | $746.5 |
| Selling and general administrative expenses | $250.0 | $268.8 | $288.9 | $310.6 | $333.9 | $358.9 |
| Depreciation | $95.0 | $115.5 | $138.7 | $165.5 | $195.8 | $230.6 |
| Other net (income)/expenses | $0.0 | $0.0 | $0.0 | $0.0 | $0.0 | $0.0 |
| EBIT | $155.0 | $153.3 | $161.7 | $157.5 | $164.8 | $157.0 |
| Interest income | $2.1 | $2.3 | $2.4 | $2.6 | $2.8 | $3.0 |
| Interest expense | $10.5 | $12.4 | $15.1 | $18.5 | $23.0 | $28.4 |
| Pretax income | $146.6 | $143.1 | $149.0 | $141.7 | $144.6 | $131.6 |
| Income taxes | $51.31 | $50.10 | $52.16 | $49.58 | $50.61 | $46.06 |
| Net income | $95.29 | $93.04 | $96.87 | $92.08 | $93.99 | $85.54 |
| Dividends | $— | $— | $— | $— | $— | $— |
| Addition to retained earnings | $95.29 | $93.04 | $96.87 | $92.08 | $93.99 | $85.54 |
Video Clip 9.9
What Is the Income Statement?
(click to see video)A basic introduction to income statements.
The Cash-Flow Statement
Customer satisfaction, employee satisfaction and cash flow the three most important indicators for business.Jack Welch, “A Healthy Company?,” Business Week, May 3, 2006.
Jack Welch
The third component of financial statements is the cash-flow statementMaps out where cash is flowing into a firm and where it flows out and recognizes that there may be a significant difference between profits and cash flow.. There are two types of cash-flow statements—one examines cash flows for a given period (historic), and the other is a projection of future cash flows. The historic cash-flow statementA statement similar to the income statement in that it looks at cash inflows and cash outflows for a business during a specified period of time. is similar to the income statement in that it looks at cash inflows and cash outflows for a business during a specified period of time. Like the income statement, these periods of time can be the fiscal year, the fiscal quarter, or a month. The cash-flow projections statementA statement that attempts to identify cash flows into a firm and cash flows from a firm for some future period. It recognizes that there may be a significant difference between profits and cash flow. attempts to identify cash flows into a firm and cash flows from a firm for some future period. This projection is extremely important because it may identify future subperiods in which a firm is producing a negative cash flow—where cash outflows exceed cash inflows.
From the standpoint of a small business owner, cash-flow statements provide insight into where cash flows are coming and going. The cash-flow projections statement may be the most important component of all the financial statements. Its importance stems from the fact that the flow of cash into a firm may not be synchronized with its cash outflows. Should there be a significant mismatch with cash outflows being significantly higher than cash inflows, a business may be in great difficulty with respect to meeting its current obligations, such as payroll, paying suppliers, and meeting short-term creditors. As we will see, cash-flow projection statements require several forecasts. These are discussed later in this section.
At some point, many businesses will experience negative cash flow. In fact, a negative cash flow is quite common in start-up operations and high-growth businesses where there is a pressing need for capital expenditures, research and development expenditures, and other significant cash outflows. One can also see the recurring presence of negative cash flows in businesses with seasonal sales. Negative cash flows can be covered by short-term borrowing. However, this type of borrowing brings up two important issues. First, any type of borrowing raises the overall debt level of a business, which might have an impact on the interest rate on the debt. Second, when a negative cash flow exists either because of an unforeseen exigency or because a business owner has failed to properly conduct a cash-flow projection analysis, a lender might look at a business in a jaundiced manner, which could have long-term consequences for a business.
A careful examination of the cash-flow statement could illustrate a point that has been mentioned several times in this book: there can be a significant difference between positive cash flow and profit. In looking at the income statement, one could find a positive net income (profit) and then examine the cash-flow statement and discover that a business has a significant negative cash flow. The cash-flow statement specifically maps out where cash is flowing into a firm and where it flows out. A properly developed cash-flow statement will show if a business will be generating enough cash to continue operations, whether it has sufficient cash for new investments, and whether it can pay its obligations. As previously stated, many of the uninitiated will look singularly at profits, while those who have greater expertise in business will always believe that cash is king.
As a way of visualization, the cash-flow statement bears some similarity to the bank statement you may receive at the end of the month. A bank statement shows the beginning cash balance, deposits (cash inflows), and checks you have written (cash outflows) for that month. Hopefully, you have a positive cash flow—cash inflows are greater than cash outflows—and you have not bounced any checks. Unlike the bank statement, the cash-flow statement is broken into three major categories: operations, financing, and investing. Cash flow from operations examines the cash inflows from all revenues, plus interest and dividend payments from investments held by a business. It then identifies the cash outflows for paying suppliers, employees, taxes, and other expenses. Cash flow from investing examines the impact of selling or acquiring current and fixed assets. Cash flow from financing examines the impact on the cash position from the changes in the number of shares and changes in the short and long-term debt position of a firm.
Cash inflows from operating activities consist of the following:
- Cash derived from the sale of goods or services
- Cash derived from accounts receivable
- Any cash derived from interest or dividends
- Any other cash derived that is not identified with financing or investments
The cash outflows from operating activities consist of the following:
- Cash outlays for goods purchased in the creation of goods and services
- Cash outlays for payment to suppliers
- Cash outlays to employees
- Cash paid for taxes or interest paid to creditors
Financing focuses on the cash flows associated with debt or equity. Some of the cash inflows associated with financing activities consist of the following:
- Cash from the sale of a company’s stock
- Cash received from borrowing (debt)
Cash outflows associated with financing consist of the following:
- Cash outlays to repay principal on long- and short-term debt
- Cash outlays to repurchase preferred stocks
- Cash outlays to pay for dividends on either common or preferred stock
The third category is investing. The sources of cash flow from investing activities consist of the following:
- Cash received from the sale of assets
- Cash received from the sale of equity investments
- Cash received from collections on a debt instrument
Cash outflows associated with investing activities consist of the following:
- Cash outlays to acquire a debt instrument of another business
- Cash payments to buy equity interest in other businesses
- Cash outlays to purchase a productive asset
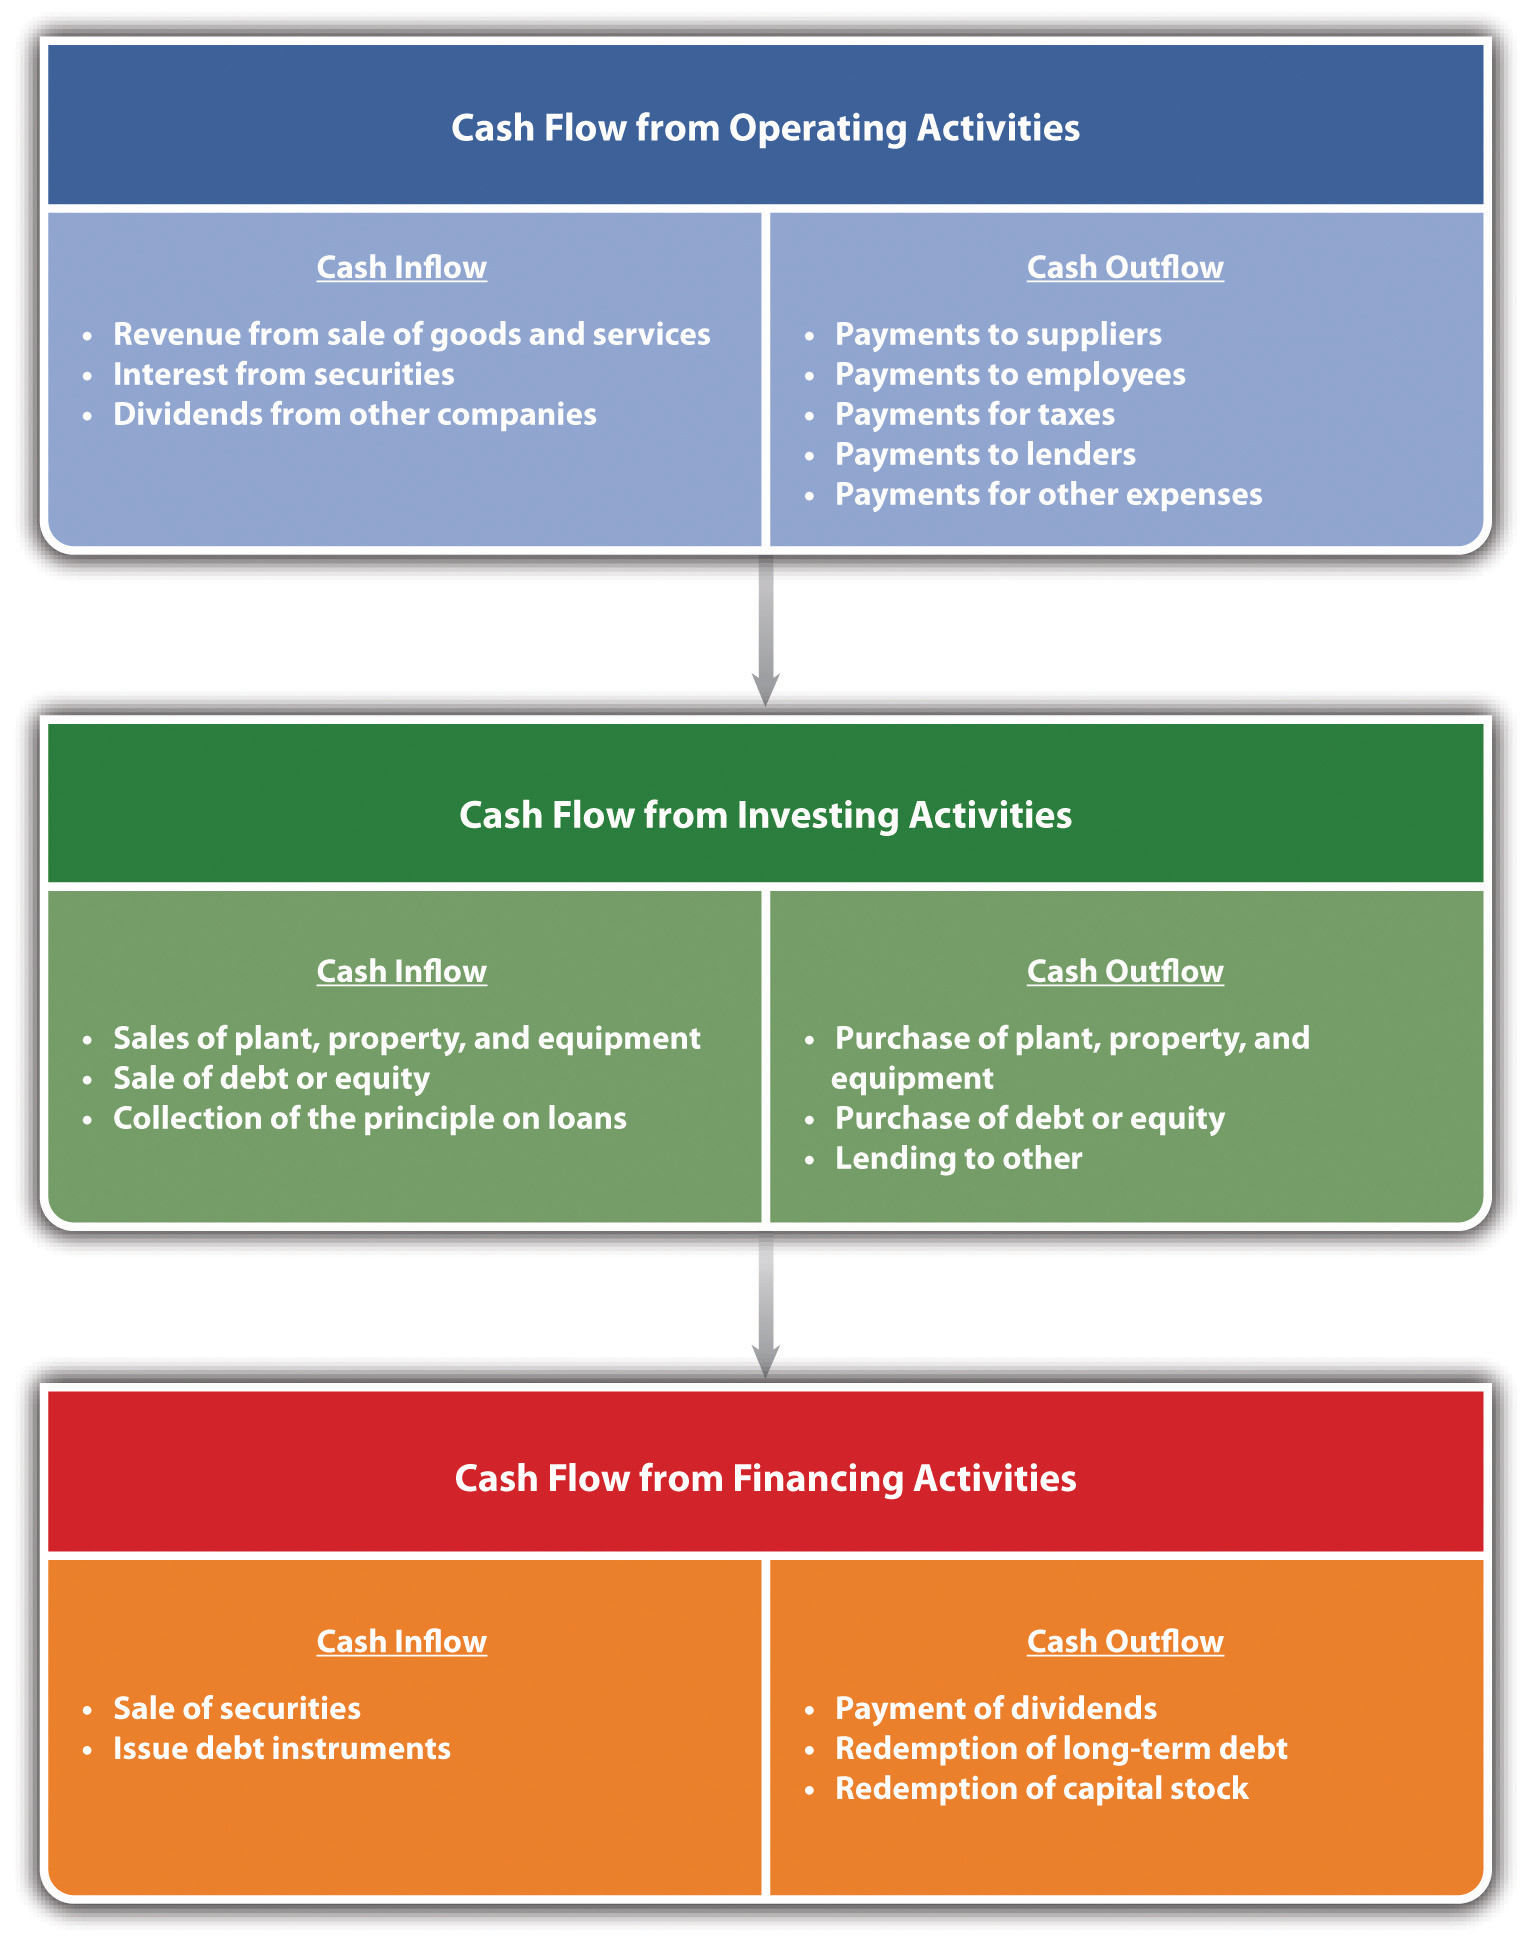
A schematic of the cash-flow statement’s three areas of analysis is presented in Figure 9.4 "Cash Flow Breakdown".
Figure 9.4 Cash Flow Breakdown
Cash-flow projection statements are about the state of future cash flows, which means they require forecasts. This translates into multiple forecasts—sales forecasts, forecasts of expenses, forecasts for necessary investments, and forecasts for a business’s financing requirements. The importance of forecasts for planning is discussed in Chapter 5 "The Business Plan".
The most common approach for cash-flow forecasting in small businesses centers on projections of cash receipts and disbursements. These projections are often based on recent past data. We will demonstrate—shortly—this approach through an extensive example. This approach is generally limited to short and midterm forecasts (i.e., three to twelve months). There are other approaches to cash-flow forecasting; however, given the relative complexity of these approaches, they are often used only by larger and more sophisticated businesses. These other approaches include the adjusted net income method, the pro forma balance sheet method, and the accrual reversal method.Richard Bort, “Medium-Term Funds Flow Forecasting,” in Corporate Cash Management Handbook, ed. Richard Bort (New York: Warren Gorham & Lamont, 1990), 125.
The concept of cash-flow projection forecasting can be illustrated by using an example. Alex McLellan runs Soft Serve Services—a business that repairs and services soft-serve ice cream machines. His clients include ice cream parlors, resorts, and outlets at malls. Alex is a former engineer and somewhat methodical in developing his calculations for future budgets. He will be operating on the assumption that his business will be limited to his current locale. Alex has followed the same pattern for forecasting cash flows for years. First, he gathers together from his records his monthly and annual sales for the last five years, which are provided in Table 9.4 "Sales Data for Soft Serve Services".
Table 9.4 Sales Data for Soft Serve Services
| 2006 | 2007 | 2008 | 2009 | 2010 | |
|---|---|---|---|---|---|
| January | $20,135 | $20,562 | $21,131 | $22,657 | $23,602 |
| February | $19,545 | $19,739 | $19,852 | $22,154 | $22,307 |
| March | $24,451 | $24,360 | $24,594 | $26,361 | $27,590 |
| April | $22,789 | $23,374 | $24,000 | $26,220 | $32,968 |
| May | $25,986 | $28,531 | $27,099 | $30,057 | $34,834 |
| June | $28,357 | $30,468 | $32,893 | $34,168 | $37,078 |
| July | $32,650 | $35,307 | $36,830 | $40,321 | $46,899 |
| August | $34,488 | $37,480 | $40,202 | $44,890 | $52,042 |
| September | $26,356 | $27,909 | $29,317 | $32,917 | $33,309 |
| October | $24,211 | $22,795 | $23,719 | $24,339 | $25,691 |
| November | $21,722 | $22,272 | $22,147 | $23,080 | $23,466 |
| December | $22,017 | $22,454 | $28,321 | $30,468 | $33,583 |
| Annual sales | $302,706 | $315,252 | $330,105 | $357,631 | $393,368 |
Using these data, Alex was able to calculate the growth rate in sales for the last four of the five years. As an example:
growth rate 2007 = (sales 2007 − sales 2006) / (sales 2006) = ($315,252 − $302,706) / ($302,706) = ($12,546) / ($302,706) = 4.14 percent.Although the average of the four annual growth rates was 6.8 percent (the annual growth rates were 4.14 percent in 2007, 4.71 percent in 2008, 8.34 percent in 2009, and 9.99 percent in 2010, thus having an average of 6.8 percent), Alex believes that the last two years were unusually good, and the growth rate for 2011 would be slightly lower at a rate of 6.5 percent. This rate of growth would mean that his estimate for sales in 2011 would be $418,937, which comes from the following:
annual sales 2011 = annual sales 2010 × (1 + growth rate 2011) = $393,368 × (1.065).He knows from experience that his sales are quite seasonal, as illustrated in Figure 9.5 "Seasonality in Sales". Alex believes that there is a high degree of consistency in this seasonality of sales across the years. So he computes (using a spreadsheet program) what percentage of annual sales occurs in each month. This calculation for January 2006 would be given as follows:
percentage of annual sales for January 2006 = (January 2006 sales) / (annual sales 2006) = ($20,135) / ($302,706) = 6.65 percent.His analysis for each month in each of the five years is provided in Table 9.5 "Monthly Sales as a Percentage of Annual Sales", as are the averages for each month.
Figure 9.5 Seasonality in Sales
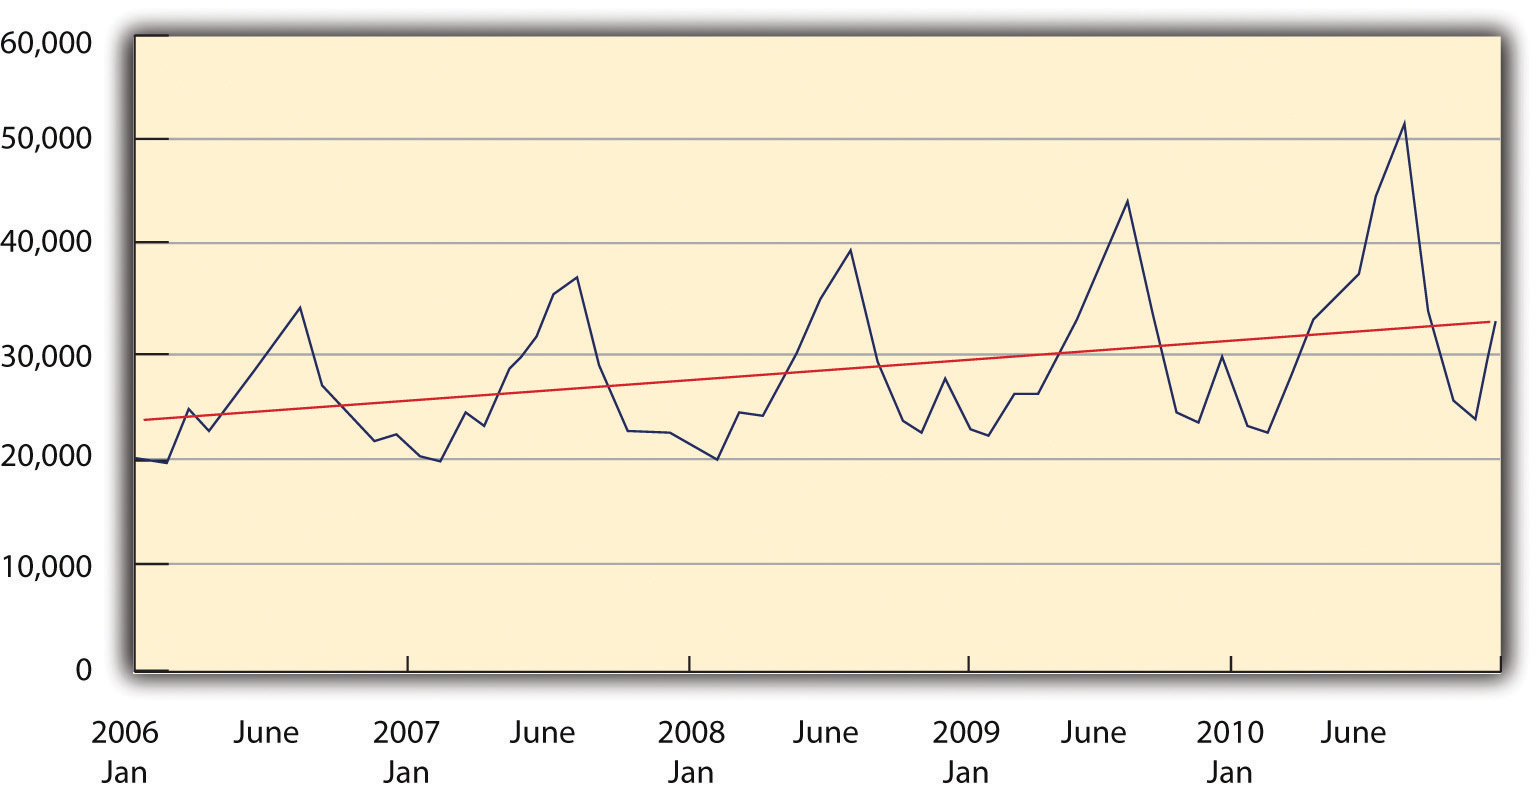
Table 9.5 Monthly Sales as a Percentage of Annual Sales
| 2006 (%) | 2007 (%) | 2008 (%) | 2009 (%) | 2010 (%) | Average (%) | |
|---|---|---|---|---|---|---|
| January | 6.65 | 6.52 | 6.40 | 6.34 | 6.00 | 6.38 |
| February | 6.46 | 6.26 | 6.01 | 6.19 | 5.67 | 6.12 |
| March | 8.08 | 7.73 | 7.45 | 7.37 | 7.01 | 7.53 |
| April | 7.53 | 7.41 | 7.27 | 7.33 | 8.38 | 7.59 |
| May | 8.58 | 9.05 | 8.21 | 8.40 | 8.86 | 8.62 |
| June | 9.37 | 9.66 | 9.96 | 9.55 | 9.43 | 9.60 |
| July | 10.79 | 11.20 | 11.16 | 11.27 | 11.92 | 11.27 |
| August | 11.39 | 11.89 | 12.18 | 12.55 | 13.23 | 12.25 |
| September | 8.71 | 8.85 | 8.88 | 9.20 | 8.47 | 8.82 |
| October | 8.00 | 7.23 | 7.19 | 6.81 | 6.53 | 7.15 |
| November | 7.18 | 7.06 | 6.71 | 6.45 | 5.97 | 6.67 |
| December | 7.27 | 7.12 | 8.58 | 8.52 | 8.54 | 8.01 |
Alex was the able to estimate sales for January 2011 in the following manner:Because Alex was using spreadsheet software, the monthly averages were computed out to more than two decimal places. This explains why the calculations are not exact. As in the case of January, the actual monthly percentage was closer to 6.3821 percent, which provides the monthly forecast of $26,737.
January 2011 sales = annual sales 2011 × January percentage = ($418,937) × (6.38 percent) = $26,737.Using the same approach, he was able to compute forecasted sales for February and March. To maintain sales, Alex offers his customers a rather generous credit policy. He asks them to pay 50 percent of the bill in the month in which the work is done; another 35 percent of the bill in the following month, and the remaining 15 percent of the bill two months after the work has been completed. For Alex to project cash inflows for January, he would need to consider sales from the two prior months—December and November. His projected cash inflows for January would be determined as follows:These calculations have been rounded to the nearest dollar. This is also true for the values in Table 9.6 "Cash-Flow Projections for the First Quarter of 2011".
November 2010 sales = $23,466 December 2010 sales = $33,583 January 2011 sales = $26,737 cash inflow from November 2010 sales = ($23,466) × 15 percent = $3,520 cash inflow from December 2010 sales = ($33,583) × 35 percent = $11,754 cash inflow from January 2011 sales = ($26,737) × 50 percent = $13,368 total cash inflows from operations = sum of cash inflows for three months = $28,642.Alex then estimates his cash outflows from operations. From past experience, he knows that the purchases of parts and materials run approximately 50 percent of the dollar value of his sales. However, because of delays in acquiring parts and materials, he must order them in advance. He has to anticipate what sales would be the following month and has to place a purchase order predicated on that value. Further, 60 percent of that dollar value is in that month and the remaining 40 percent is in the following month. This can be illustrated for January 2011. To determine the purchases of parts and materials in January, he begins with his forecast for sales in February 2011.
February 2011 sales = $25,637 parts and materials purchases in January 2011 = 50 percent of February 2011 sales = 50 percent × $25,637 = $12,819.He is obligated to pay 60 percent of this amount in January 2011 and the remaining 40 percent in February 2011. This also means that his cash outlay in January 2011 must include a payment for 40 percent of December’s purchases.
parts and materials purchases in December 2011 = 50 percent of January 2011 sales = 50 percent × $26,737 = $13,369 parts and materials cash outlay in January 2011 = 60 percent of purchases January 2011 + 40 percent of purchases December 2010 parts and materials cash outlay in January 2011 = (60 percent × $12,819) + (40 percent × $13,369) = $13,038.In addition to purchasing parts and materials, Alex has to consider his operational expenses, which include wages, payroll taxes, office supplies, repairs, advertising, and expenses related to automobiles, phone bills, rent, utilities, expenses associated with accounting services, and taxes. These are itemized in Table 9.6 "Cash-Flow Projections for the First Quarter of 2011". Adding in these expenses brings his total cash outflow $19,864.
For January 2001, he has no cash inflows or cash outflows with respect to either investment activities or financing activities. This means that his total cash flow for January 2011 represents the difference between cash inflows and outflows for operational activities. His cash flow for January 2011 was a positive value of $8,778. Because he ended December 2010 with a cash position of $3,177, the addition of this $8,778 brings his cash position at the end of January 2011 to $11,955. His bank, with which he has an open line of credit, requires that he maintain a minimum of $2,500 in his cash account each month. Should Alex drop below this amount, his bank will lend him—automatically—up to $5,000.
It is useful to examine the rest of his projections (see Table 9.6 "Cash-Flow Projections for the First Quarter of 2011"). February 2011 follows much as January 2011. Alex was able to produce a positive net cash flow in February of $5,669, which brought his ending cash position at the end of February 2011 to $17,624.
Unlike the other months of 2011, Alex planned on producing cash flows with respect to investment activities in March 2011. He planned on selling an asset to a friend and anticipated a positive cash flow of $500 from this sale. He also planned on purchasing a used van in March 2011 and estimated that the price would be $21,000. His intention was to pay for the van from his cash account and not take out a car loan. His cash outflows for March 2011 were a negative $16,075. With the bank’s requirement of maintaining a $2,500 minimum balance, this meant that Alex activated the automatic borrowing option from his bank to the amount of $950. It required some effort on Alex’s part to build the cash-flow spreadsheet, but it enabled him to examine various options, such as the impact of deferring the purchase of the van until May 2011. Although any cash-flow spreadsheet is dependent on the accuracy of forecasts, it is a mechanism by which a small business owner can examine various scenarios and determine the possible impact of those scenarios on his or her overall cash flow.
Table 9.6 Cash-Flow Projections for the First Quarter of 2011
| November | December | January | February | March | |
|---|---|---|---|---|---|
| Cash Flow from Operating Activities | |||||
| Cash on hand at end of month | $3,177 | $11,955 | $17,624 | $1,550 | |
| Cash Inflow from Operations | |||||
| Sales | $23,466 | $33,583 | $26,737 | $25,637 | $31,537 |
| Cash flow from month of sales | $13,369 | $12,818 | $15,769 | ||
| Cash flow from prior month’s sales | $11,754 | $9,358 | $8,973 | ||
| Cash flow from two month’s prior sales | $3,520 | $5,037 | $4,011 | ||
| Total cash inflow from operations | $28,642 | $27,214 | $28,752 | ||
| Parts Purchases | |||||
| Cash outflow for this month’s purchases | $7,691 | $9,461 | $9,533 | ||
| Cash outflow for prior month’s purchases | $5,347 | $5,127 | $6,307 | ||
| Gross wages (excludes withdrawals) | $4,000 | $4,000 | $4,000 | ||
| Payroll expenses (taxes, etc.) | $150 | $150 | $150 | ||
| Outside services | $— | $— | $— | ||
| Supplies (office and operating) | $50 | $50 | $50 | ||
| Repairs and maintenance | $— | $— | $450 | ||
| Advertising | $100 | $200 | $250 | ||
| Auto, delivery, and travel | $120 | $150 | $180 | ||
| Accounting and legal | $200 | $200 | $200 | ||
| Rent | $1,650 | $1,650 | $1,650 | ||
| Telephone | $65 | $65 | $65 | ||
| Utilities | $325 | $325 | $325 | ||
| Insurance | $166 | $166 | $166 | ||
| Taxes (real estate, etc.) | $— | $— | $1,000 | ||
| Interest | $— | ||||
| Other expenses | $— | $— | $— | ||
| Total cash outflows from operations | $19,864 | $21,544 | $24,327 | ||
| Sale of asset | $— | $— | $500 | ||
| Sale of debt or equity | $— | $— | $— | ||
| Collection of principal on a loan | $— | $— | $— | ||
| Total cash flow from investing activities | $— | $— | $500 | ||
| Purchase of plant, property, and equipment | $— | $— | $21,000 | ||
| Purchase of debt | $— | $— | $— | ||
| Total cash outflows from investing | $— | $— | $21,000 | ||
| Sales of securities or equity | $— | $— | $— | ||
| Issue of debt instruments | $— | $— | $— | ||
| Total cash inflow from financing activities | $— | $— | $— | ||
| Payment of dividends | $— | $— | $— | ||
| Redemption of long-term debt | $— | $— | $— | ||
| Total cash outflows from financing | $— | $— | $— | ||
| Net cash flow | $8,778 | $5,669 | $(16,075) | ||
| Required cash balance | $2,500 | $2,500 | $2,500 | $2,500 | $2,500 |
| Required borrowing | $— | $— | $(950) |
Key Takeaways
- To truly understand how well a business is doing requires an ability to understand the financial statements of the business.
- The balance sheet shows what a business owns and what claims are on the business.
- The income statement shows how profitable a business is and identifies the expenses of the business.
- Cash flow is the lifeblood of a business’s operation.
- Cash-flow projections are vital for any business.
Exercises
Edwina Haskell was an accomplished high school student who looked forward to attending Southern New England University (SNEU). SNEU was unique in that it operated on a trimester basis, its policy was to actively foster independent development among the students. Edwina’s mother and father each own their own small businesses. Soon after freshman orientation at SNEU, Edwina recognized a need among the students that could be the basis for developing a small business. Freshman students could not bring their cars on the campus. In effect, they were confined to the dorm; if they wished to travel, they had to take school-provided buses that operated on a fixed schedule. Further, the university’s cafeteria closed at eight in the evening. Students who wanted to have some food or snacks after 8:00 p.m. had to call local restaurants that delivered. The few restaurants in the neighborhood around SNEU that had delivery services often were late in their deliveries, and hot food, such as pizza, was frequently delivered cold.
Edwina felt that there was a niche market on the campus. She believed that students would be interested in ordering sandwiches, snacks, and sodas from a fellow student provided that the food could be delivered in a timely fashion. After talking with several students in her dorm complex, she believed that offering a package of a sandwich, a soda, and a small snack, such as potato chips, for $5 and a guaranteed delivery of 15 minutes or less would be a winner. Because her dorm complex consisted of four large adjoining buildings that house nearly 1,600 students, she felt that there would be sufficient demand to make the concept profitable. She talked about this concept with her roommates and with her parents. Her roommates were willing to help prepare the sandwiches and deliver them. She planned on paying each of them $250 per trimester for taking orders, making sandwiches, and delivering them. All three roommates, whom she knew from high school, were willing to be paid at the end of the trimester.
Edwina recognized that for this business plan to work, she would have to have a sufficient inventory of cold cuts, lettuce, tomatoes, soda, chips, and condiments to be able to meet student demands. The small refrigerators in the dorm rooms would not be sufficient. After talking to her parents, they were willing to help her set up her business. They would lend her $1,000 to buy a larger refrigerator to place in her dorm room. She did not have to repay this loan until she graduated in four years, but her parents wanted her to appreciate the challenges of operating a small business. They set up several conditions. First, although she did not have to pay back the $1,000 for the refrigerator for four years, she had to pay interest on this “loan.” She had to repay 3 percent of this loan each trimester. Further, they reminded her that although she could pay her friends at the end of the semester, she would need funds to buy the cold cuts, bread, rolls, soda, snacks, condiments, and supplies such as foil to wrap the sandwiches, plus plates and paper bags. Although Edwina was putting $500 of her own money into her business, her parents felt that she might need an infusion of cash during the first year (i.e., the first three trimesters). They were willing to operate as her bank—lending her money, if needed, during the trimesters. However, she had to pay the loan(s) back by the end of the year. They also agreed that the loan(s) would be at a rate of 2 percent per trimester.
Within the first three weeks of her first trimester at SNEU, Edwina purchased the $1,000 refrigerator with the money provided by her parents and installed it in her dorm. She also went out and purchased $180 worth of supplies consisting of paper bags; paper plates; and plastic knives, spoons, and forks. She paid for these supplies out of her original $500 personal investment. She and her roommates would go out once or twice a week, using the SNEU bus system to buy what they thought would be the required amount of cold cuts, bread, rolls, and condiments. The first few weeks’ worth of supplies were purchased out of the remainder of the $500. Students paid in cash for the sandwiches. After the first two weeks, Edwina would pay for the food supplies out of the cash from sales.
In the first trimester, Edwina and her roommates sold 640 sandwich packages, generating revenue of $3,200. During this first trimester, she purchased $1,710 worth of food supplies. She used $1,660 to make the 640 sandwich packages. Fortunately, the $50 of supplies were condiments and therefore would last during the two-week break between the trimesters. Only $80 worth of the paper products were used for the 640 sandwich packages. Edwina spent $75 putting up posters and flyers around the campus promoting her new business. She anticipated that the tax rate would be approximately 35 percent of her earnings before taxes. She estimated this number at the end of the first trimester and put that money away so as to be able to pay her tax bill.
During the two weeks off between the first and second trimester, Edwina and her roommates talked about how they could improve business operations. Several students had asked about the possibility of having warm sandwiches. Edwina decided that she would purchase two Panini makers. So at the beginning of the second trimester, she tapped into her parents’ line of credit for two Panini grills, which in total cost $150. To make sure that the sandwiches would be delivered warm, she and her roommates spent $100 on insulated wrappings. The $100 came from cash. The second trimester proved to be even more successful. The business sold 808 sandwiches, generating revenue of $4,040. During this second trimester, the business purchased $2,100 worth of food supplies, using $2,020 of that to actually create the 808 sandwich packages. They estimated that during the second trimester, they used $101 worth of supplies in creating the sandwich packages.
There was only a one-week break between the second and third trimesters, and the young women were quite busy in developing ideas on how to further expand the business. One of the first decisions was to raise the semester salary of each roommate to $300 apiece. More and more students had been asking for a greater selection of warm sandwiches. Edwina and her roommates decided to do some cooking in the dorms so as to be able to provide meatball and sausage sandwiches. Edwina once again tapped into her parents’ line of credit to purchase $275 worth of cooking supplies. One of the problems they noticed was that sometimes students would place calls to order a sandwich package, but the phones were busy. Edwina hired a fellow student to develop a website where students could place an order and select the time that they would like a sandwich package to be delivered. The cost of creating and operating this website for this third trimester was $300.
This last semester of Edwina’s freshman year proved to be the most successful in terms of sales. They were able to fulfill orders for 1,105 sandwich packages, generating revenue of $5,525. Edwina determined that the direct cost of food for these sandwich packages came out to be $2,928.25. The direct cost of paper supplies was $165.75. At the end of her freshman year, Edwina repaid her parents the $425 that came from her credit line that was used to purchase the Panini makers and the cooking utensils.
- Prepare a beginning balance sheet for the first day of Edwina’s business.
- Prepare income statements for the end of each trimester.
- Prepare balance sheets for the end of each semester.