This is “Impact of Cost Structure on Cost-Volume-Profit Analysis”, section 6.4 from the book Accounting for Managers (v. 1.0). For details on it (including licensing), click here.
For more information on the source of this book, or why it is available for free, please see the project's home page. You can browse or download additional books there. To download a .zip file containing this book to use offline, simply click here.
6.4 Impact of Cost Structure on Cost-Volume-Profit Analysis
Learning Objective
- Understand how cost structure affects cost-volume-profit sensitivity analysis.
Question: Describing an organization’s cost structure helps us to understand the amount of fixed and variable costs within the organization. What is meant by the term cost structure?
Answer: Cost structureThe proportion of fixed and variable costs to total costs. is the term used to describe the proportion of fixed and variable costs to total costs. For example, if a company has $80,000 in fixed costs and $20,000 in variable costs, the cost structure is described as 80 percent fixed costs and 20 percent variable costs.
Question: Operating leverageThe level of fixed costs within an organization. refers to the level of fixed costs within an organization. How do we determine if a company has high operating leverage?
Answer: Companies with a relatively high proportion of fixed costs have high operating leverage. For example, companies that produce computer processors, such as NEC and Intel, tend to make large investments in production facilities and equipment and therefore have a cost structure with high fixed costs. Businesses that rely on direct labor and direct materials, such as auto repair shops, tend to have higher variable costs than fixed costs.
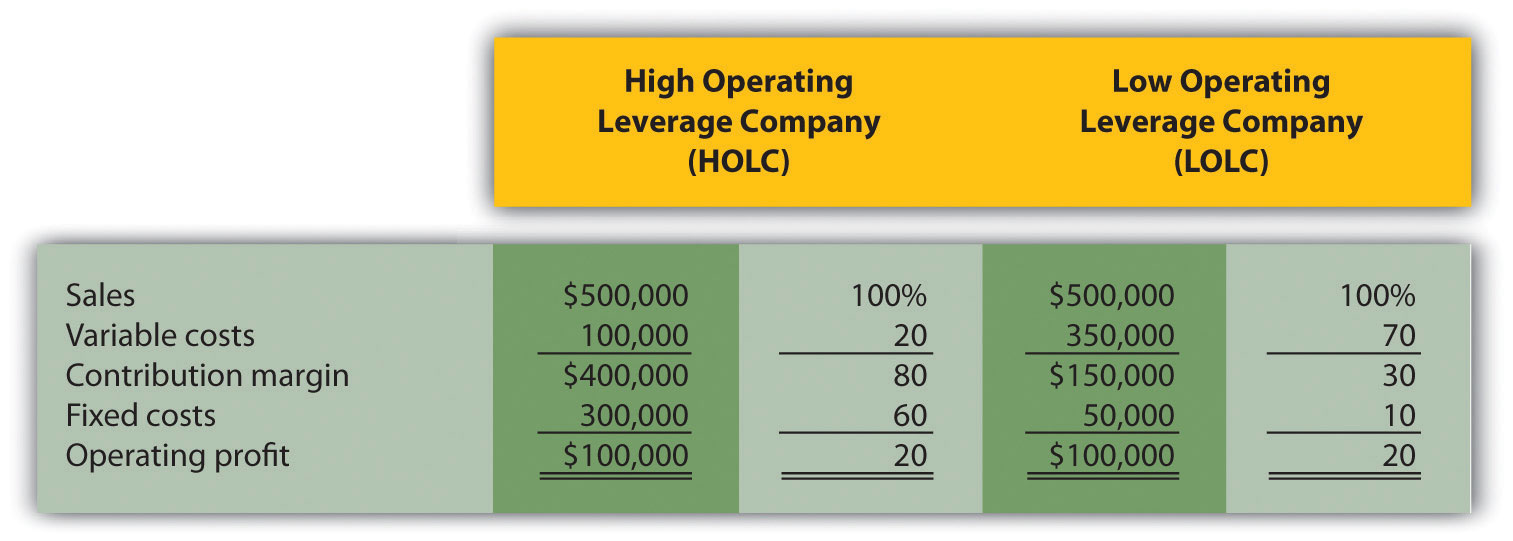
Operating leverage is an important concept because it affects how sensitive profits are to changes in sales volume. This is best illustrated by comparing two companies with identical sales and profits but with different cost structures, as we do in Figure 6.7 "Operating Leverage Example". High Operating Leverage Company (HOLC) has relatively high fixed costs, and Low Operating Leverage Company (LOLC) has relatively low fixed costs.
Figure 6.7 Operating Leverage Example

One way to observe the importance of operating leverage is to compare the break-even point in sales dollars for each company. HOLC needs sales of $375,000 to break even (= $300,000 ÷ 0.80), whereas LOLC needs sales of $166,667 to break even (= $50,000 ÷ 0.30).
Question: Why don’t all companies strive for low operating leverage to lower the break-even point?
Answer: In Figure 6.7 "Operating Leverage Example", LOLC looks better up to the sales point of $500,000 and profit of $100,000. However, once sales exceed $500,000, HOLC will have higher profit than LOLC. This is because every additional dollar in sales will provide $0.80 in profit for HOLC (80 percent contribution margin ratio), and only $0.30 in profit for LOLC (30 percent contribution margin ratio). If a company is relatively certain of increasing sales, then it makes sense to have higher operating leverage.
Financial advisers often say, “the higher the risk, the higher the potential profit,” which can also be stated as “the higher the risk, the higher the potential loss.” The same applies to operating leverage. Higher operating leverage can lead to higher profit. However, high operating leverage companies that encounter declining sales tend to feel the negative impact more than companies with low operating leverage.
To prove this point, let’s assume both companies in Figure 6.7 "Operating Leverage Example" experience a 30 percent decrease in sales. HOLC’s profit would decrease by $120,000 (= 30 percent × $400,000 contribution margin) and LOLC’s profit would decrease by $45,000 (= 30 percent × $150,000 contribution margin). HOLC would certainly feel the pain more than LOLC.
Now assume both companies in Figure 6.7 "Operating Leverage Example" experience a 30 percent increase in sales. HOLC’s profit would increase by $120,000 (= 30 percent × $400,000 contribution margin) and LOLC’s profit would increase by $45,000 (= 30 percent × $150,000 contribution margin). HOLC benefits more from increased sales than LOLC.
Key Takeaway
- The cost structure of a firm describes the proportion of fixed and variable costs to total costs. Operating leverage refers to the level of fixed costs within an organization. The term “high operating leverage” is used to describe companies with relatively high fixed costs. Firms with high operating leverage tend to profit more from increasing sales, and lose more from decreasing sales than a similar firm with low operating leverage.
Review Problem 6.5
What are the characteristics of a company with high operating leverage, and how do these characteristics differ from those of a company with low operating leverage?
Solution to Review Problem 6.5
Companies with high operating leverage have a relatively high proportion of fixed costs to total costs, and their profits tend to be much more sensitive to changes in sales than their low operating leverage counterparts. Companies with low operating leverage have a relatively low proportion of fixed costs to total costs, and their profits tend to be much less sensitive to changes in sales than their high operating leverage counterparts.


