This is “Using Cost-Volume-Profit Models for Sensitivity Analysis”, section 6.3 from the book Accounting for Managers (v. 1.0). For details on it (including licensing), click here.
For more information on the source of this book, or why it is available for free, please see the project's home page. You can browse or download additional books there. To download a .zip file containing this book to use offline, simply click here.


6.3 Using Cost-Volume-Profit Models for Sensitivity Analysis
Learning Objective
- Use sensitivity analysis to determine how changes in the cost-volume-profit equation affect profit.
Question: We can use the cost-volume-profit (CVP) financial model described in this chapter for single-product, multiple-product, and service organizations to perform sensitivity analysis, also called what-if analysis. How is sensitivity analysis used to help managers make decisions?
Answer: Sensitivity analysisAn analysis that shows how the CVP model will change with changes in any of its variables. shows how the CVP model will change with changes in any of its variables (e.g., changes in fixed costs, variable costs, sales price, or sales mix). The focus is typically on how changes in variables will alter profit.
Sensitivity Analysis: An Example
To illustrate sensitivity analysis, let’s go back to Snowboard Company, a company that produces one snowboard model. The assumptions for Snowboard were as follows:
| Sales price per unit | $ 250 |
| Variable cost per unit | 150 |
| Fixed costs per month | 50,000 |
| Target profit | 30,000 |
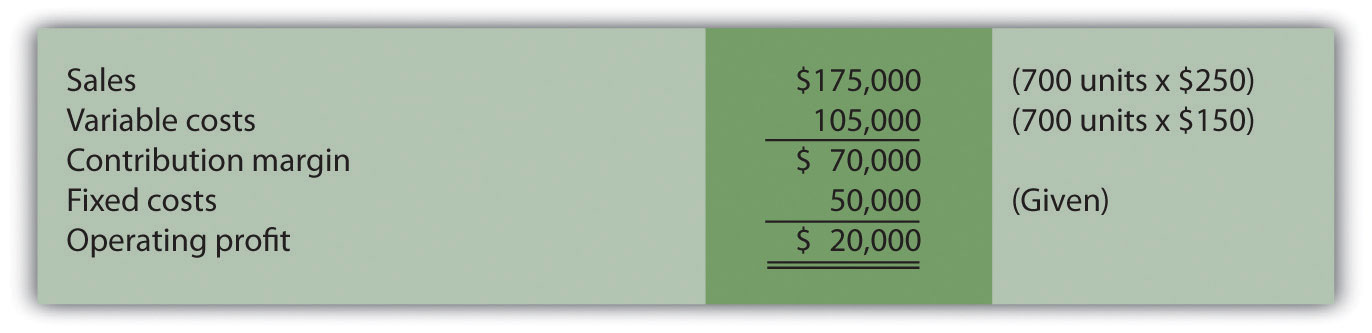
Recall from earlier calculations that the break-even point is 500 units, and Snowboard must sell 800 units to achieve a target profit of $30,000. Management believes a goal of 800 units is overly optimistic and settles on a best guess of 700 units in monthly sales. This is called the “base case.” The base case is summarized as follows in contribution margin income statement format:
Question: Although management believes the base case is reasonably accurate, it is concerned about what will happen if certain variables change. As a result, you are asked to address the following questions from management (you are now performing sensitivity analysis!). Each scenario is independent of the others. Unless told otherwise, assume that the variables used in the base case remain the same. How do you answer the following questions for management?
- How will profit change if the sales price increases by $25 per unit (10 percent)?
- How will profit change if sales volume decreases by 70 units (10 percent)?
- How will profit change if fixed costs decrease by $15,000 (30 percent) and variable cost increases $15 per unit (10 percent)?
Answer: The CVP model shown in Figure 6.6 "Sensitivity Analysis for Snowboard Company" answers these questions. Each column represents a different scenario, with the first column showing the base case and the remaining columns providing answers to the three questions posed by management. The top part of Figure 6.6 "Sensitivity Analysis for Snowboard Company" shows the value of each variable based on the scenarios presented previously, and the bottom part presents the results in contribution margin income statement format.
Figure 6.6 Sensitivity Analysis for Snowboard Company
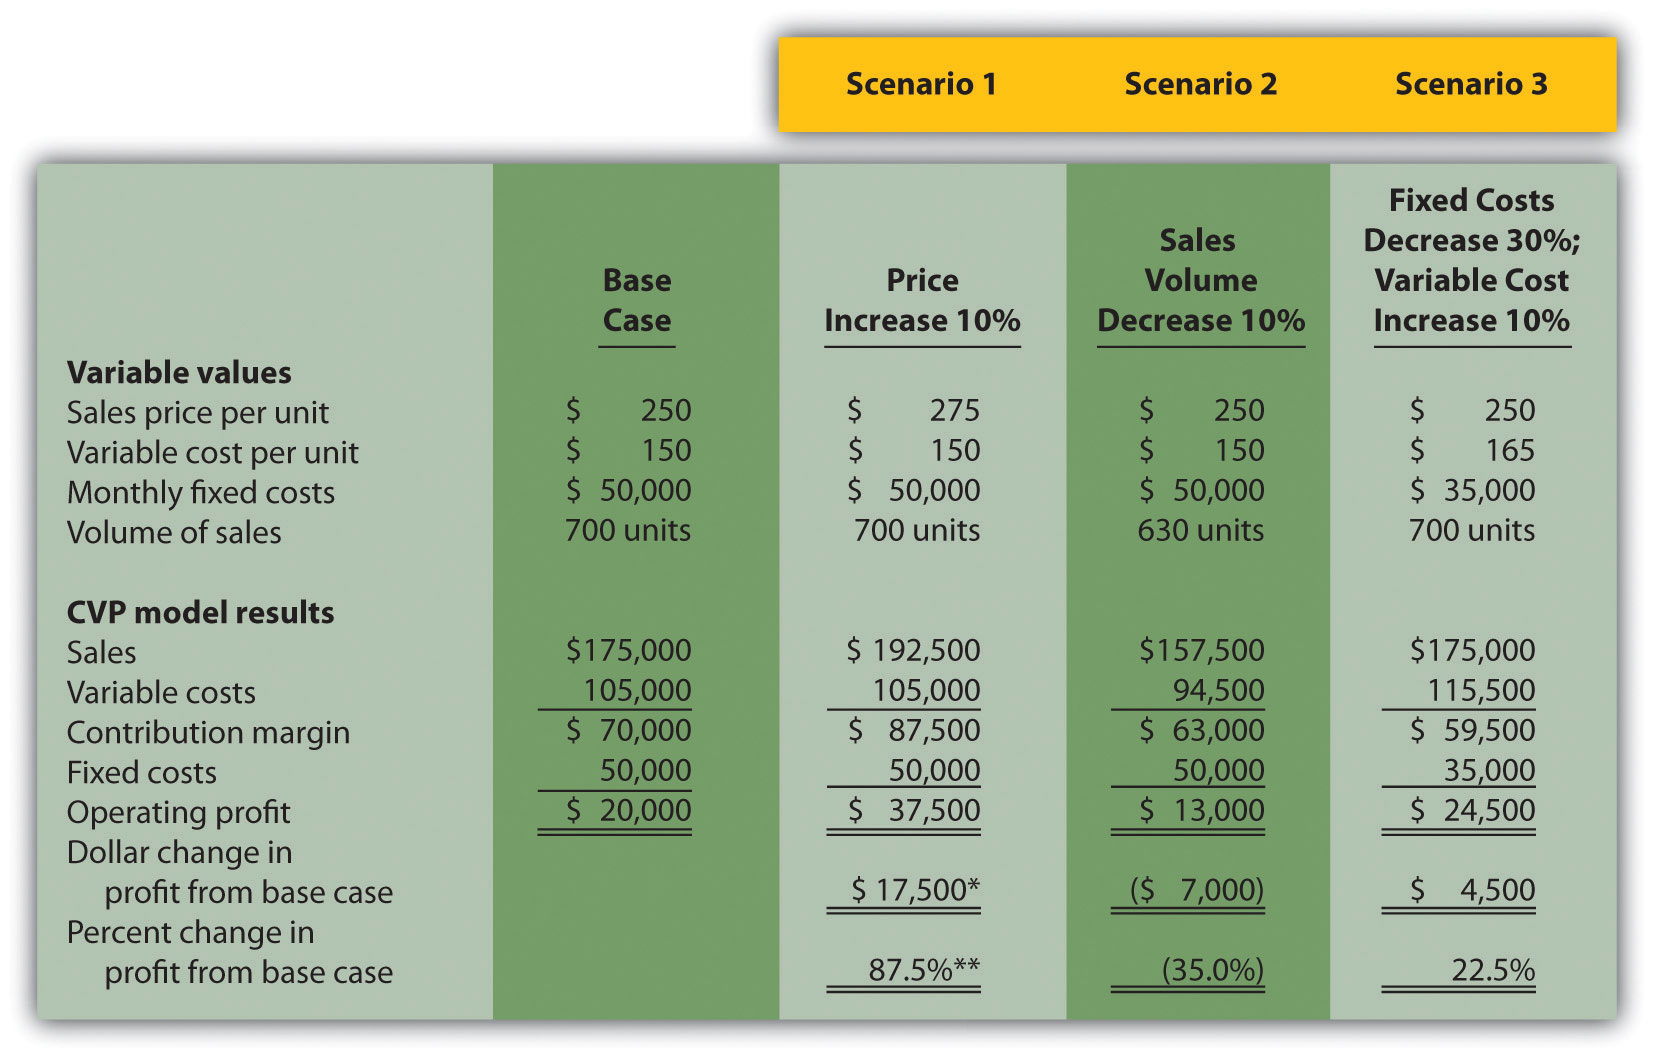
a $17,500 = $37,500 − $20,000.
b 87.5 percent = $17,500 ÷ $20,000.
Carefully review Figure 6.6 "Sensitivity Analysis for Snowboard Company". The column labeled Scenario 1 shows that increasing the price by 10 percent will increase profit 87.5 percent ($17,500). Thus profit is highly sensitive to changes in sales price. Another way to look at this is that for every one percent increase in sales price, profit will increase by 8.75 percent, or for every one percent decrease in sales price, profit will decrease by 8.75 percent.
The column labeled Scenario 2 shows that decreasing sales volume 10 percent will decrease profit 35 percent ($7,000). Thus profit is also highly sensitive to changes in sales volume. Stated another way, every one percent decrease in sales volume will decrease profit by 3.5 percent; or every one percent increase in sales volume will increase profit by 3.5 percent.
When comparing Scenario 1 with Scenario 2, we see that Snowboard Company’s profit is more sensitive to changes in sales price than to changes in sales volume, although changes in either will significantly affect profit.
The column labeled Scenario 3 shows that decreasing fixed costs by 30 percent and increasing variable cost by 10 percent will increase profit 22.5 percent ($4,500). (Perhaps Snowboard Company is considering moving toward less automation and more direct labor!)
Computer Application
Using Excel to Perform Sensitivity Analysis
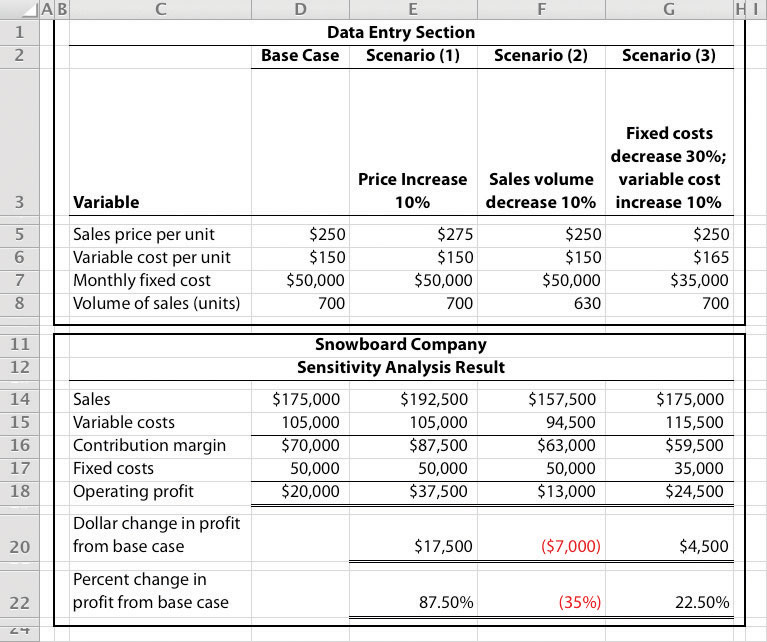
The accountants at Snowboard Company would likely use a spreadsheet program, such as Excel, to develop a CVP model for the sensitivity analysis shown in Figure 6.6 "Sensitivity Analysis for Snowboard Company". An example of how to use Excel to prepare the CVP model shown in Figure 6.6 "Sensitivity Analysis for Snowboard Company" is presented as follows. Notice that the basic data are entered at the top of the spreadsheet (data entry section), and the rest of the information is driven by formulas. This allows for quick sensitivity analysis of different scenarios.
Using the base case as an example, sales of $175,000 (cell D14) are calculated by multiplying the $250 sales price per unit (cell D5) by 700 units (cell D8). Variable costs of $105,000 (cell D15) are calculated by multiplying the $150 variable cost per unit (cell D6) by 700 units (cell D8). Fixed costs of $50,000 come from the top section (cell D7). The contribution margin of $70,000 is calculated by subtracting variable costs from sales, and profit of $20,000 is calculated by subtracting fixed costs from the contribution margin.
Expanding the Use of Sensitivity Analysis
Question: Although the focus of sensitivity analysis is typically on how changes in variables will affect profit (as shown in Figure 6.6 "Sensitivity Analysis for Snowboard Company"), accountants also use sensitivity analysis to determine the impact of changes in variables on the break-even point and target profit. How is sensitivity analysis used to evaluate the impact changes in variables will have on break-even and target profit points?
Answer: Let’s look at an example for Snowboard Company. Assume the company is able to charge $275 per unit, instead of $250 per unit. How many units must Snowboard Company sell to break even? The following calculation is based on the shortcut formula presented earlier in the chapter:
Thus if the sales price per unit increases from $250 to $275, the break-even point decreases from 500 units (calculated earlier) to 400 units, which is a decrease of 100 units.
How would this same increase in sales price change the required number of units sold to achieve a profit of $30,000? We apply the same shortcut formula:
Thus if the sales price per unit increases from $250 to $275, the number of units sold to achieve a profit of $30,000 decreases from 800 units (calculated earlier) to 640 units, which is a decrease of 160 units.
Business in Action 6.2
Performing Sensitivity Analysis for a Brewpub
Three entrepreneurs in California were looking for investors and banks to finance a new brewpub. Brewpubs focus on two segments: food from the restaurant segment, and freshly brewed beer from the beer production segment. All parties involved in the process of raising money—potential investors and banks, as well as the three entrepreneurs (i.e., the owners)—wanted to know what the new business’s projected profits would be. After months of research, the owners created a financial model that provided this information. Projected profits were slightly more than $300,000 for the first year (from sales of $1.95 million) and were expected to increase in each of the next four years.
One of the owners asked, “What if our projected revenues are too high? What will happen to profits if sales are lower than we expect? After all, we will have debt of well over $1 million, and I don’t want anyone coming after my personal assets if the business doesn’t have the money to pay!” Although all three owners felt the financial model was reasonably accurate, they decided to find the break-even point and the resulting margin of safety.
Because a brewpub does not sell “units” of a specific product, the owners found the break-even point in sales dollars. The owners knew the contribution margin ratio and all fixed costs from the financial model. With this information, they were able to calculate the break-even point and margin of safety. The worried owner was relieved to discover that sales could drop over 35 percent from initial projections before the brewpub incurred an operating loss.
Key Takeaway
- Sensitivity analysis shows how the cost-volume-profit model will change with changes in any of its variables. Although the focus is typically on how changes in variables affect profit, accountants often analyze the impact on the break-even point and target profit as well.
Review Problem 6.4
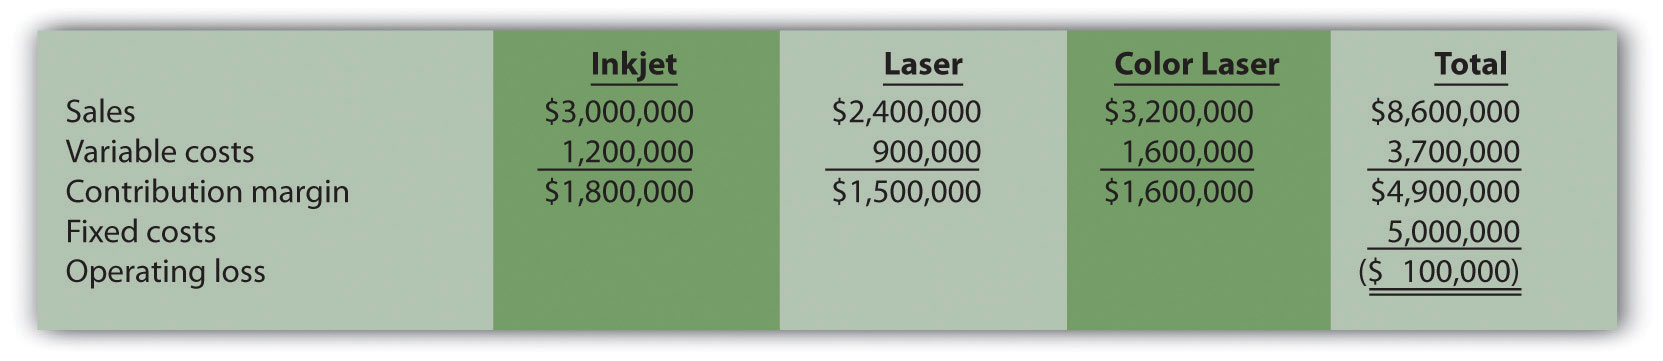
This problem is an extension of Note 6.28 "Review Problem 6.2". Recall that International Printer Machines (IPM) builds three computer printer models: Inkjet, Laser, and Color Laser. Base case information for these three products is as follows:
| Inkjet | Laser | Color Laser | Total | |
| Selling price per unit | $250 | $400 | $1,600 | |
| Variable cost per unit | $100 | $150 | $ 800 | |
| Expected unit sales (annual) | 12,000 | 6,000 | 2,000 | 20,000 |
| Sales mix | 60 percent | 30 percent | 10 percent | 100 percent |
Total annual fixed costs are $5,000,000. Assume that each scenario that follows is independent of the others. Unless stated otherwise, the variables are the same as in the base case.
- Prepare a contribution margin income statement for the base case. Use the format shown in Figure 6.5 "Income Statement for Amy’s Accounting Service".
- How will total profit change if the Laser sales price increases by 10 percent? (Hint: Use the format shown in Figure 6.5 "Income Statement for Amy’s Accounting Service", and compare your result with requirement 1.)
- How will total profit change if the Inkjet sales volume decreases by 4,000 units and the sales volume of other products remains the same?
- How will total profit change if fixed costs decrease by 20 percent?
Solution to Review Problem 6.4
-
Base Case:
-
Laser sales price increases 10 percent:

Total profit would increase $240,000 (from loss of $100,000 in base case to profit of $140,000 in this scenario).
-
Inkjet sales volume decreases 4,000 units:
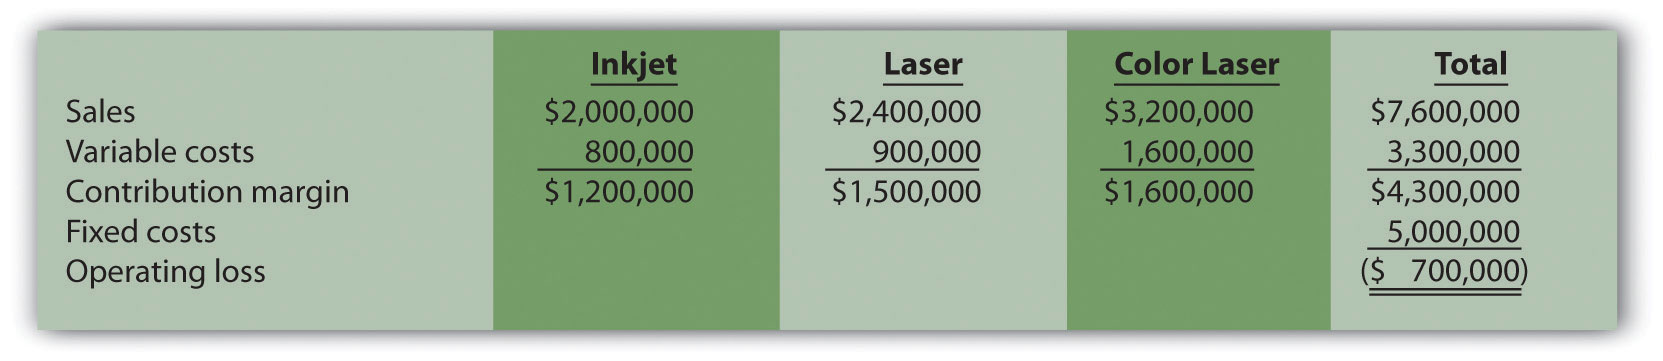
Total profit would decrease $600,000 (from loss of $100,000 in base case to loss of $700,000 in this scenario).
-
Fixed costs decrease 20 percent:
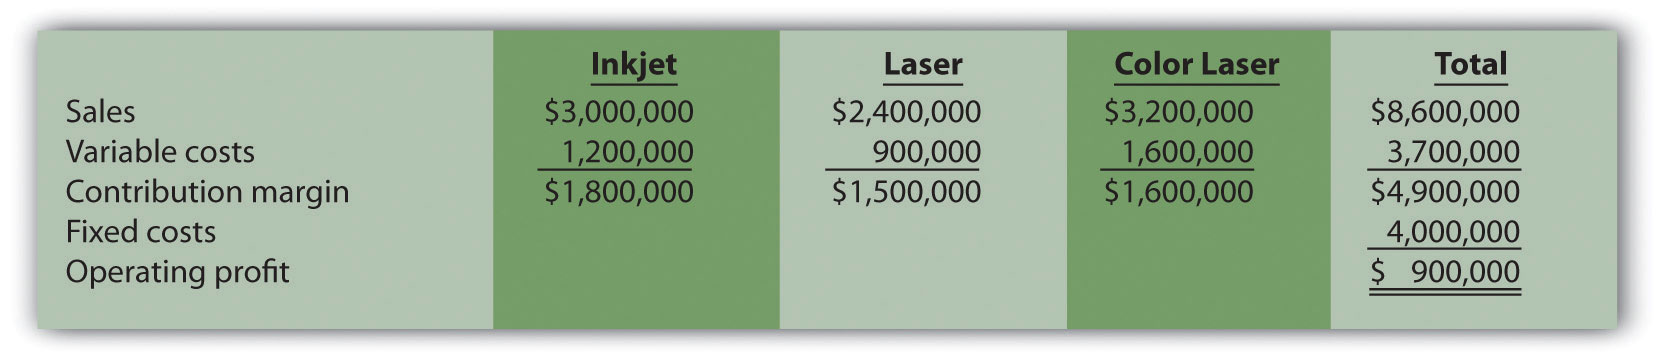
Total profit would increase $1,000,000 (from loss of $100,000 in base case to profit of $900,000 in this scenario).