This is “Preparing a Production Cost Report”, section 4.5 from the book Accounting for Managers (v. 1.0). For details on it (including licensing), click here.
For more information on the source of this book, or why it is available for free, please see the project's home page. You can browse or download additional books there. To download a .zip file containing this book to use offline, simply click here.
4.5 Preparing a Production Cost Report
Learning Objective
- Prepare a production cost report for a processing department.
Question: The results of the four key steps are typically presented in a production cost report. The production cost reportA report that summarizes the production and cost activity within a department for a reporting period. summarizes the production and cost activity within a department for a reporting period. It is simply a formal summary of the four steps performed to assign costs to units transferred out and units in ending work-in-process (WIP) inventory. What does the production cost report look like for the Assembly department at Desk Products, Inc.?
Answer: The production cost report for the month of May for the Assembly department appears in Figure 4.9 "Production Cost Report for Desk Products’ Assembly Department". Notice that each section of this report corresponds with one of the four steps described earlier. We provide references to the following illustrations so you can review the detail supporting calculations.
Figure 4.9 Production Cost Report for Desk Products’ Assembly Department
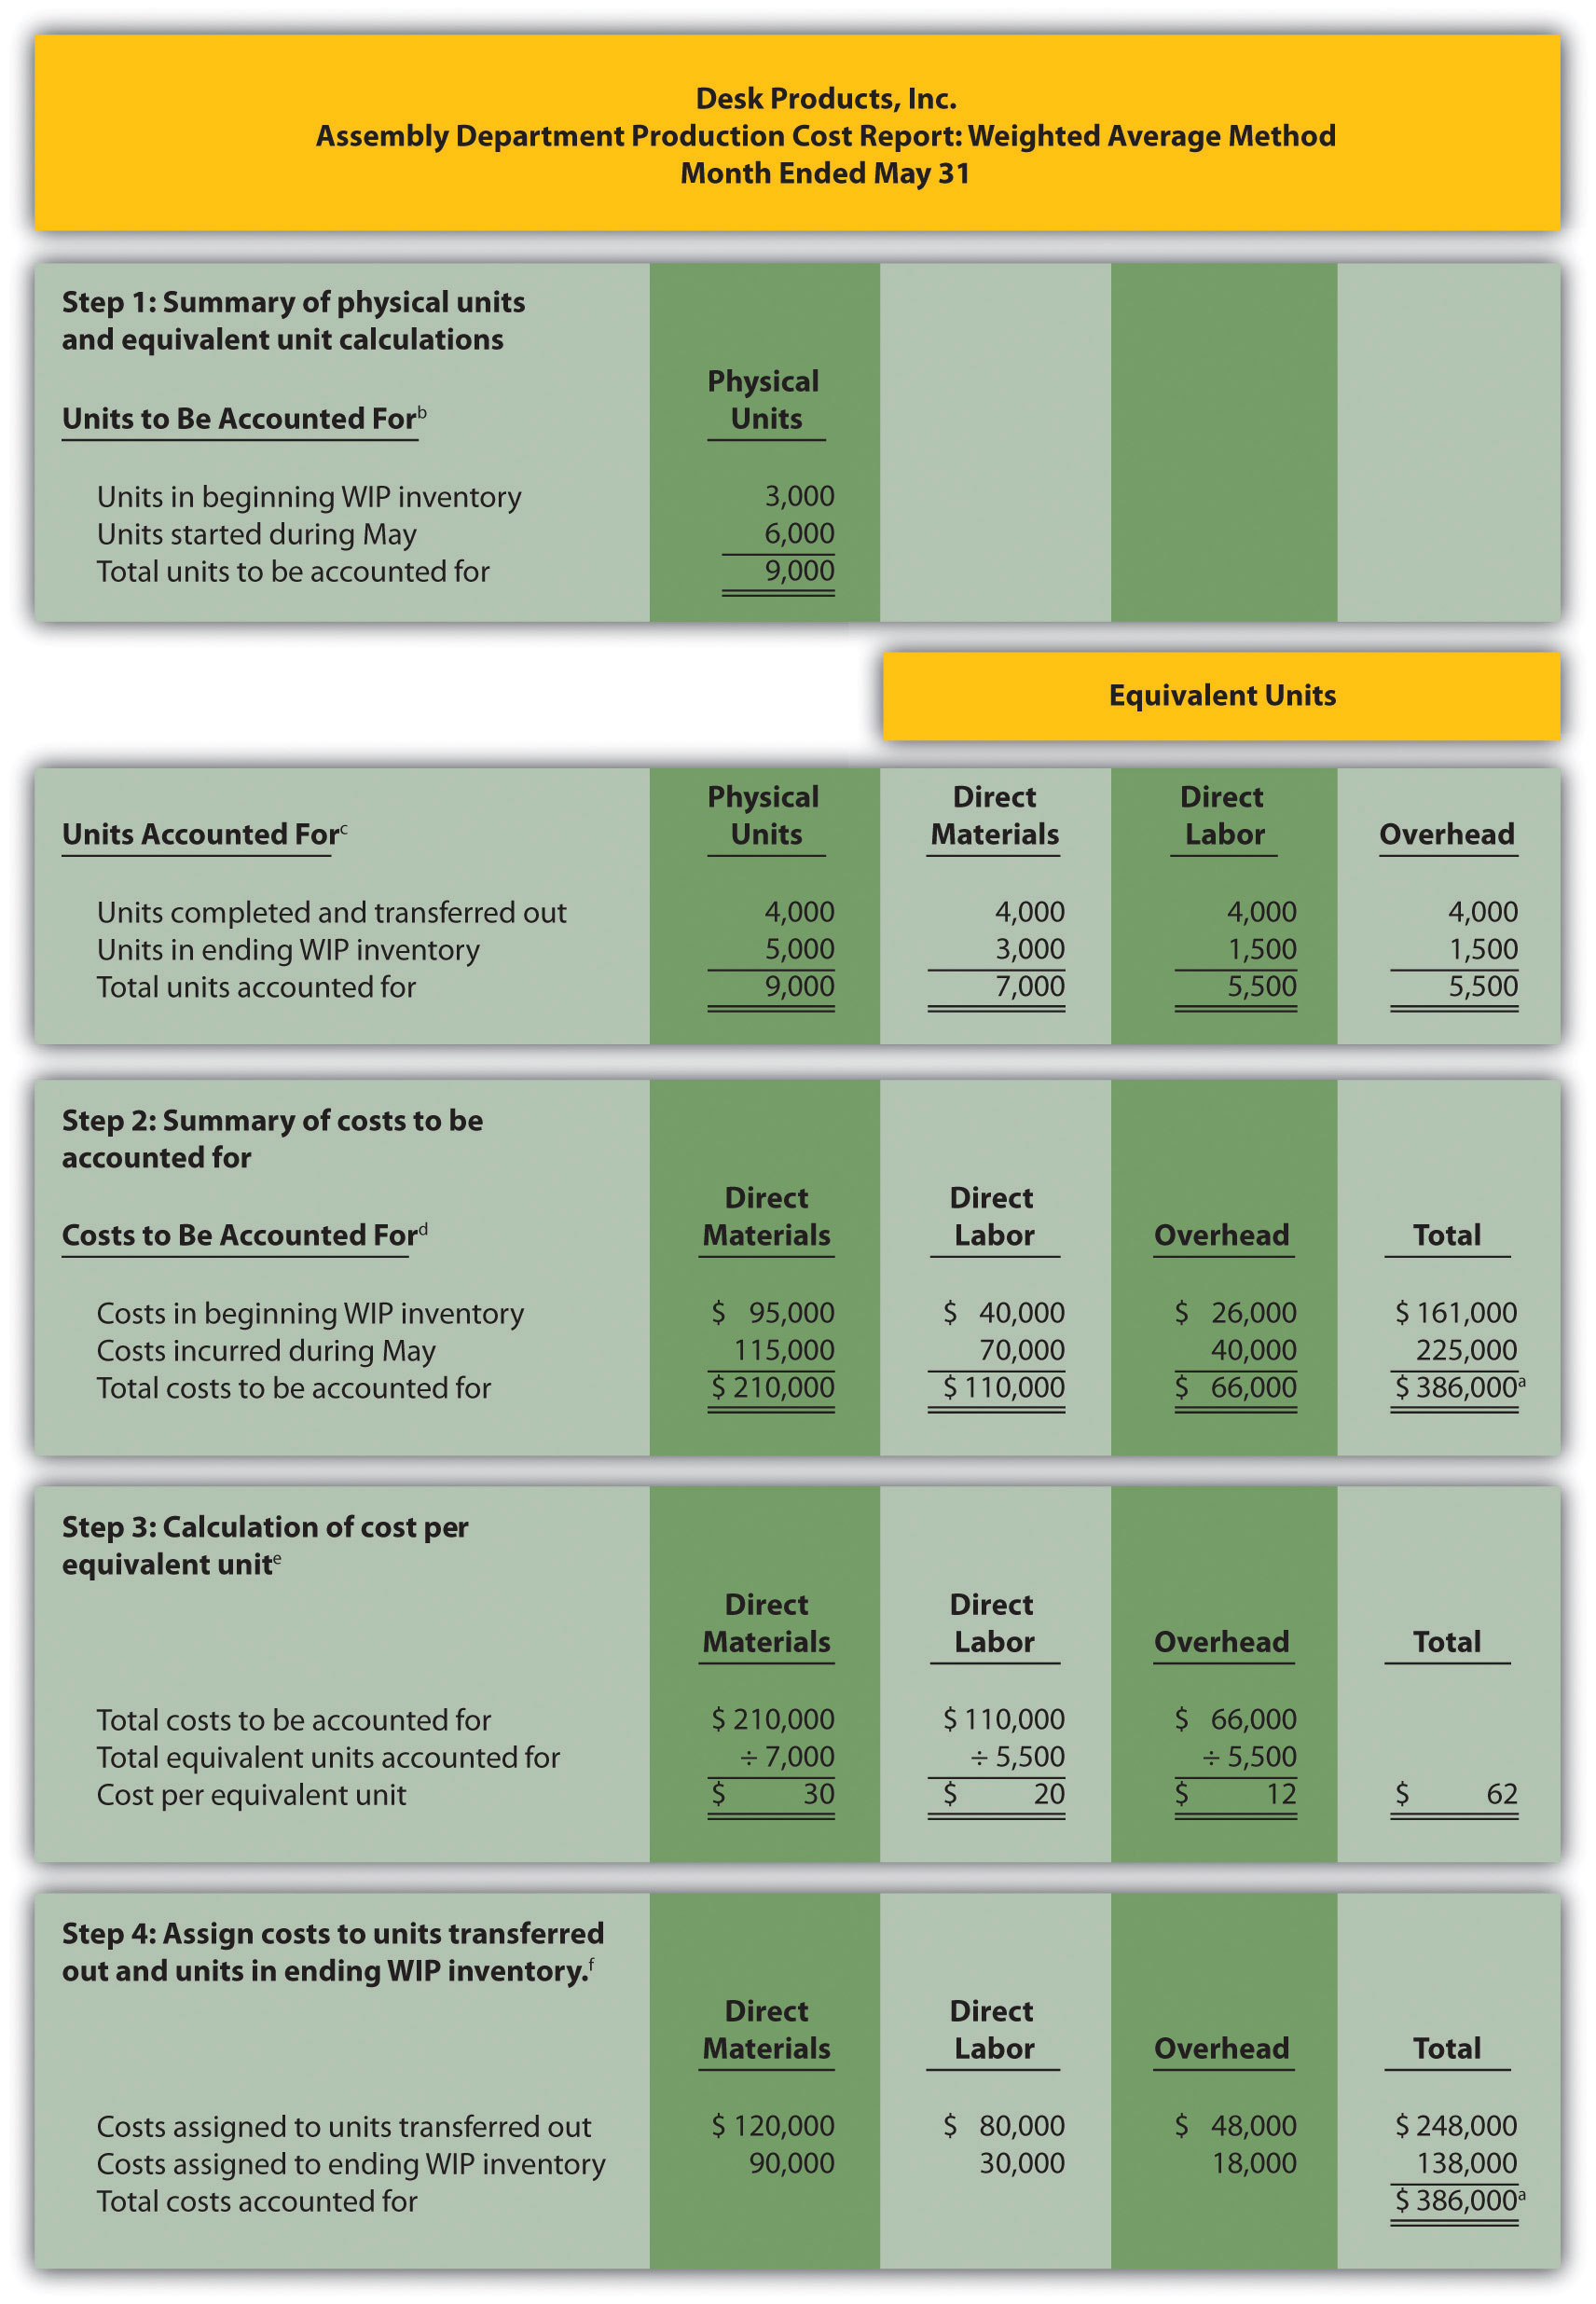
a Total costs to be accounted for (step 2) must equal total costs accounted for (step 4).
b Data are given.
c This section comes from Figure 4.4 "Flow of Units and Equivalent Unit Calculations for Desk Products’ Assembly Department".
d This section comes from Figure 4.5 "Summary of Costs to Be Accounted for in Desk Products’ Assembly Department".
e This section comes from Figure 4.6 "Calculation of the Cost per Equivalent Unit for Desk Products’ Assembly Department".
f This section comes from Figure 4.7 "Assigning Costs to Products in Desk Products’ Assembly Department".
How Do Managers Use Production Cost Report Information?
Question: Although the production cost report provides information needed to transfer costs from one account to another, managers also use this report for decision-making purposes. What important questions can be answered using the production cost report?
Answer: A production cost report helps managers answer several important questions:
- How much does it cost to produce each unit of product for each department?
- Which production cost is the highest—direct materials, direct labor, or overhead?
- Where are we having difficulties in the production process? In any particular departments?
- Are we seeing any significant changes in unit costs for direct materials, direct labor, or overhead? If so, why?
- How many units flow through each processing department each month?
- Are improvements in the production process being reflected in the cost per unit from one month to the next?
Beware of Fixed Costs
Question: Why might the per unit cost data provided in the production cost report be misleading?
Answer: When using information from the production cost report, managers must be careful not to assume that all production costs are variable costs. The CEO of Desk Products, Inc., Ann Watkins, was told that the Assembly department cost for each desk totaled $62 for the month of May (from Figure 4.9 "Production Cost Report for Desk Products’ Assembly Department", step 3). However, if the company produces more or fewer units than were produced in May, the unit cost will change. This is because the $62 unit cost includes both variable and fixed costs (see Chapter 5 "How Do Organizations Identify Cost Behavior Patterns?" for a detailed discussion of fixed and variable costs).
Assume direct materials and direct labor are variable costs. In the Assembly department, the variable costs per unit associated with direct materials and direct labor of $50 (= $30 direct materials + $20 direct labor) will remain the same regardless of the level of production, within the relevant range. However, the remaining unit product cost of $12 associated with overhead must be analyzed further to determine the amount that is variable (e.g., indirect materials) and the amount that is fixed (e.g., factory rent). Managers must understand that fixed costs per unit will change depending on the level of production. More specifically, Ann Watkins must understand that the $62 unit cost in the Assembly department provided in the production cost report will change depending on the level of production. Chapter 5 "How Do Organizations Identify Cost Behavior Patterns?" provides a detailed presentation of how cost information can be separated into fixed and variable components for the purpose of providing managers with more useful information.
Key Takeaway
- The four key steps of assigning costs to units transferred out and units in ending WIP inventory are formally presented in a production cost report. The production cost report summarizes the production and cost activity within a processing department for a reporting period. A separate report is prepared for each processing department. Rounding the cost per equivalent unit to the nearest thousandth will minimize rounding differences when reconciling costs to be accounted for in step 2 with costs accounted for in step 4.
Computer Application
Using Excel to Prepare a Production Cost Report
Managers typically use computer software to prepare production cost reports. They do so for several reasons:
- Once the format is established, the template can be used from one period to the next.
- Formulas underlie all calculations, thereby minimizing the potential for math errors and speeding up the process.
- Changes can be made easily without having to redo the entire report.
- Reports can be easily combined to provide a side-by-side analysis from one period to the next.
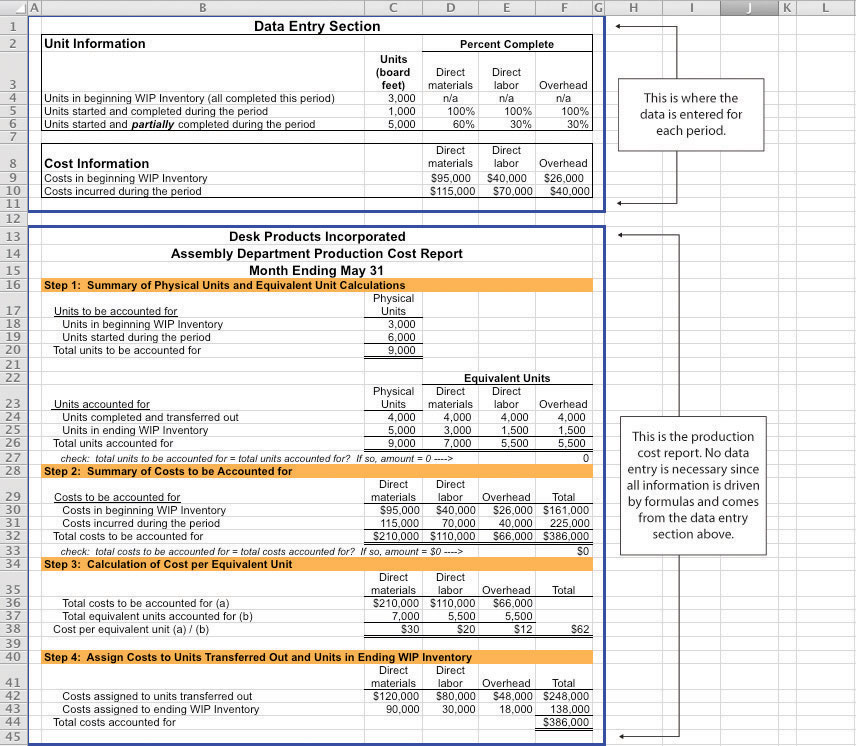
Review Figure 4.9 "Production Cost Report for Desk Products’ Assembly Department" and then ask yourself: “How can I use Excel to help prepare this report?” Answers will vary widely depending on your experience with Excel. However, Excel has a few basic features that can make the job of creating a production cost report easier. For example, you can use formulas to sum numbers in a column (note that each of the four steps presented in Figure 4.9 "Production Cost Report for Desk Products’ Assembly Department" has column totals) and to calculate the cost per equivalent unit. Also you can establish a separate line to double-check that
- the units to be accounted for match the units accounted for; and
- the total costs to be accounted for match the total costs accounted for.
For those who want to add more complex features, the basic data (e.g., the data in Table 4.2 "Production Information for Desk Products’ Assembly Department") can be entered at the top of the spreadsheet and pulled down to the production cost report where necessary.
An example of how to use Excel to prepare a production cost report follows. Notice that the basic data are at the top of the spreadsheet, and the rest of the report is driven by formulas. Each month, the data at the top are changed to reflect the current month’s activity, and the production cost report takes care of itself.
Review Problem 4.5
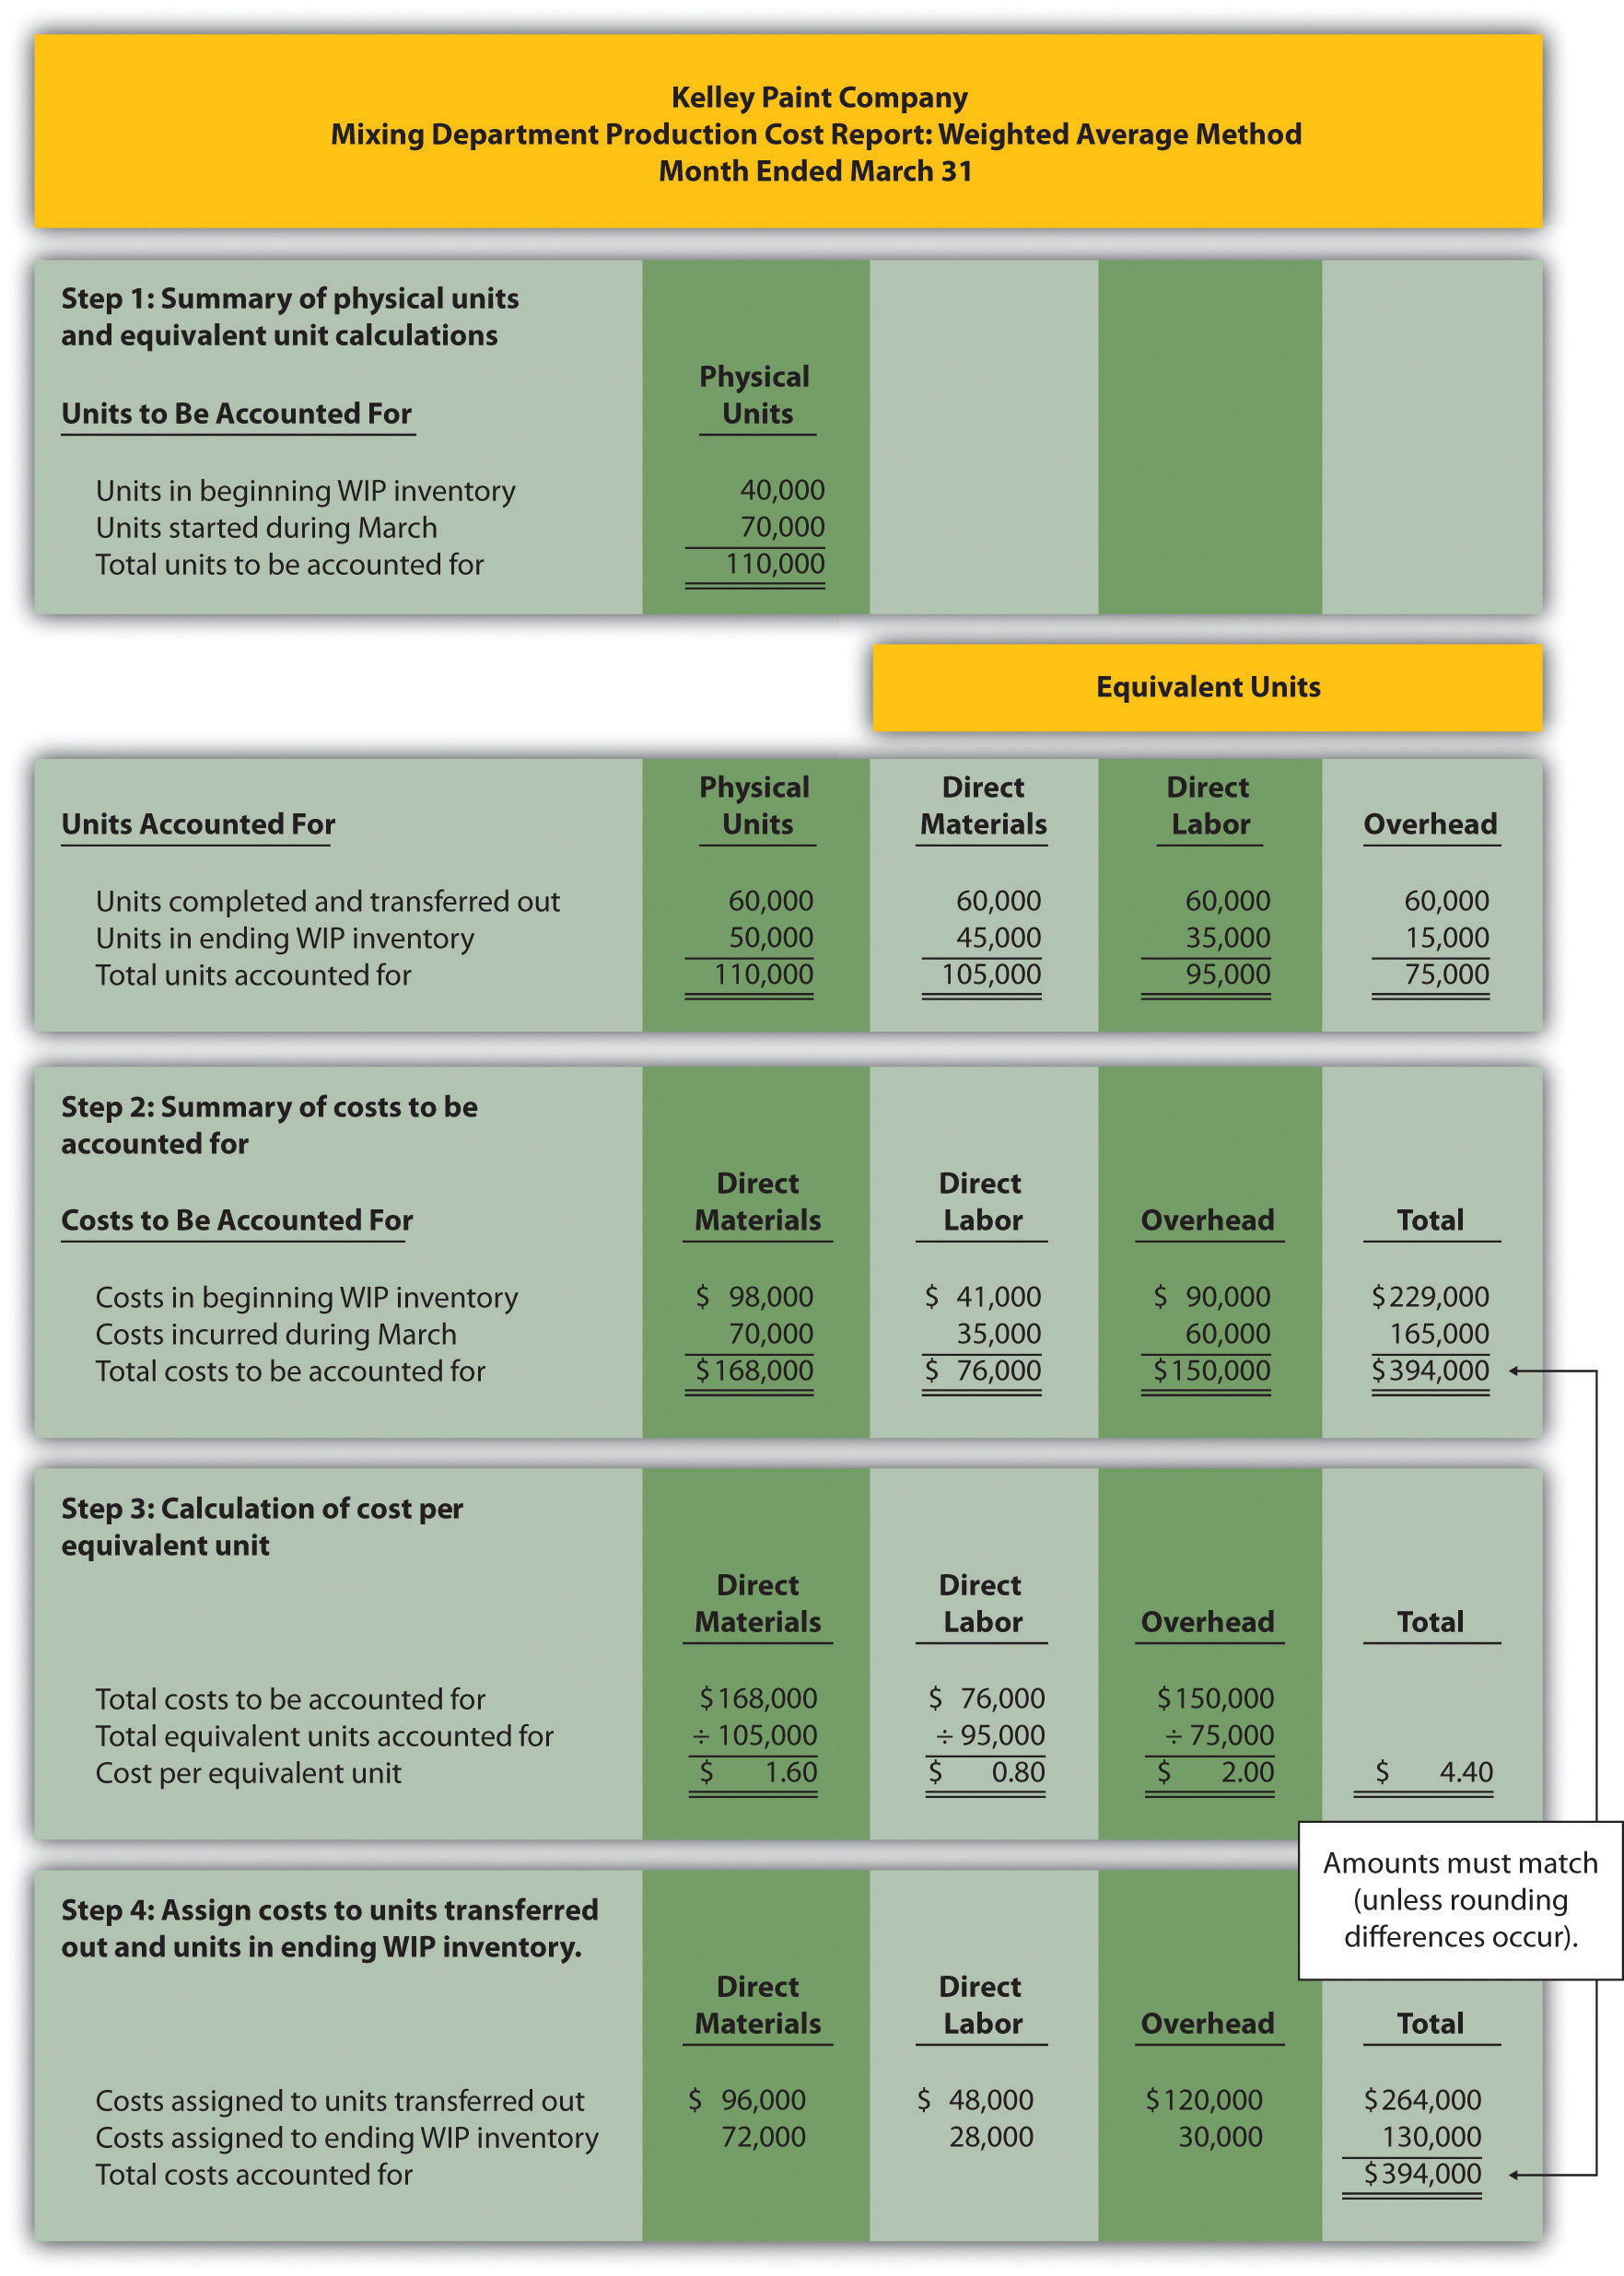
Using the information in Note 4.24 "Review Problem 4.4", prepare a production cost report for the Mixing department of Kelley Paint Company for the month ended March 31. (Hint: You have already completed the four key steps in Note 4.24 "Review Problem 4.4". Simply summarize the information in a production cost report as shown in Figure 4.9 "Production Cost Report for Desk Products’ Assembly Department".)
Solution to Review Problem 4.5
(See solutions to Note 4.24 "Review Problem 4.4" for detailed calculations.)
End-of-Chapter Exercises
Questions
- Which types of companies use a process costing system to account for product costs? Provide at least three examples of products that would require the use of a process costing system.
- Describe the similarities between a process costing system and a job costing system.
- Describe the differences between a process costing system and a job costing system.
- Review Note 4.4 "Business in Action 4.1" What are the three stages of production at Coca-Cola, and what account is used to track production costs for each stage?
- What are transferred-in costs?
- Review Note 4.9 "Business in Action 4.2" Why is it likely that Wrigley uses a process costing system rather than a job costing system?
- Explain the difference between physical units and equivalent units.
- Explain the concept of equivalent units assuming the weighted average method is used.
- Explain why direct materials, direct labor, and overhead might be at different stages of completion at the end of a reporting period.
- Review Note 4.14 "Business in Action 4.3" Why do colleges convert the actual number of students attending school to a full-time equivalent number of students?
- Describe the four key steps shown in a production cost report assuming the weighted average method is used.
- What two important amounts are determined in step 4 of the production cost report?
- Describe the basic cost flow equation and explain how it is used to reconcile units to be accounted for with units accounted for.
- Describe the basic cost flow equation and explain how it is used to reconcile costs to be accounted for with costs accounted for.
- Review Note 4.22 "Business in Action 4.4" Describe the last two stages of the production process at Hershey.
- How does a company determine the number of production cost reports to be prepared for each reporting period?
- What is a production cost report, and how is it used by management?
- Explain how the cost per equivalent unit might be misleading to managers, particularly when a significant change in production is anticipated.
Brief Exercises
-
Product Costing at Desk Products, Inc. Refer to the dialogue presented at the beginning of the chapter.
Required:
- Why was the owner of Desk Products, Inc., concerned about the Assembly department product cost of each desk?
- What did the accountant, John Fuller, promise by the end of the week?
-
Job Costing Versus Process Costing. For each firm listed in the following, identify whether it would use job costing or process costing.
- Chewing gum manufacturer
- Custom automobile restorer
- Facial tissue manufacturer
- Accounting services provider
- Electrical services provider
- Pool builder
- Cereal producer
- Architectural design provider
-
Process Costing Journal Entries. Assume a company has two processing departments—Molding and Packaging. Transactions for the month are shown as follows.
- The Molding department requisitioned direct materials totaling $2,000 to be used in production.
- Direct labor costs totaling $3,500 were incurred in the Molding department, to be paid the next month.
- Manufacturing overhead costs applied to products in the Molding department totaled $2,500.
- The cost of goods transferred from the Molding department to the Packaging department totaled $10,000.
- Manufacturing overhead costs applied to products in the Packaging department totaled $1,800.
Required:
Prepare journal entries to record transactions 1 through 5.
-
Calculating Equivalent Units. Complete the requirements for each item in the following.
- A university has 500 students enrolled in classes. Each student attends school on a part-time basis. On average, each student takes three-quarters of a full load of classes. Calculate the number of full-time equivalent students (i.e., calculate the number of equivalent units).
- A total of 10,000 units of product remain in the Assembly department at the end of the year. Direct materials are 80 percent complete and direct labor is 40 percent complete. Calculate the equivalent units in the Assembly department for direct materials and direct labor.
- A local hospital has 60 nurses working on a part-time basis. On average, each nurse works two-thirds of a full load. Calculate the number of full-time equivalent nurses (i.e., calculate the number of equivalent units).
- A total of 6,000 units of product remain in the Quality Testing department at the end of the year. Direct materials are 75 percent complete and direct labor is 20 percent complete. Calculate the equivalent units in the Quality Testing department for direct materials and direct labor.
-
Calculating Cost per Equivalent Unit. The following information pertains to the Finishing department for the month of June.
Direct Materials Direct Labor Overhead Total costs to be accounted for $100,000 $200,000 $300,000 Total equivalent units accounted for 10,000 units 8,000 units 8,000 units Required:
Calculate the cost per equivalent unit for direct materials, direct labor, overhead, and in total. Show your calculations.
-
Assigning Costs to Completed Units and to Units in Ending WIP Inventory. The following information is for the Painting department for the month of January.
Direct Materials Direct Labor Overhead Cost per equivalent unit $2.10 $1.50 $3.80 Equivalent units completed and transferred out 3,000 units 3,000 units 3,000 units Equivalent units in ending WIP inventory 1,000 units 1,200 units 1,200 units Required:
- Calculate the costs assigned to units completed and transferred out of the Painting department for direct materials, direct labor, overhead, and in total.
- Calculate the costs assigned to ending WIP inventory for the Painting department for direct materials, direct labor, overhead, and in total.
Exercises: Set A
-
Assigning Costs to Products: Weighted Average Method. Sydney, Inc., uses the weighted average method for its process costing system. The Assembly department at Sydney, Inc., began April with 6,000 units in work-in-process inventory, all of which were completed and transferred out during April. An additional 8,000 units were started during the month, 3,000 of which were completed and transferred out during April. A total of 5,000 units remained in work-in-process inventory at the end of April and were at varying levels of completion, as shown in the following.
Direct materials 40 percent complete Direct labor 30 percent complete Overhead 50 percent complete The following cost information is for the Assembly department at Sydney, Inc., for the month of April.
Direct Materials Direct Labor Overhead Total Beginning WIP inventory $300,000 $350,000 $250,000 $900,000 Incurred during the month $180,000 $200,000 $170,000 $550,000 Required:
- Determine the units to be accounted for and units accounted for; then calculate the equivalent units for direct materials, direct labor, and overhead. (Hint: This requires performing step 1 of the four-step process.)
- Calculate the cost per equivalent unit for direct materials, direct labor, and overhead. (Hint: This requires performing step 2 and step 3 of the four-step process.)
- Assign costs to units transferred out and to units in ending WIP inventory. (Hint: This requires performing step 4 of the four-step process.)
- Confirm that total costs to be accounted for (from step 2) equals total costs accounted for (from step 4). Note that minor differences may occur due to rounding the cost per equivalent unit in step 3.
- Explain the meaning of equivalent units.
- Production Cost Report: Weighted Average Method. Refer to Exercise 25. Prepare a production cost report for Sydney, Inc., for the month of April using the format shown in Figure 4.9 "Production Cost Report for Desk Products’ Assembly Department".
-
Process Costing Journal Entries. Silva Piping Company produces PVC piping in two processing departments—Fabrication and Packaging. Transactions for the month of July are shown as follows.
- Direct materials totaling $15,000 are requisitioned and placed into production—$7,000 for the Fabrication department and $8,000 for the Packaging department.
-
Direct labor costs (wages payable) are incurred by each department as follows:
Fabrication $4,500 Packaging $6,700 -
Manufacturing overhead costs are applied to each department as follows:
Fabrication $20,000 Packaging $14,000 - Products with a cost of $22,000 are transferred from the Fabrication department to the Packaging department.
- Products with a cost of $35,000 are completed and transferred from the Packaging department to the finished goods warehouse.
-
Products with a cost of $31,000 are sold to customers.
Required:
- Prepare journal entries to record each of the previous transactions.
- In general, how does the process costing system used here differ from a job costing system?
Exercises: Set B
-
Assigning Costs to Products: Weighted Average Method. Varian Company uses the weighted average method for its process costing system. The Molding department at Varian began the month of January with 80,000 units in work-in-process inventory, all of which were completed and transferred out during January. An additional 90,000 units were started during the month, 30,000 of which were completed and transferred out during January. A total of 60,000 units remained in work-in-process inventory at the end of January and were at varying levels of completion, as shown in the following.
Direct materials 80 percent complete Direct labor 90 percent complete Overhead 90 percent complete The following cost information is for the Molding department at Varian Company for the month of January.
Direct Materials Direct Labor Overhead Total Beginning WIP inventory $1,400,000 $1,100,000 $1,700,000 $4,200,000 Incurred during the month $1,210,000 $ 980,000 $1,450,000 $3,640,000 Required:
- Determine the units to be accounted for and units accounted for; then calculate the equivalent units for direct materials, direct labor, and overhead. (Hint: This requires performing step 1 of the four-step process.)
- Calculate the cost per equivalent unit for direct materials, direct labor, and overhead. (Hint: This requires performing step 2 and step 3 of the four-step process.)
- Assign costs to units transferred out and to units in ending WIP inventory. (Hint: This requires performing step 4 of the four-step process.)
- Confirm that total costs to be accounted for (from step 2) equals total costs accounted for (from step 4). Note that minor differences may occur due to rounding the cost per equivalent unit in step 3.
- Explain the meaning of equivalent units.
- Production Cost Report: Weighted Average Method. Refer to Exercise 28. Prepare a production cost report for Varian Company for the month of January using the format shown in Figure 4.9 "Production Cost Report for Desk Products’ Assembly Department".
-
Process Costing Journal Entries. Westside Chemicals produces paint thinner in three processing departments—Mixing, Testing, and Packaging. Transactions for the month of September are shown as follows.
- Direct materials totaling $80,000 are requisitioned and placed into production—$60,000 for the Mixing department, $11,000 for the Testing department, and $9,000 for the Packaging department.
-
Direct labor costs (wages payable) incurred by each department are as follows:
Mixing $35,000 Testing $25,000 Packaging $18,000 -
Manufacturing overhead costs are applied to each department as follows:
Mixing $17,500 Testing $12,500 Packaging $ 6,000 - Products with a cost of $55,000 are transferred from the Mixing department to the Testing department.
- Products with a cost of $86,000 are transferred from the Testing department to the Packaging department.
- Products with a cost of $100,000 are completed and transferred from the Packaging department to the finished goods warehouse.
- Products with a cost of $81,000 are sold to customers.
Required:
- Prepare journal entries to record each of the previous transactions.
- In general, how does the process costing system used here differ from a job costing system?
Problems
-
Production Cost Report: Weighted Average Method. Calvin Chemical Company produces a chemical used in the production of silicon wafers. Calvin Chemical uses the weighted average method for its process costing system. The Mixing department at Calvin Chemical began the month of June with 5,000 units (gallons) in work-in-process inventory, all of which were completed and transferred out during June. An additional 15,000 units were started during the month, 11,000 of which were completed and transferred out during June. A total of 4,000 units remained in work-in-process inventory at the end of June and were at varying levels of completion, as shown in the following.
Direct materials 60 percent complete Direct labor 40 percent complete Overhead 40 percent complete The cost information is as follows:
Costs in beginning work-in-process inventory
Direct materials $8,000 Direct labor $3,000 Overhead $2,800 Costs incurred during the month
Direct materials $21,000 Direct labor $ 8,500 Overhead $ 7,200 Required:
- Prepare a production cost report for the Mixing department at Calvin Chemical Company for the month of June.
- Confirm that total costs to be accounted for (from step 2) equals total costs accounted for (from step 4). Note that minor differences may occur due to rounding the cost per equivalent unit in step 3.
- According to the production cost report, what is the total cost per equivalent unit for the work performed in the Mixing department? Which of the three product cost components is the highest, and what percent of the total does this product cost represent?
-
Production Cost Report: Weighted Average Method. Quality Confections Company manufactures chocolate bars in two processing departments, Mixing and Packaging, and uses the weighted average method for its process costing system. The table that follows shows information for the Mixing department for the month of March.
Unit Information (Measured in Pounds) Mixing Beginning work-in-process inventory 8,000 Started or transferred in during the month 230,000 Ending work-in-process inventory: 80 percent materials, 70 percent labor, and 60 percent overhead 6,000 Cost Information Beginning Work-in-Process Inventory Direct materials $ 3,000 Direct labor $ 1,500 Overhead $ 2,200 Costs Incurred during the Period Direct materials $103,000 Direct labor $ 55,000 Overhead $ 81,000 Required:
- Prepare a production cost report for the Mixing department for the month of March.
- Confirm that total costs to be accounted for (from step 2) equals total costs accounted for (from step 4); minor differences may occur due to rounding the cost per equivalent unit in step 3.
- According to the production cost report, what is the total cost per equivalent unit for the work performed in the Mixing department? Which of the three product cost components is the highest, and what percent of the total does this product cost represent?
-
Production Cost Report and Journal Entries: Weighted Average Method. Wood Products, Inc., manufactures plywood in two processing departments, Milling and Sanding, and uses the weighted average method for its process costing system. The table that follows shows information for the Milling department for the month of April.
Unit Information (Measured in Feet) Milling Beginning work-in-process inventory 24,000 Started or transferred in during the month 110,000 Ending work-in-process inventory: 80 percent materials, 70 percent labor, and 60 percent overhead 32,000 Cost Information Beginning Work-in-Process Inventory Direct materials $ 9,000 Direct labor $ 3,000 Overhead $ 3,200 Costs Incurred during the Period Direct materials $45,000 Direct labor $14,000 Overhead $16,000 Required:
- Prepare a production cost report for the Milling department for the month of April.
- Confirm that total costs to be accounted for (from step 2) equals total costs accounted for (from step 4); minor differences may occur due to rounding the cost per equivalent unit in step 3.
-
For the Milling department at Wood Products, Inc., prepare journal entries to record:
- The cost of direct materials placed into production during the month (from step 2).
- Direct labor costs incurred during the month but not yet paid (from step 2).
- The application of overhead costs during the month (from step 2).
- The transfer of costs from the Milling department to the Sanding department (from step 4).
One Step Further: Skill-Building Cases
-
Internet Project: Production Company Plant Tour. Using the Internet, find a company that provides a virtual tour of its production processes. Document your findings by completing the following requirements.
Required:
- Summarize each step in the production process.
- Which type of costing system (job or process) would you expect the company to use? Why?
-
Process Costing at Coca-Cola. Refer to Note 4.4 "Business in Action 4.1".
Required:
- What type of costing system does Coca-Cola use? Explain.
- What is the purpose of preparing a production cost report? What information results from preparing a production cost report for the mixing and blending department at Coca-Cola?
- Based on the information provided, what is the minimum number of production cost reports that Coca-Cola prepares each reporting period? Explain.
-
Process Costing at Wrigley. Refer to Note 4.9 "Business in Action 4.2".
Required:
- What type of costing system does Wrigley use? Explain.
- What is the purpose of preparing a production cost report? What information results from preparing a production cost report for Wrigley’s Packaging department?
- Based on the information provided, what is the minimum number of production cost reports that Wrigley prepares each reporting period? Explain.
-
Group Activity: Job or Process Costing? Form groups of two to four students. Each group should determine whether a process costing or job costing system is most likely used to calculate product costs for each item listed in the following and should be prepared to explain its answers.
- Jetliners produced by Boeing
- Gasoline produced by Shell Oil Company
- Audit of Intel by Ernst & Young
- Oreo cookies produced by Nabisco Brands, Inc.
- Frosted Mini-Wheats produced by Kellogg Co.
- Construction of suspension bridge in Puget Sound, Washington, by Bechtel Group, Inc.
- Aluminum foil produced by Alcoa, Inc.
- Potato chips produced by Frito-Lay, Inc.
Comprehensive Cases
-
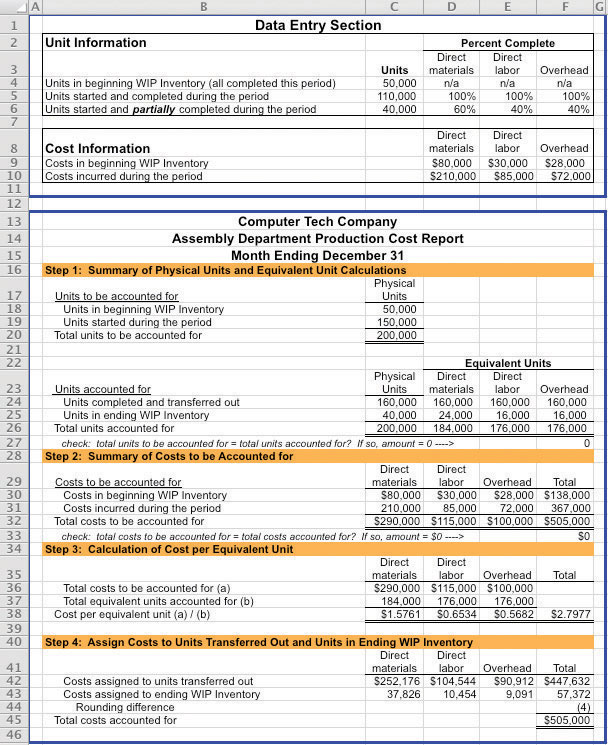
Ethics: Manipulating Percentage of Completion Estimates. Computer Tech Corporation produces computer keyboards, and its fiscal year ends on December 31. The weighted average method is used for the company’s process costing system. As the controller of Computer Tech, you present December’s production cost report for the Assembly department to the president of the company. The Assembly department is the last processing department before goods are transferred to finished goods inventory. All 160,000 units completed and transferred out during the month were sold by December 31.
The board of directors at Computer Tech established a compensation incentive plan that includes a substantial bonus for the president of the company if annual net income before taxes exceeds $2,000,000. Preliminary figures show current year net income before taxes totaling $1,970,000, which is short of the target by $30,000. The president approaches you and asks you to increase the percentage of completion for the 40,000 units in ending WIP inventory to 90 percent for direct materials and to 95 percent for direct labor and overhead. Even though you are confident in the percentages used to prepare the production cost report, which appears as follows, the president insists that his change is minor and will have little impact on how investors and creditors view the company.
Required:
- Why is the president asking you to increase the percentage of completion estimates?
- Prepare another production cost report for Computer Tech Company that includes the president’s revisions. Indicate what impact the president’s request will have on cost of goods sold and on net income (ignore income taxes in your calculations).
- As the controller of the company, how would you handle the president’s request? (If necessary, review the presentation of ethics in Chapter 1 "What Is Managerial Accounting?" for additional information.)
-
Ethics: Increasing Production to Boost Profits. Pacific Siding, Inc., produces synthetic wood siding used in the construction of residential and commercial buildings. Pacific Siding’s fiscal year ends on March 31, and the weighted average method is used for the company’s process costing system.
Financial results for the first 11 months of the current fiscal year (through February 28) are well below expectations of management, owners, and creditors. Halfway through the month of March, the chief executive officer and chief financial officer asked the controller to estimate the production results for the month of March in the form of a production cost report (the company only has one production department). This report is shown as follows.
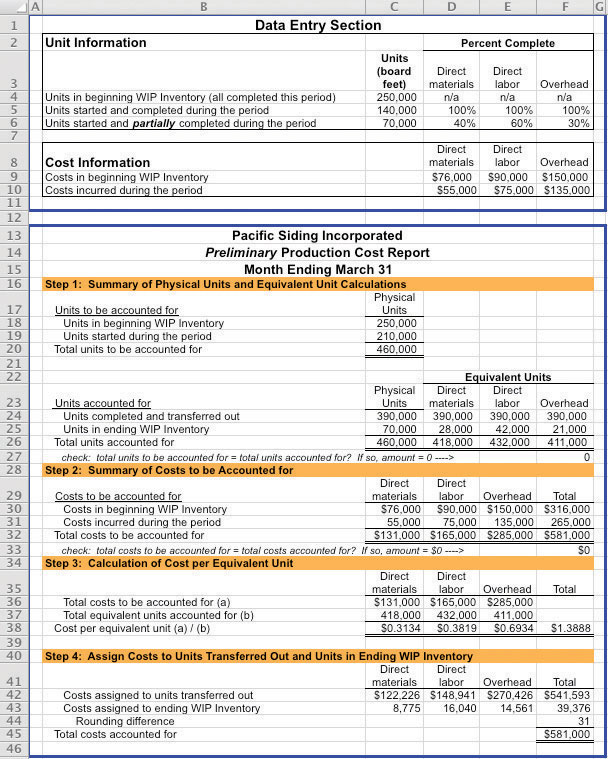
Armed with the preliminary production cost report for March, and knowing that the company’s production is well below capacity, the CEO and CFO decide to produce as many units as possible for the last half of March even though sales are not expected to increase any time soon. The production manager is told to push his employees to get as far as possible with production, thereby increasing the percentage of completion for ending WIP inventory. However, since the production process takes three weeks to complete, all the units produced in the last half of March will be in WIP inventory at the end of March.
Required:
- Explain how the CEO and CFO expect to increase profit (net income) for the year by boosting production at the end of March.
-
Using the following assumptions, prepare a revised estimate of production results in the form of a production cost report for the month of March.
Assumptions based on the CEO and CFO’s request to boost production
- Units started and partially completed during the period will increase to 225,000 (from the initial estimate of 70,000). This is the projected ending WIP inventory at March 31.
- Percentage of completion estimates for units in ending WIP inventory will increase to 80 percent for direct materials, 85 percent for direct labor, and 90 percent for overhead.
- Costs incurred during the period will increase to $95,000 for direct materials, $102,000 for direct labor, and $150,000 for overhead (most overhead costs are fixed).
- All units completed and transferred out during March are sold by March 31.
- Compare your new production cost report with the one prepared by the controller. How much do you expect profit to increase as a result of increasing production during the last half of March? (Ignore income taxes in your calculations.)
- Is the request made by the CEO and CFO ethical? Explain your answer.


