This is “Incorporating Images, Charts, and Graphs”, section 9.3 from the book Writers' Handbook (v. 1.0). For details on it (including licensing), click here.
For more information on the source of this book, or why it is available for free, please see the project's home page. You can browse or download additional books there. To download a .zip file containing this book to use offline, simply click here.


9.3 Incorporating Images, Charts, and Graphs
Learning Objectives
- Know how to insert images into a body of text.
- Understand the role of visual rhetoric in argument and other genres of communication.
- Be aware of standard guidelines for choosing images.
Charts and graphs have long been part of research papers. With the growth of computer capabilities that can capture the world visually, research papers today typically include more charts, graphs, and images than those produced in previous years.
Physically Placing Images into Text
When you insert an image into your text, you must make some physical decisions. One of the most common choices is to place the image to the right or left of your text.
Figure 9.6
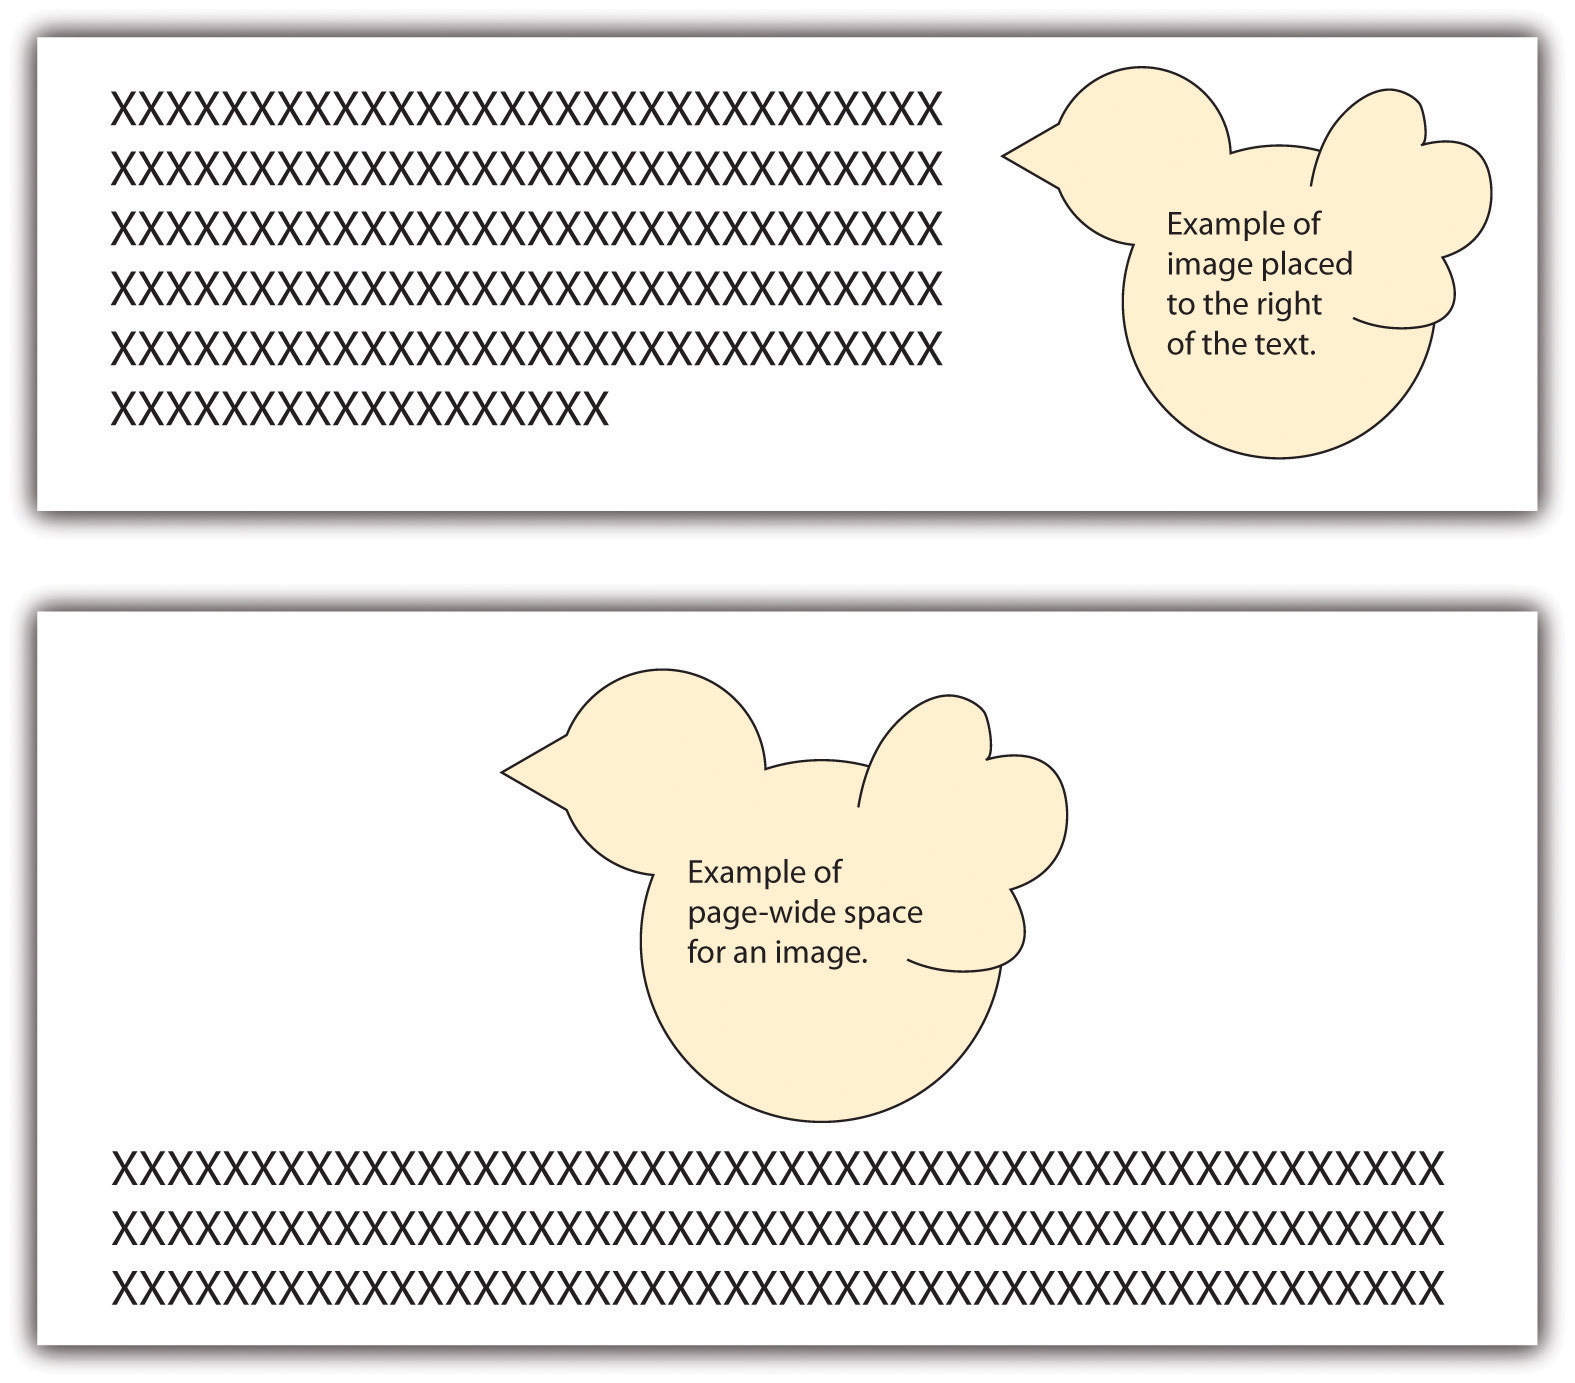
Another choice is to move the text down to create page-wide space for the image. In such situations, the image is typically placed above the related text. This format is usually used at the beginning of a document where the image treatment doesn’t break up the text.
Uses and Abuses of Visual Rhetoric
You should choose visuals to advance your argument rather than just to decorate your pages. Just as you would not include words that are fluff, you should not include meaningless images.
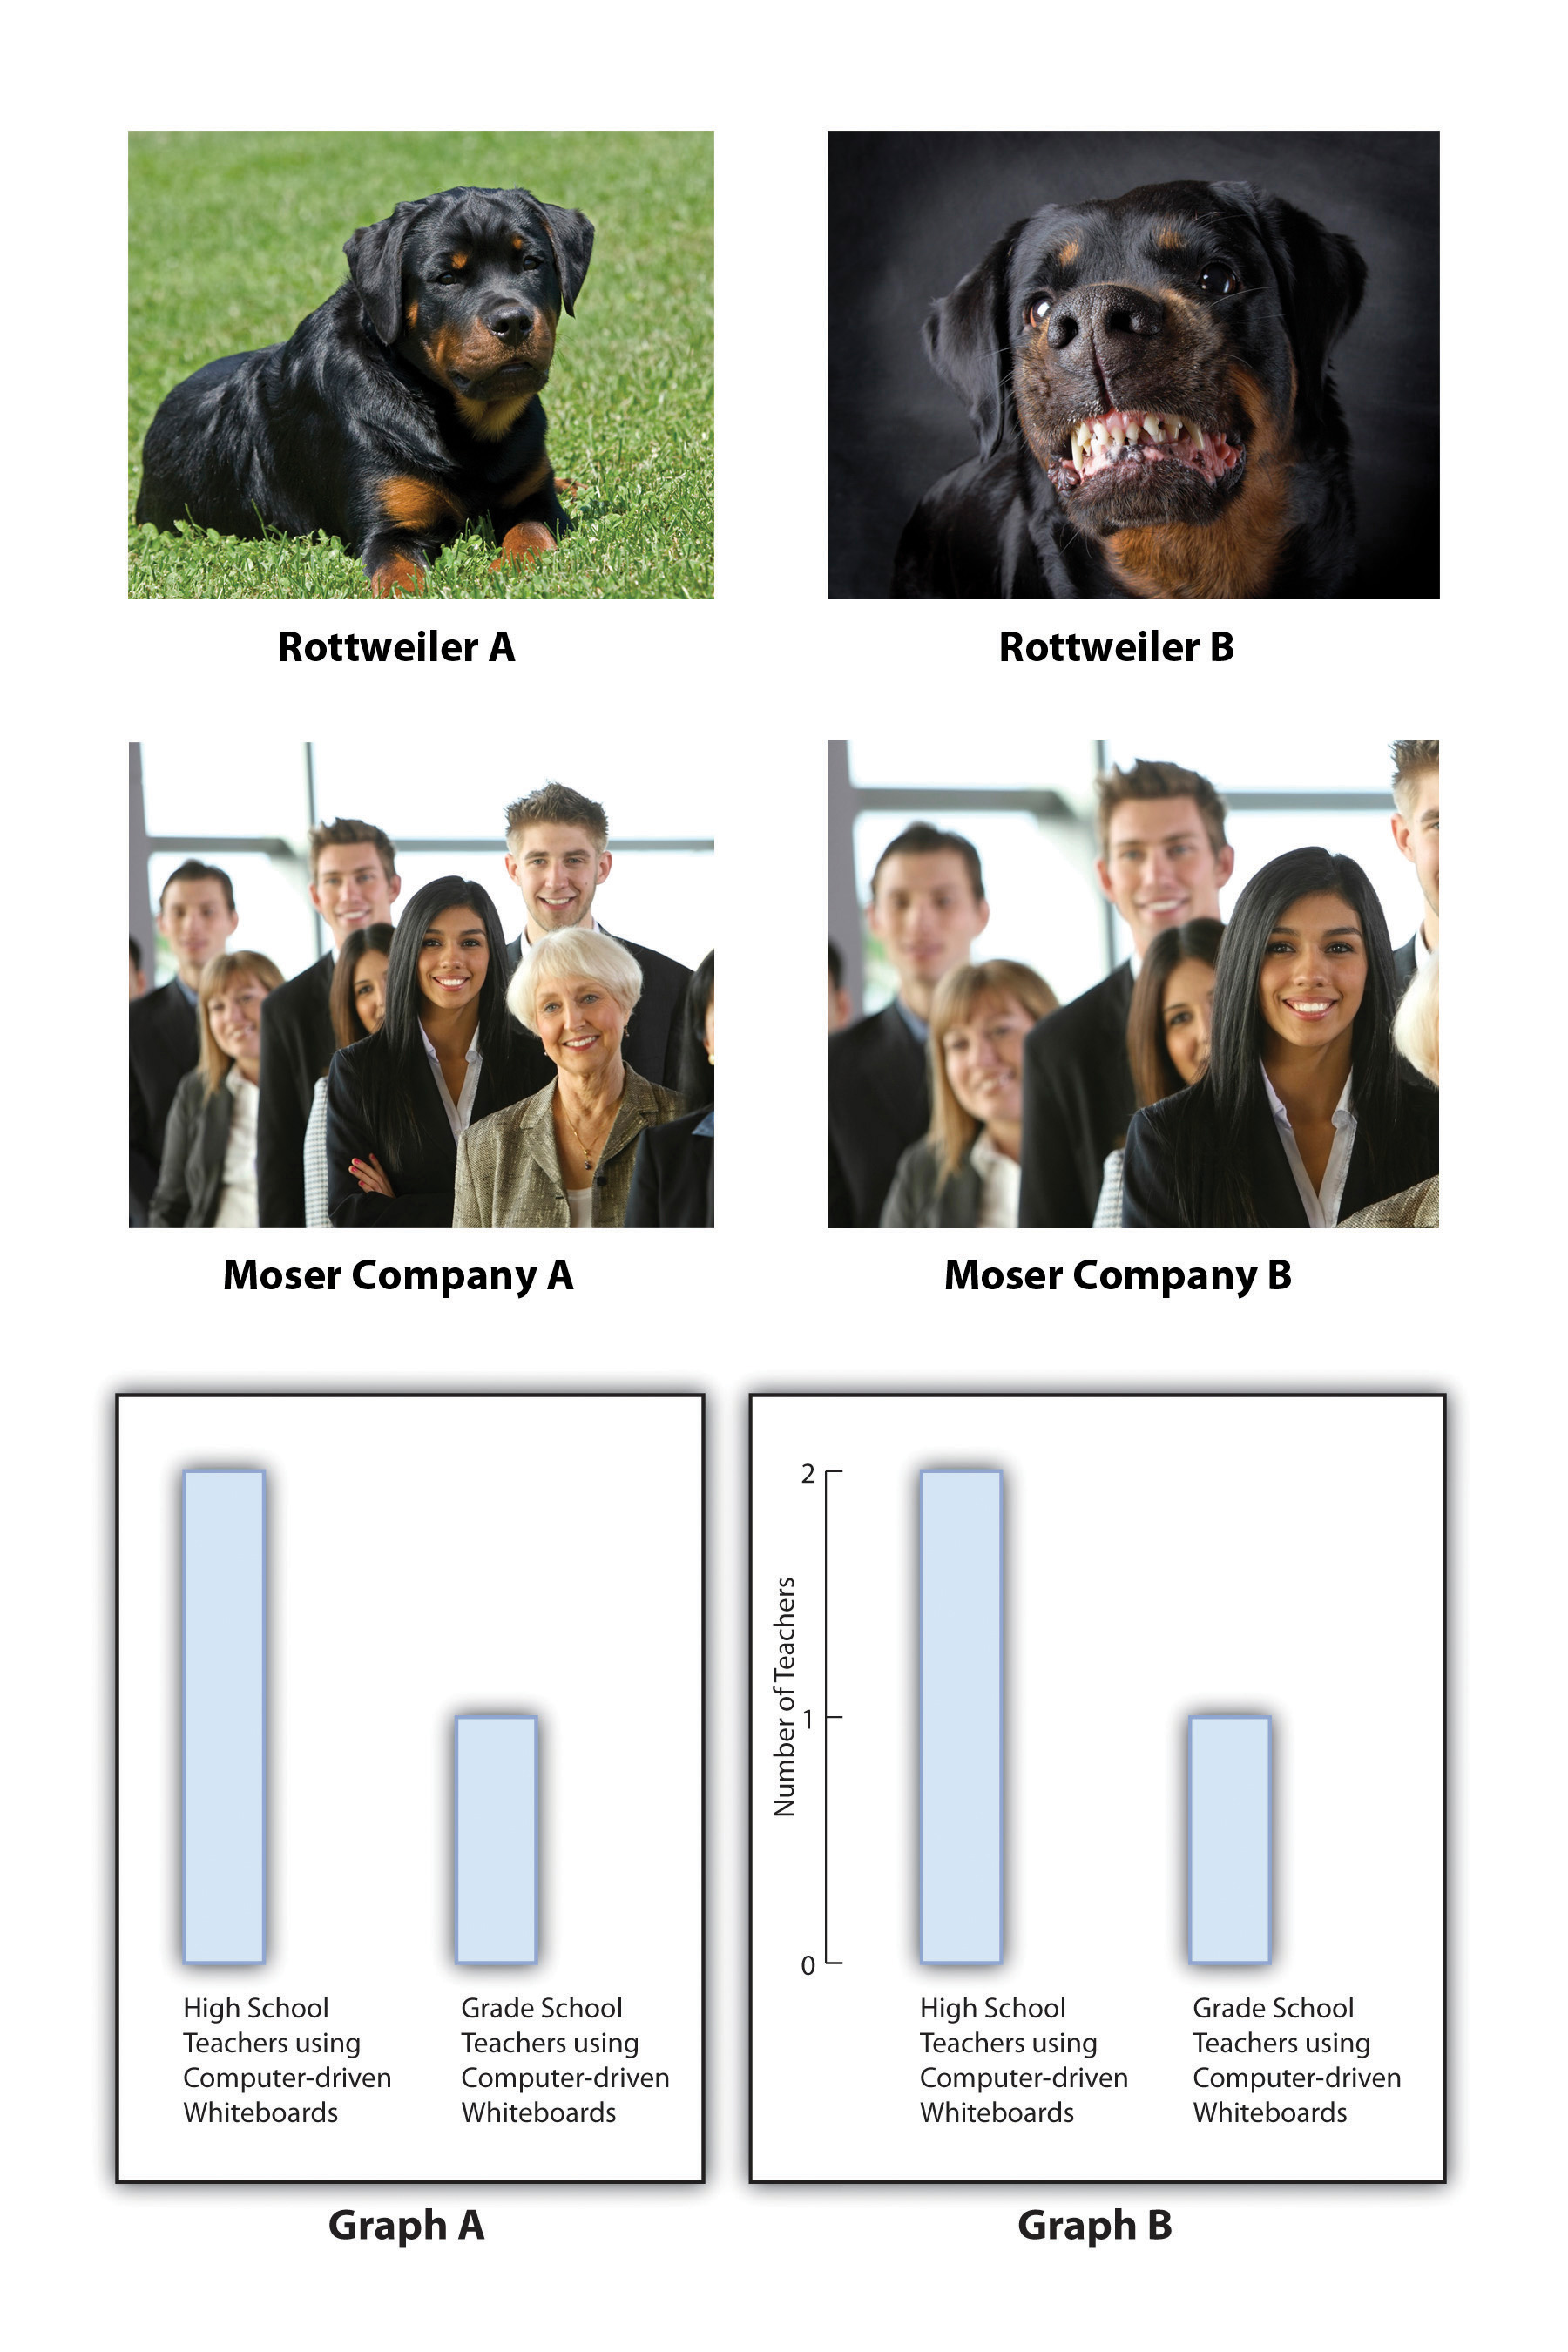
Also, just as you aim to avoid the use of fallacies in your text, you also need to be careful not to use fallacious visuals. (See Chapter 4 "Joining the Conversation", Section 4.3 "Rhetoric and Argumentation" for more on fallacies.) For example, if you were arguing for or against the proposition that big dogs make good pets for families, you might show a picture of a Rottweiler. Figure 9.7 shows how the “for” side could choose a docile example (Rottweiler A), while the “against” side could choose a ferocious example (Rottweiler B) in order to support their respective claims.
Thanks to common programs such as Photoshop, you can easily alter a photo, but make sure to do so ethically. For example, say that you are making an argument that the Moser Company unfairly hires only young people and disposes of employees as they age. You decide to show a photo of some of the employees to make your point. You crop the original photo in Figure 9.7 (Moser Company A) into the version shown as Moser Company B. This cropping choice would be an example of a faked, misleading photo and would be unethical.
More than likely, you have seen tables or graphs that paint a reality that is not exactly accurate. For example, the two graphs in Figure 9.7 could be used as proof that “twice as many” high school teachers as grade school teachers choose to use computer-driven whiteboards. Graph A seems to support this statement nicely. If you look at Graph B, however, you realize that the entire sample includes only three teachers, so “twice as many” means, literally, two out of three—an inadequate sample that leads to neither impressive nor convincing data. Be very careful not to misrepresent data using tables and graphs, whether knowingly or accidentally.
Figure 9.7
Photos © Thinkstock
Weighing Your Options for Visuals
Visuals, like oral or written text, can make ethical, logical, and emotional appeals. (See Chapter 4 "Joining the Conversation", Section 4.2 "Recognizing the Rhetorical Situation" for more on rhetorical appeals.) Two examples of ethical appeals are a respected logo and a photo of the author in professional dress. Graphs, charts, and tables are examples of logical appeals. For the most part, nearly all visuals, because they quickly catch a reader’s eye, operate on an emotional level—even those that are designed to make ethical and logical appeals.
Consider the following options as you choose visuals for your work:
- Choose visuals that your audience will understand and appreciate. Besides adding information, visuals can help you establish common ground with your audience.
- Think about the possible emotional reactions to your visuals and decide if you they are reactions you want to evoke.
- Make sure you choose ethically when using images to make an ethical appeal. For example, it is unacceptable to use an agency for credibility if you do not have the access rights, or the suggested connection is not real.
- Make sure you present the information accurately and in a balanced way when using images such as charts and tables to create a logical appeal.
- Look for visuals that are royalty-free or create your own, unless you are prepared to pay for visuals.
- Spend some time browsing through possible visuals in hopes of seeing something that makes a claim that works with your argument if you do not know what claim you are trying to make with a visual. (A caveat: You can fritter away a lot of time looking for visuals, so don’t browse for visuals at the expense of reading and writing.)
- Make sure you choose visuals that align with the ethical standards of your work, because visuals can sway readers quickly. If your text is solidly ethical, but your picture(s) are inflammatory, you might compromise the ethics of your whole work.
- Keep captions brief if you need to use them. Some images carry meaning without any explanation. If you can’t keep the caption brief, you probably need a different visual or better context for the visual in the text of your essay.
Key Takeaways
- When inserting images, you can wrap text to provide rectangle white space, tightly fitting white space, or paper-width white space.
- Visual elements of communication are especially powerful rhetorical tools that can easily be abused but can also be used responsibly and effectively.
- Commercial (or political) messages presented visually can easily mislead consumers (or voters), but it is much more difficult to take advantage of someone who knows how visual rhetoric works.
Exercises
- Create one page of text. Insert an image to the right of the text, one to the left, and one across the width of the page.
- Collect ten websites and advertisements. Examine each for use of visual rhetoric. Identify any instances where the websites and ads have used visual appeals unethically.
-
Write a journal or blog entry or a short essay that addresses some or all the following questions:
- How do you present yourself visually to others on social networking sites like Facebook?
- What kind of profile picture did you choose, and how did you decide on it?
- How often do you change your profile picture and why?
- How do friends of yours present themselves to the world through such sites?
- What would you say are the main types (or genres) of social networking site profile pictures?
- What are the messages each genre is trying to convey?