This is “The Costs of Deficits”, section 14.4 from the book Theory and Applications of Macroeconomics (v. 1.0). For details on it (including licensing), click here.
For more information on the source of this book, or why it is available for free, please see the project's home page. You can browse or download additional books there. To download a .zip file containing this book to use offline, simply click here.
14.4 The Costs of Deficits
Learning Objectives
After you have read this section, you should be able to answer the following questions:
- What is the crowding-out effect?
- When is the crowding-out effect of government deficits large?
We now turn to the costs of deficit spending. (Although we refer to this as “deficit spending,” the same arguments apply if we analyze the effects of a reduction in the government surplus.) First, we need to understand what happens in the financial sector of the economy if the government runs a deficit.
Savings and Investment
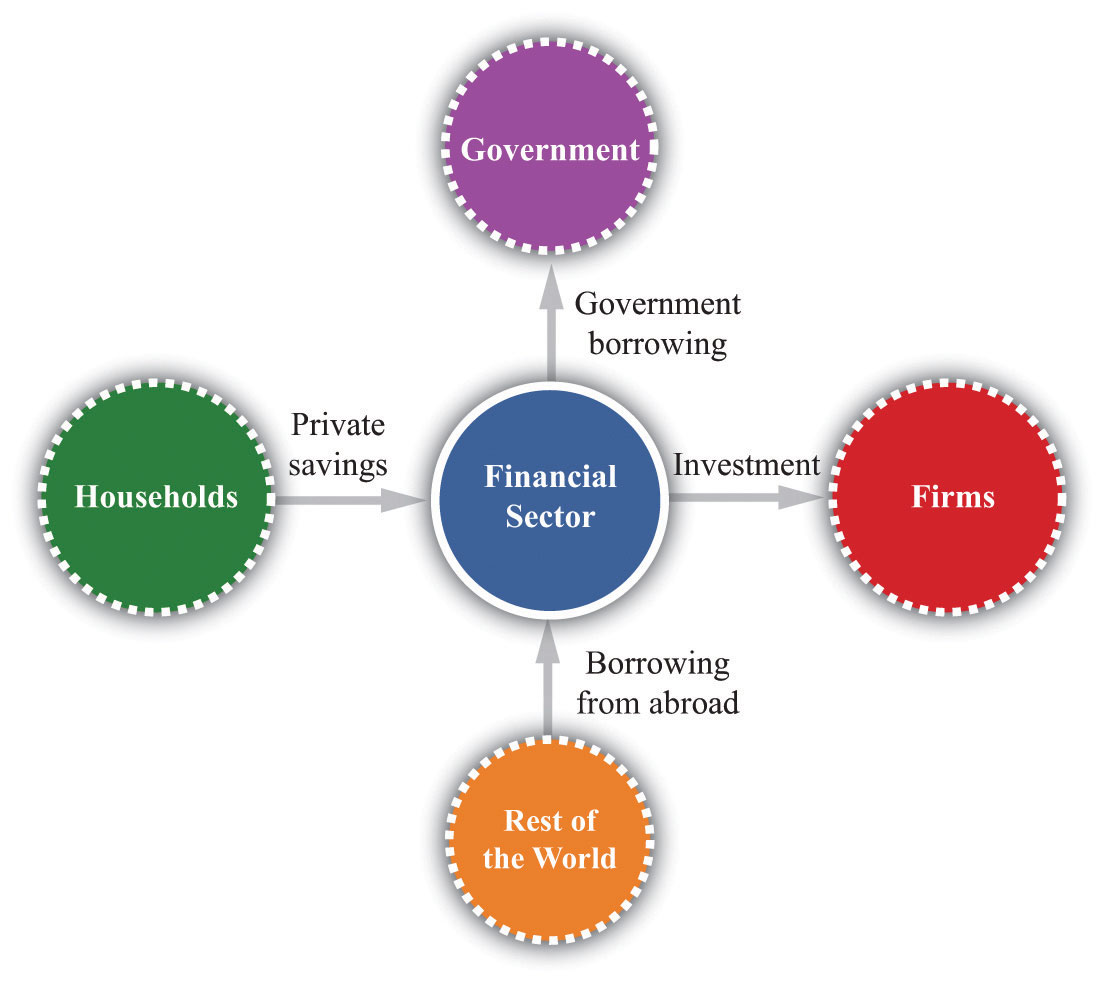
Earlier, we examined the circular flow of income in the government sector. Now we turn our attention to the circular flow in the financial sector, which is shown in Figure 14.15 "The Financial Sector in the Circular Flow".We also examined this sector in Chapter 5 "Globalization and Competitiveness". As with all sectors in the circular flow, the flows into and from the sector must match. In the case of the government sector earlier in the chapter, the balance of these flows is another way of saying that the government must satisfy its budget constraint. The rules of accounting tell us that, in the financial sector, the flows in must likewise match the flows out, but what is the underlying economic reason for this? The answer is that the flows are brought into balance by adjusting interest rates in the economy. We think of the financial sector of the economy as a large credit market in which the price is the real interest rate.
Figure 14.15 The Financial Sector in the Circular Flow

Funds flow into the financial sector as a result of household savings and borrowing from the rest of the world. Funds flow from the government sector (to finance the government deficit) and to the firm sector to finance investment.
Toolkit: Section 16.4 "The Credit (Loan) Market (Macro)"
You can review the credit market in the toolkit.
The Credit Market
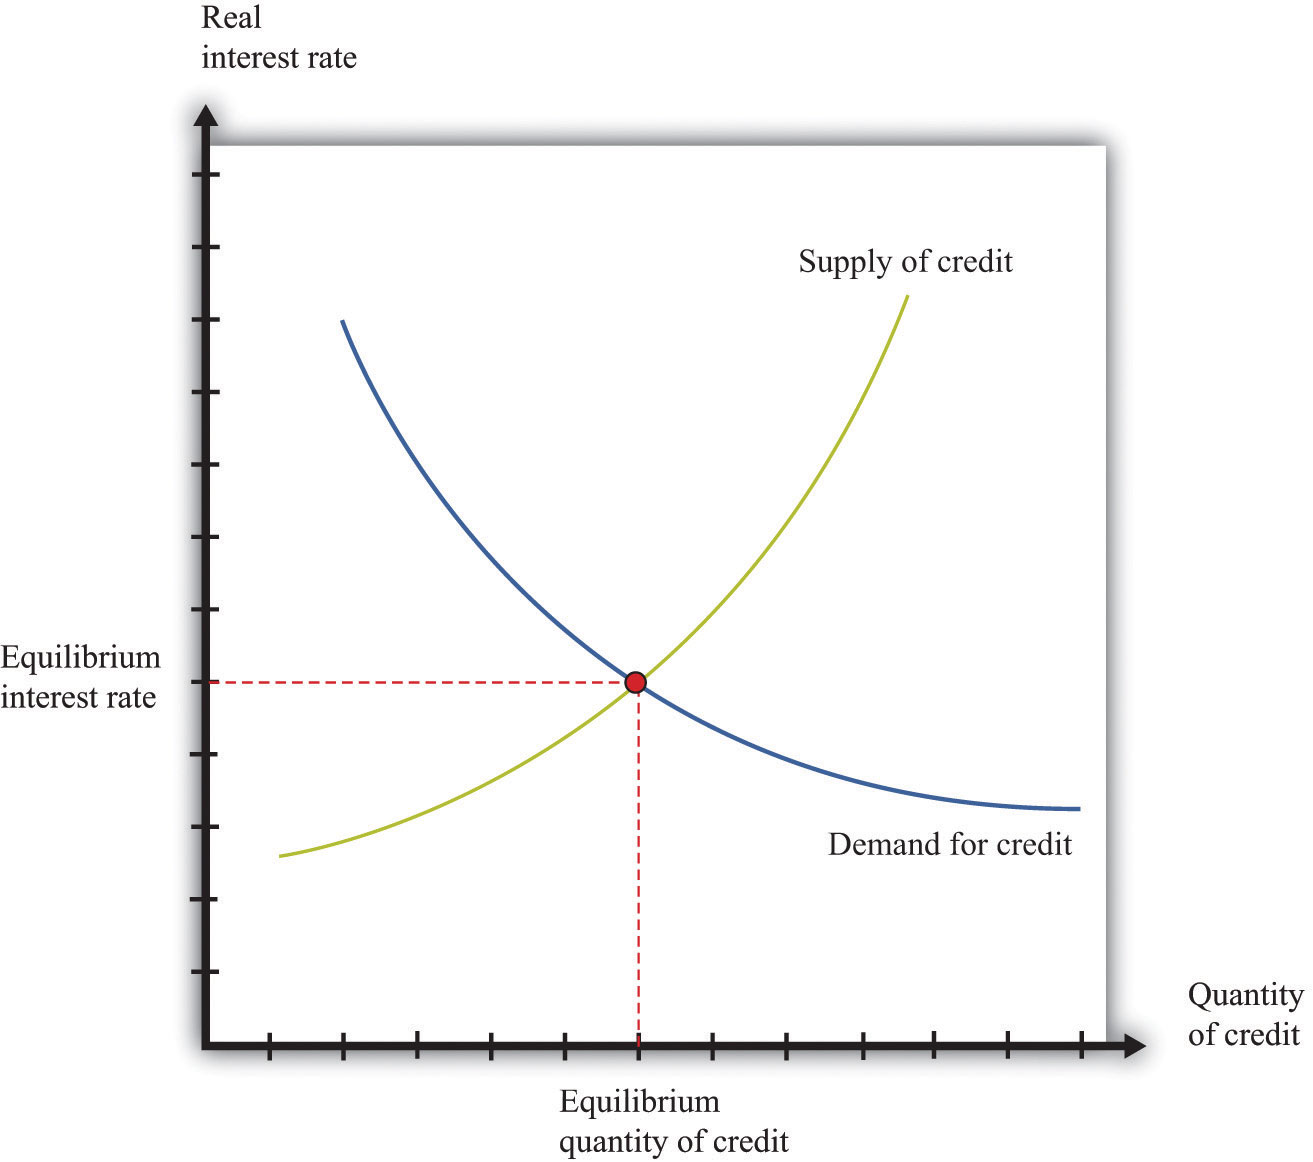
The supply of loans in the credit market comes from (1) private savings of households and firms, (2) savings or borrowing of governments, and (3) savings or borrowing of foreigners. Households generally respond to an increase in the real interest rate by saving more. Higher real interest rates also encourage foreigners to send funds to the domestic economy. National savingsThe sum of private and government saving. are defined as private savings plus government savings (or, equivalently, private savings minus the government deficit). The total supply of savings is therefore equal to national savings plus the savings of foreigners (that is, borrowing from other countries). The demand for credit comes from firms who borrow to finance investment. As the real interest rate increases, investment spending decreases. For firms, a high interest rate represents a high cost of funding investment expenditures.
The matching of savings and investment in the aggregate economy is described by the following equations:
investment = national savings + borrowing from other countriesor
investment = national savings − lending to other countries.The response of savings and investment to the real interest rate is shown in Figure 14.16 "The Credit Market". In equilibrium, the quantity of credit supplied equals the quantity of credit demanded. We have assumed that the country is borrowing from abroad, but nothing at all would change—other than the way we describe the supply curve—if the domestic economy were instead lending to other countries.
Figure 14.16 The Credit Market

Adjustment of the real interest rate ensures that the flows into and from the financial sector balance. The supply of loans comes from national savings plus borrowing from abroad. The demand for loans comes from firms seeking funds for investment.
Crowding Out
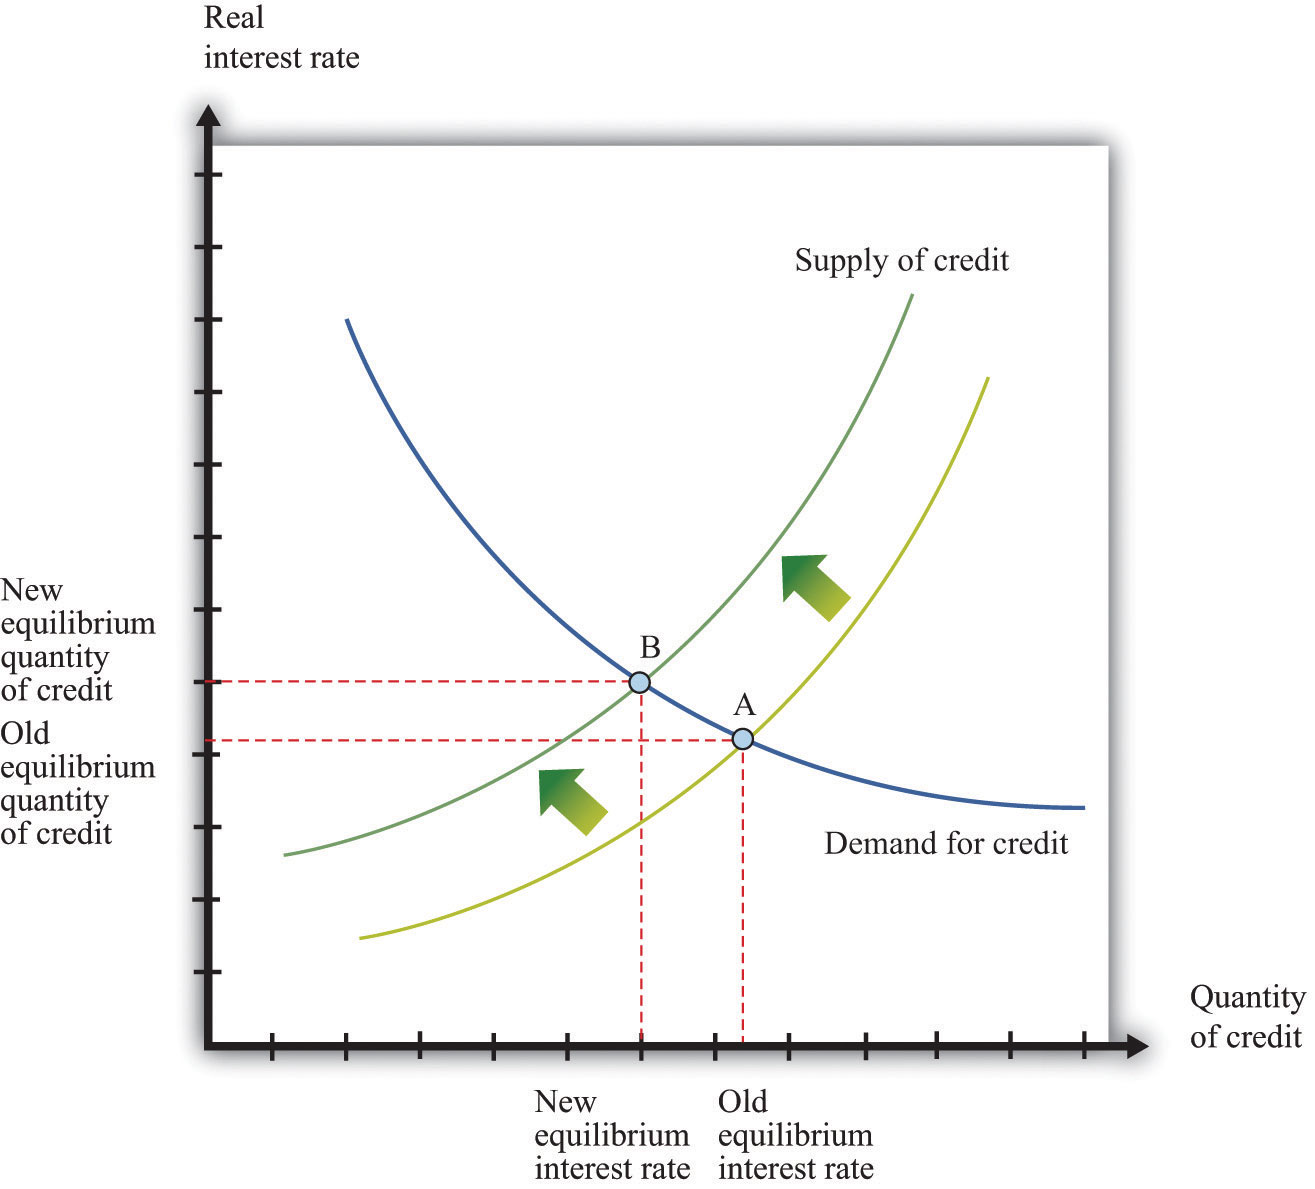
Armed with this framework, we can determine what happens to saving, investment, and interest rates when the deficit increases. Figure 14.17 "Crowding Out" begins with the credit market in equilibrium at point A. The increased government deficit is shown as a leftward shift of the national savings line. At each level of the real interest rate, the increased government deficit means that national savings is lower.
Figure 14.17 Crowding Out

An increase in the deficit means a reduction in saving, so the saving line shifts leftward and the new equilibrium entails a higher real interest rate and a lower level of investment. The equilibrium decrease in saving and investment is less than the initial decrease in government saving.
This shift in the savings line implies that the market for loans is no longer in equilibrium at the original interest rate. Real interest rates increase in response to the excess of investment over savings until the market is once again in equilibrium, at point B in Figure 14.17 "Crowding Out". Comparing A to B, we can see there are two consequences of the government deficit: (1) real interest rates increase, and (2) the amount of credit, and hence the level of investment, is lower. The reduction in investment spending caused by an increase in government spending is called crowding outThe situation that occurs when an increase in the government deficit leads to an increase in the real interest rate and to a decrease in spending through reductions in investment and exports.. In addition, household spending on durable goods also decreases when interest rates increase: this is also an example of crowding out. To the extent that household spending on durables and investment are sensitive to changes in real interest rates, the crowding-out effect can be substantial.
Crowding out also operates through net exports. From Figure 14.17 "Crowding Out", we know that an increase in the deficit leads to an increase in interest rates. Increased interest rates have three effects:
- They cause investment to decrease. This is the crowding-out effect.
- They cause private saving to increase. Higher interest rates encourage people to save rather than consume.
- They attract funds from other countries. Investors in other countries see the higher interest rates and decide to invest in the domestic economy.
The second and third effects explain why the supply of credit slopes upward in Figure 14.17 "Crowding Out". As a result, the decrease in investment is not as large as the increase in the deficit. The decrease in government saving is partly offset by an increase in private saving and an increase in borrowing from abroad. Increased borrowing from abroad must result in a decrease in net exports to keep the flows into and from the foreign sector in balance.
To understand these linkages, imagine that the United States sells additional government debt, some of which is purchased by banks in Europe, Canada, Japan, and other countries. These purchases of government debt require transactions in the foreign exchange market. If a bank in Europe purchases US government debt, there is an increased demand for dollars in the euro market for dollars, which leads to an appreciationAn increase in the price of a currency. in the price of the dollar. When the dollar appreciates, US citizens find that European goods and services are cheaper, whereas Europeans find that US goods and services are more expensive. US imports increase and exports decrease, so net exports decrease.
To summarize, an increased government deficit leads to the following:
- An increase in the real interest rate
- An appreciation of the exchange rate
- A reduction in investment and in purchases of consumer durables
- An increase in the trade deficit
Table 14.10 "Investment, Savings, and Net Exports (Billions of Dollars)" shows the US experience during the 1980s, when the US federal government ran a large budget deficit (the negative entries in the federal budget surplus column). The table also reveals that the United States ran a sizable trade deficit starting in 1983. This phenomenon became known as the twin deficits.
Table 14.10 Investment, Savings, and Net Exports (Billions of Dollars)
| Year | Investment | Trade Surplus | National Saving | Budget Surplus | Error |
|---|---|---|---|---|---|
| 1980 | 579.5 | 11.4 | 549.4 | −23.6 | 41.5 |
| 1981 | 679.3 | 6.3 | 654.7 | −19.4 | 30.9 |
| 1982 | 629.5 | 0.0 | 629.1 | −94.2 | 0.4 |
| 1983 | 687.2 | −31.8 | 609.4 | −132.3 | 46.0 |
| 1984 | 875 | −86.7 | 773.4 | −123.5 | 14.9 |
| 1985 | 895 | −110.5 | 767.5 | −126.9 | 17.0 |
| 1986 | 919.7 | −138.9 | 733.5 | −139.2 | 47.3 |
| 1987 | 969.2 | −150.4 | 796.8 | −89.8 | 22.0 |
| 1988 | 1,007.7 | −111.7 | 915.0 | −75.2 | −19 |
| 1989 | 1,072.6 | −88.0 | 944.7 | −66.7 | 39.9 |
Source: Economic Report of the President (Washington, DC: GPO, 2004), table B-32.
Even though recent years have also seen high deficits in the United States, interest rates have not increased, so we have not seen crowding out. This is because the Federal Reserve has also been operating in credit markets to keep interest rates low. Although crowding out is associated with fiscal policy, it also depends on what policies the monetary authority chooses to pursue.
When crowding out does occur, its long-term consequences may be significant. Lower investment translates, in the long run, into a lower standard of living.Chapter 6 "Global Prosperity and Global Poverty" explained how investment feeds into long-run economic growth. An increase in government spending means that the country has chosen to consume more now and less in the future. Similarly, crowding out of net exports means that the economy is borrowing more from other countries. This again means that the country has chosen to consume more now in exchange for debt that must be paid back later. The crowding-out effect is perhaps the most powerful argument in favor of a balanced-budget requirement.
Key Takeaways
- Crowding out occurs when government deficits lead to higher real interest rates and lower investment. The high interest rates can also cause the domestic currency to appreciate, leading to a decrease in net exports.
- The crowding-out effect is large when spending by households on durables and investment spending are sensitive to variations in the real interest rate and when exports are sensitive to changes in the exchange rate.
Checking Your Understanding
- Why do higher interest rates cause the currency to appreciate?
- In using the credit market to study the effects of government deficits on real interest rates, what did we assume about household saving?


