This is “Unemployment”, section 8.1 from the book Theory and Applications of Macroeconomics (v. 1.0). For details on it (including licensing), click here.
For more information on the source of this book, or why it is available for free, please see the project's home page. You can browse or download additional books there. To download a .zip file containing this book to use offline, simply click here.


8.1 Unemployment
Learning Objectives
After you have read this section, you should be able to answer the following questions:
- What is the unemployment rate, and how is it measured?
- What are the differences and the similarities in unemployment rates in the United States and Europe?
- If the labor market functions perfectly, what is the rate of unemployment?
- How does unemployment arise?
We begin by discussing the most commonly watched indicator of the state of the labor market: the unemployment rate. In the United States, the unemployment rate is measured by the Bureau of Labor Statistics (BLS; http://www.bls.gov/cps/home.htm). The BLS looks at the population of individuals of working age who are not in the military. It sorts such people into three separate categories:
- Employed. Individuals with a job, either full time or part time
- Unemployed. Individuals who do not currently have a job but are searching for employment
- Out of the labor force. Individuals who are not employed and not looking for work
Thus
civilian working age population = number employed + number unemployed+ number out of the labor force.Those out of the labor force include students, stay-at-home parents, those who are prevented from working by disability, and people who have taken early retirement. The category also includes discouraged workersSomeone who would like a job but who has stopped searching and is therefore classified as out of the labor force rather than unemployed., those who are deemed to have dropped out of the labor force because they have stopped looking for a job.
The civilian labor forceThe sum of employed and unemployed individuals. comprises the employed and the unemployed. The unemployment rateThe number of unemployed individuals divided by the sum of the number employed and the number unemployed. is calculated as follows:
and the employment rateThe number of employed divided by the civilian labor force. is calculated as follows:
In the United States, the definition of “employed” is fairly liberal. To be classified as employed, it is sufficient to have done any work for pay or profit in the previous week. People may even be counted as employed if they did not work during the week—for example, if they were on vacation, out sick, on maternity/paternity leave, or unable to work because of bad weather.
In this chapter, we explore differences in unemployment in the United States and Europe. To do this properly, we need to take care that unemployment is measured in a similar way within the sample of countries. The European Commission defines as unemployed those aged 15 to 74
- who were without work during the reference week, but currently available for work,
- who were either actively seeking work in the past four weeks or who had already found a job to start within the next three months.“Employment and Unemployment (LFS): Definitions,” European Commission, accessed July 31, 2011, http://epp.eurostat.ec.europa.eu/portal/page/portal/employment_unemployment_lfs/methodology/definitions.
As in the United States, the unemployment rate is the number of people unemployed as a percentage of the labor force, and the labor force is the total number of people employed and unemployed.
The European Commission defines as employed those aged 15 to 74
- who during the reference week performed work, even for just one hour a week, for pay, profit or family gain,
- were not at work but had a job or business from which they were temporarily absent because of, e.g., illness, holidays, industrial dispute or education and training.“Employment and Unemployment (LFS): Definitions,” European Commission, accessed July 31, 2011, http://epp.eurostat.ec.europa.eu/portal/page/portal/employment_unemployment_lfs/methodology/definitions.
These descriptions reveal that the definitions used in Europe are broadly similar to those in the United States, meaning that we can legitimately compare employment and unemployment rates in the two regions.
National and local governments help people cope with the risk that they might lose their jobs. In the United States and many other countries, unemployed people are typically eligible to receive payments from the government, called unemployment insuranceA payment made by the government to those who are unemployed., for some period of time after losing their jobs. Some governments help the unemployed find jobs and may even provide financial support to help people retrain and obtain marketable skills.
Unemployment in the United States and Europe
Figure 8.2 "Unemployment Rates in France, the United States, and the Euro Area, 1985-2011" shows quarterly unemployment rates for the United States, France, and Europe as a whole. In the late 1980s, unemployment fell in both the United States and France, although the US unemployment rate was about two percentage points lower than the French rate. The 1990s were a different story. Unemployment rates increased in both countries at the beginning of the decade. Thereafter, the unemployment rate decreased in the United States, but it continued to increase in France for about half of the decade and decreased only near the end of century. From the early 1990s up to about 2008, the unemployment rate in Europe was substantially higher than that in the United States. The pattern for Europe as a whole closely matches the pattern for France, although unemployment in France is typically a little higher than the European average.
The crisis of 2008, however, led to a dramatic rise in the unemployment rate in the United States. At the end of 2007, the US unemployment rate was just under 5 percent. Two years later, at the start of 2010, the rate was over 10 percent. Unemployment also rose in Europe, but to nothing like the same degree. In early 2011, US and European unemployment rates were almost identical.
One other feature of the data is noticeable: there is a regular seasonal pattern in the data. For example, in the United States, unemployment is almost always higher in the first quarter of the year than it is in the preceding or following quarter. This is because some sectors of the economy are heavily affected by seasonal patterns. For example, stores may hire extra people during the Christmas holiday period, while construction firms may employ fewer people during the winter months. Sometimes, data such as these are “seasonally adjusted” to remove these effects.
Figure 8.2 Unemployment Rates in France, the United States, and the Euro Area, 1985-2011
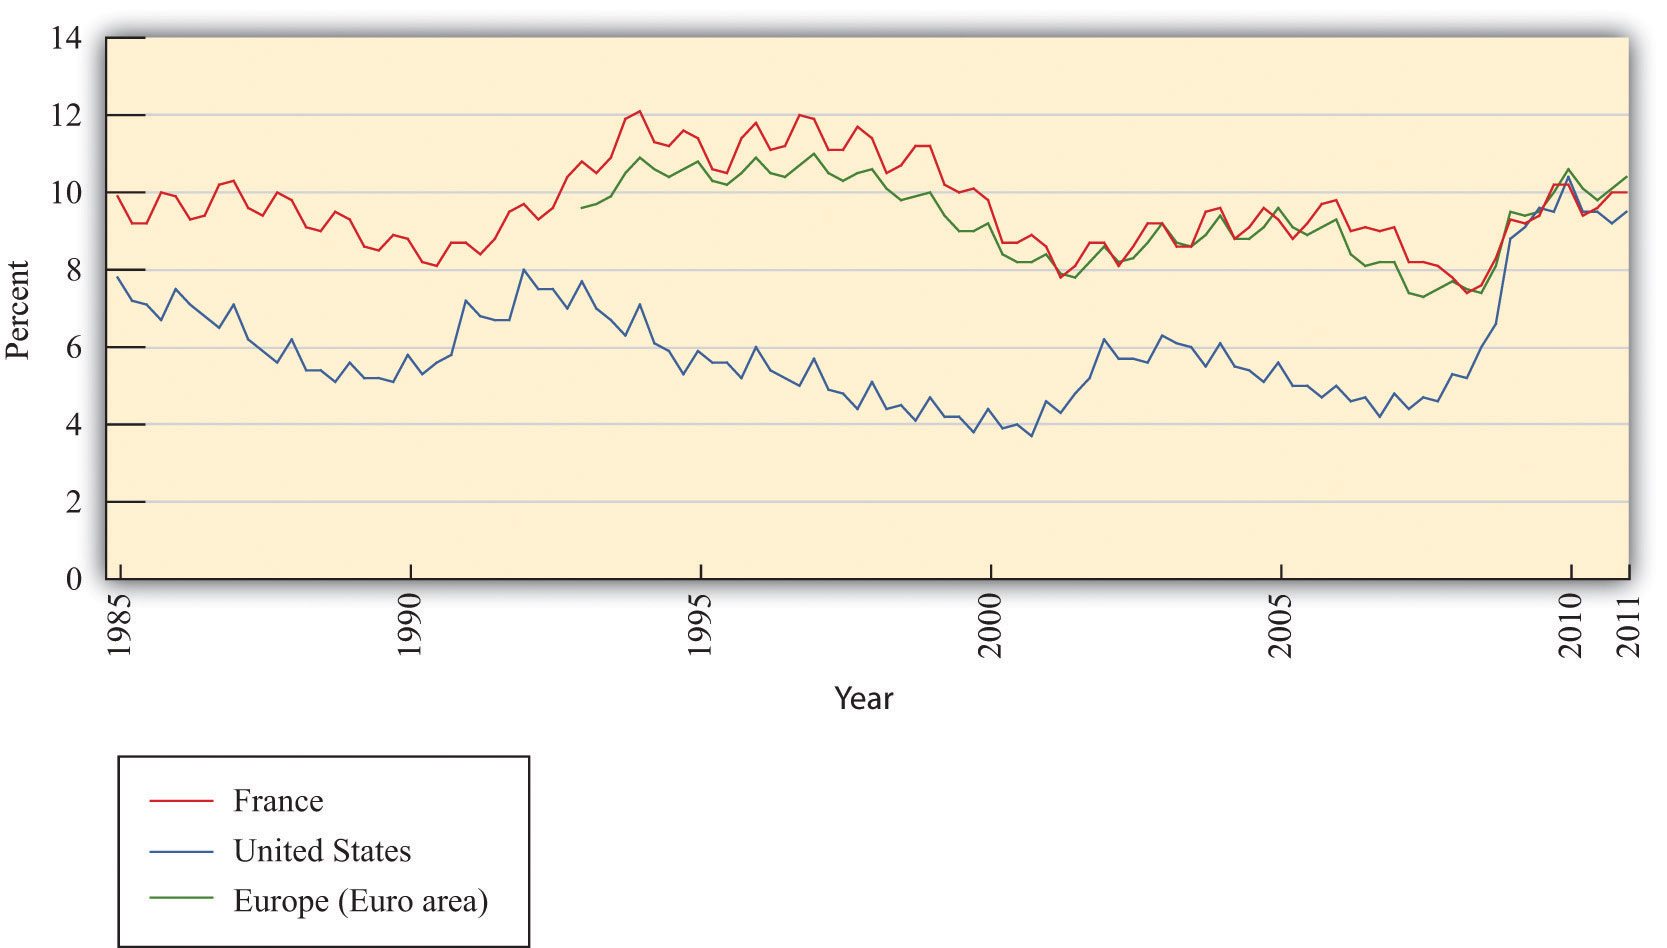
Source: OECD, “Statistics Portal: Labour,” http://www.oecd.org/topicstatsportal/0,2647,en_2825_495670_1_1_1_1_1,00.html#499797.
The French labor law reforms with which we began the chapter were aimed at young workers, so let us also look specifically at the unemployment experience of this group. Between 2000 and 2010, the unemployment rate in France for the age group 20–24 ranged between 17 and 21 percent, with an average of 18.6 percent. In the United States, in contrast, for the same period and the same group of workers, the unemployment rate averaged 10 percent.The figures on youth unemployment come from “Statistics Portal: Labour,” OECD, http://www.oecd.org/topicstatsportal/0,2647,en_2825_495670_1_1_1_1_1,00.html#499797. In both countries, the unemployment rate is higher for younger workers than the overall unemployment rate.
Although there are some similarities between France and the United States, there is also a clear puzzle: unemployment, for both the overall population and young workers, was, until very recently, much higher in France. We need to understand the source of this difference before we can evaluate different policy remedies.
The Labor Market
Unemployment suggests a mismatch between supply and demand. People who are unemployed want to have a job but are unable to find one. In economic language, they are willing to supply labor but cannot find a firm that demands their labor. The most natural starting point for an economic analysis of unemployment is therefore the labor marketThe market that brings together households who supply labor services and firms who demand labor as an input into the production process..
Toolkit: Section 16.1 "The Labor Market"
The labor market brings together the supply of labor by households and the demand for labor by firms. You can review the labor market in the toolkit.
Figure 8.3 Labor Market
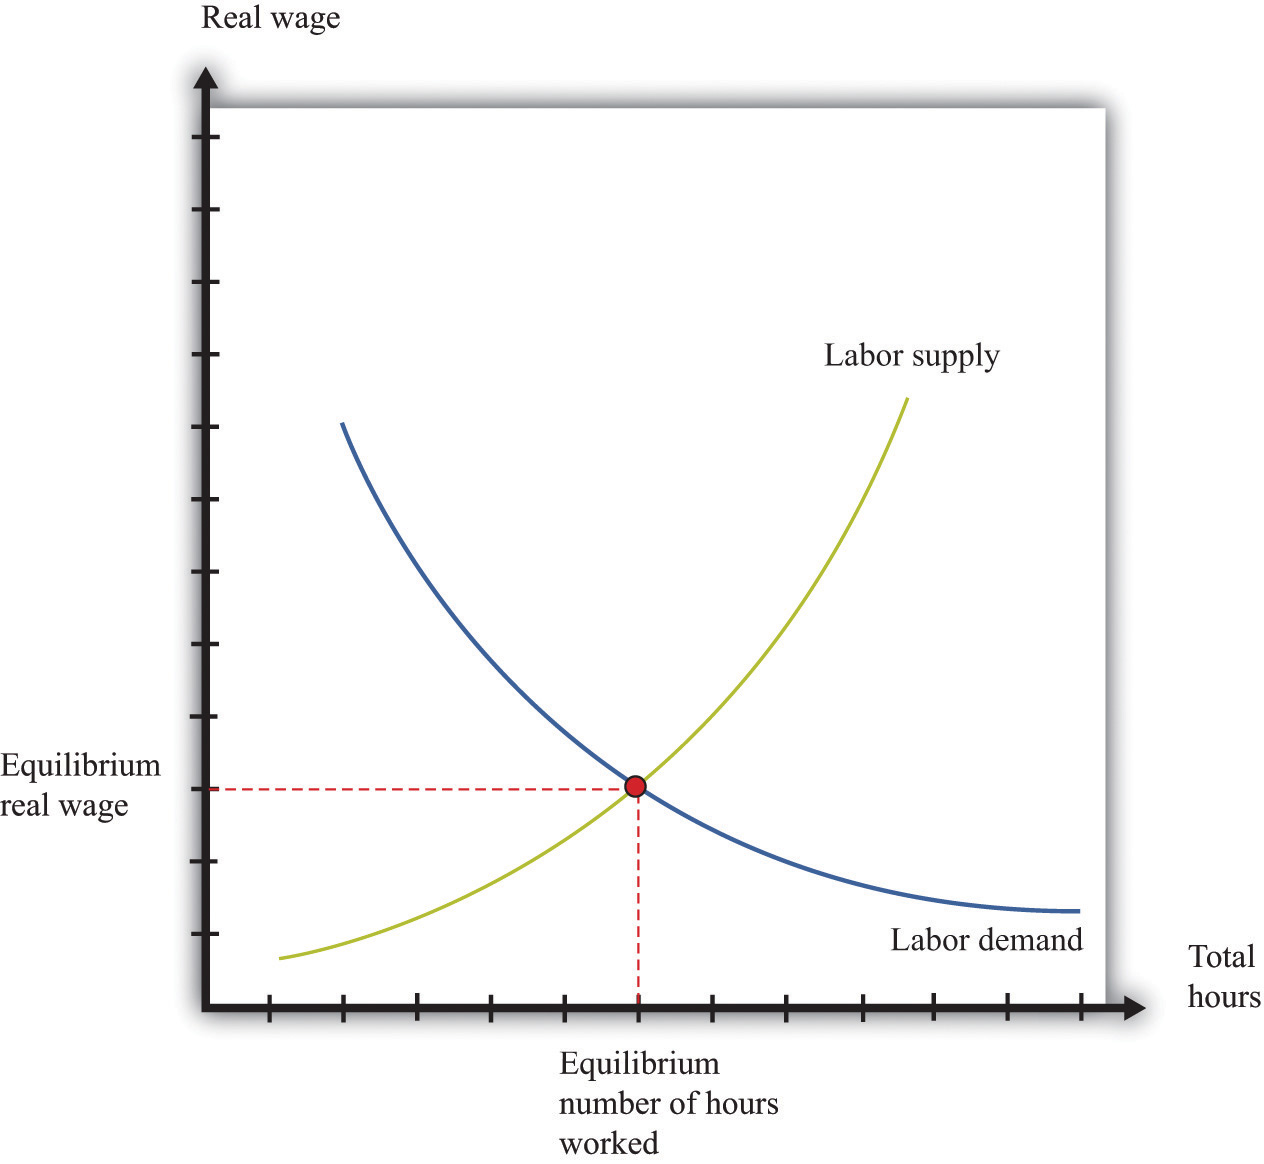
The labor market is depicted in Figure 8.3 "Labor Market". “Price” on the vertical axis is the real wageThe nominal wage (the wage in dollars) divided by the price level., which is the nominal wage divided by the price level. It tells us how much you can obtain in terms of real goods and services if you sell an hour of your time. Recalling that the price level can be thought of as the price of a unit of the real gross domestic product (real GDP), you can equivalently think of the real wage as the value of your time measured in units of real GDP.
At a higher real wage, households supply more labor. There are two reasons for this. First, a higher real wage means that, for the sacrifice of an hour of time, households can obtain more goods and services than before. Households are therefore induced to substitute away from leisure to work and ultimately consume more. Second, as the wage increases, more individuals join the labor force and find a job. Embedded in the upward-sloping labor supply curve is both an increase in hours worked by each employed worker and an increase in the number of employed workers.
At a higher real wage, firms demand fewer labor hours. A higher real wage means that labor time is more expensive than before, so each individual firm demands less labor and produces less output. The point where the labor supply and demand curves meet is the equilibrium in the labor market. At the equilibrium real wage, the number of hours that workers choose to work exactly matches the number of hours that firms choose to hire.
Supply and demand in the labor market determine the real wage and the level of employment. Variations in either labor supply or labor demand show up as shifts in the curves. If we want to talk about unemployment, however, the labor market diagram presents us with a problem. The idea of a market is that the price adjusts to reach equilibriumAn equilibrium price and an equilibrium quantity such that the quantity supplied equals the quantity demanded at the equilibrium price.—the point where supply equals demand. In the labor market, this means the real wage should adjust to its equilibrium value so that there is no mismatch of supply and demand. Everyone who wants to supply labor at the equilibrium wage finds that their labor is demanded—in other words, everyone who is looking for a job is able to find one.
Remember the definition of unemployment: it is people who are not working but who are looking for a job. The supply-and-demand framework has the implication that there should be no unemployment at all. Everyone who wants to work is employed; the only people without jobs are those who do not want to work.
Theories of Unemployment
So where do we go from here? One natural approach is to start from Figure 8.3 "Labor Market" but look for circumstances in which we would see unemployment. Figure 8.4 "Unemployment in the Labor Market" shows us that there will be unemployment if the real wage in the market is too high—that is, above the equilibrium real wage. In this case, the amount of labor that workers want to sell is greater than the amount that firms want to buy. Some workers will want a job at this wage but be unable to find one. They will be unemployed.
Figure 8.4 Unemployment in the Labor Market
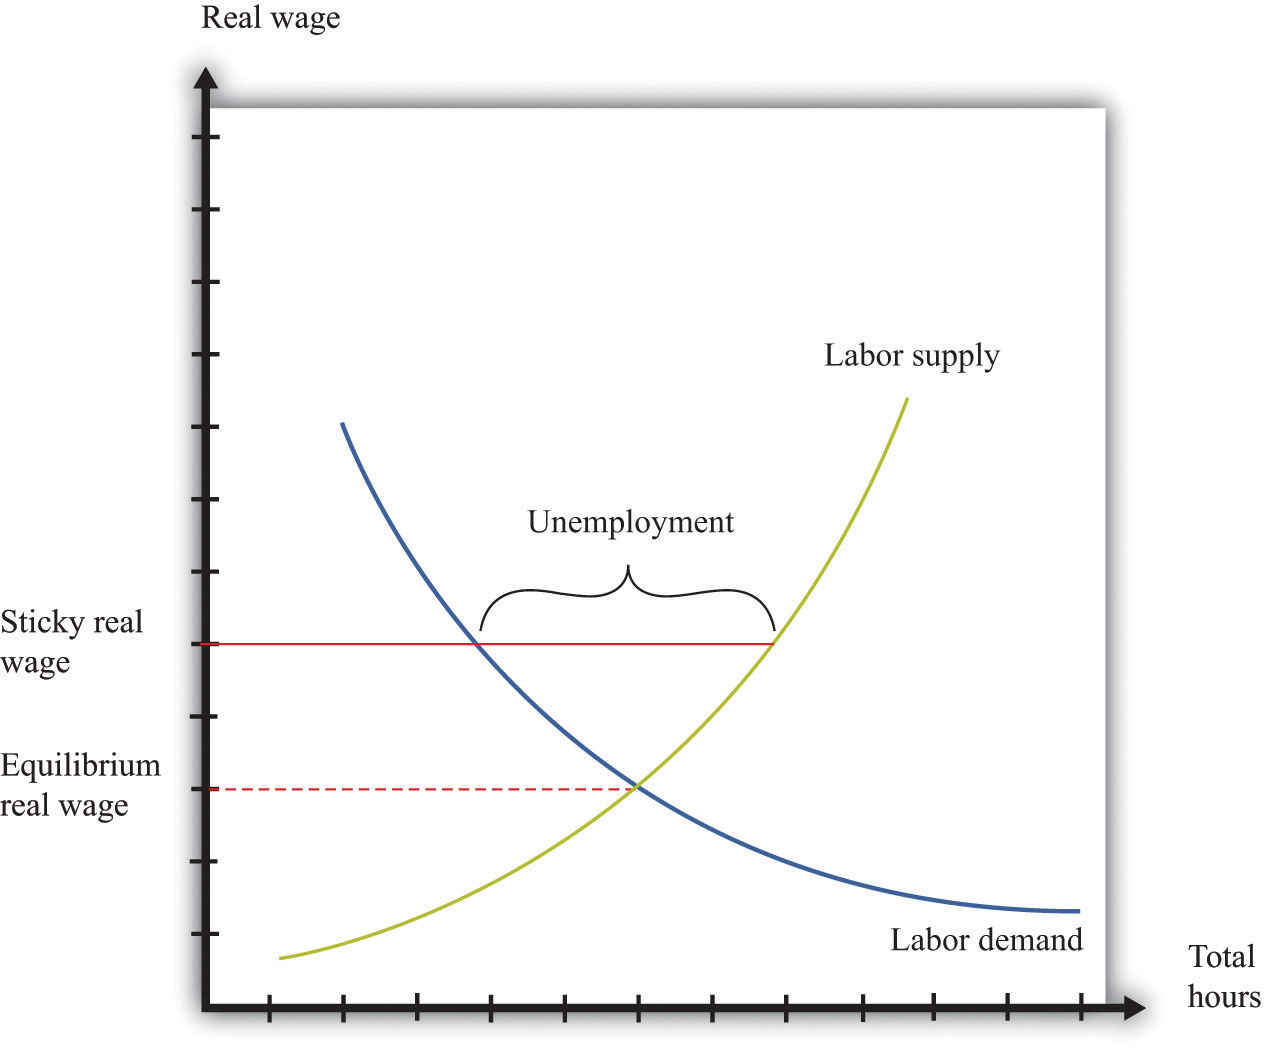
If the real wage is sticky, it may be higher than the equilibrium real wage, meaning that some workers who want to work are unable to find a job.
Figure 8.4 "Unemployment in the Labor Market" shows us what the labor market must look like for there to be unemployment, but it is hardly an explanation of unemployment. Economists typically expect markets to look like Figure 8.3 "Labor Market", not Figure 8.4 "Unemployment in the Labor Market". That is, they think that the price in a market—in this case, the real wage—adjusts quickly to ensure that supply equals demand. If we want to explain unemployment with a picture like Figure 8.4 "Unemployment in the Labor Market", we also need some story of why real wages might be sticky, so they remain above the equilibrium wage.
Inflexible Real Wages
Over the years, economists have offered several stories about why wages might be inflexible.
- One story is that the wage is not allowed to decrease by law. Many economies have minimum wage laws on their books. This could explain some unemployment. A difficulty with this explanation is that the minimum wage affects only low-income workers. Most workers in the economy actually earn a wage above the legal minimum and are unaffected by minimum-wage legislation.
- Another possibility is that firms find it difficult to adjust wages downward. The market for people’s time is not like the market for bread. Pay cuts are very visible to workers and are likely to meet a great deal of resistance. If a firm tries to cut wages, it is likely to find that its workers become demotivated and that its best workers start looking for jobs at other firms.
Both of these stories are really explanations of why nominal wagesThe wage in dollars paid to workers per unit of time. may be unable to adjust. Figure 8.4 "Unemployment in the Labor Market" has the real wage on the axis. Remember that the real wage is calculated as follows:
Minimum wage laws specify a fixed minimum nominal wage. Even if the nominal wage is fixed, the real wage decreases when the price levelA measure of average prices in the economy. increases. It follows that rigidities in the nominal wage translate into rigidities in the real wage only if the price level is also sticky.
Prices in an economy may indeed be sticky in the short run, so sticky wages and prices do provide one explanation for short periods of unemployment. Such unemployment is sometimes called cyclical unemploymentThe component of unemployment that depends on the business cycle.. In the long run, however, we would expect the labor market to return to an equilibrium with zero unemployment. Cyclical unemployment is the component of unemployment that depends on the business cycle. During a recession, cyclical unemployment is relatively high. In periods of economic expansion, cyclical unemployment is low or nonexistent. But we always observe some unemployment, which tells us that sticky nominal wages and prices cannot be the whole story.
Figure 8.4 "Unemployment in the Labor Market" tells us that the only way to get persistent unemployment in this framework is for the real wage to be permanently above the equilibrium wage. We need to find some reason why market forces will not cause the real wage to adjust to the point where demand equals supply.
One possible story introduces labor unions into the picture. Unions give some market power to workers. Just as we sometimes think about firms having market power, meaning that they have some control over the prices that they set, so we can think about a union having some control over the wage that workers are paid. If there were just a single union representing all workers, then it could choose the real wage, much as monopoly firms choose their price. Firms would then hire as many hours as they wanted at that wage. Generally, unionized workers are paid more than the wage at which supply equals demand, just as in Figure 8.4 "Unemployment in the Labor Market". The union accepts some unemployment but believes that the higher wage more than compensates. A problem with this story is that, like the minimum wage, it is relevant only for a relatively small number of workers. In the United States in particular, only a small fraction of the workforce is unionized.
Another story goes by the name of efficiency wagesWages in excess of the equilibrium real wage that are paid by firms to provide incentives for their workers to perform their duties.. The idea here is that firms have an incentive to pay a wage above the equilibrium. Workers who are paid higher wages may feel better about their jobs and be more motivated to work hard. Firms may also find it easier to recruit good workers when they pay well and find it easier to keep the workers that they already have. The extra productivity and lower hiring and firing costs may more than compensate the firm for the higher wage that it is paying.
Inside the Labor Market
So far, we have come up with four possible stories about unemployment. Can these theories help to explain differences between Europe and the United States?
First, it is generally the case that minimum wages are more generous in Europe than in the United States, so it is certainly possible that higher minimum wages in Europe contribute to higher levels of unemployment there. Second, there is some evidence that nominal wages are in some sense “stickier” in Europe than in the United States. Third, we can observe that unions are generally more prevalent and more powerful in Europe than in the United States. Thus some of the stories that we have told are potentially helpful in explaining differences between the United States and Europe.
However, all these theories are silent about the underlying movement of workers from employment to unemployment and back again. Figure 8.4 "Unemployment in the Labor Market" paints a static picture of a world that is in fact dynamic and fluid. There is no means in the framework to explore the role of unemployment insurance and other policies that differ across Europe and the United States. In addition, market forces may work differently in the labor market. In Figure 8.4 "Unemployment in the Labor Market", there are more workers wanting to work than there are jobs offered by firms. The standard story of market adjustment is that workers willing to work for a lower wage would approach a firm, offer to undercut the wage of an existing worker, and be immediately hired as a replacement. This is not how hiring and firing usually works in the labor market. Firms have a relationship with their existing workers; they know if their workers are competent, hardworking, and reliable. Firms will not readily replace them with unknown quantities, even for a lower wage.
For these reasons, researchers in labor economics think that Figure 8.4 "Unemployment in the Labor Market" is too simple a framework to explain the realities of modern labor markets. Instead, they frequently turn to a different framework more suited to thinking about labor market flows.
Key Takeaways
- The unemployment rate is the fraction of the civilian labor force looking for a job but currently not employed. The BLS in the United States produces this number on a monthly basis.
- During the early part of the 1980s, the unemployment experiences in the United States and Europe were similar. Up until 2008, the unemployment rate in Europe had been significantly higher than the unemployment rate in the United States. Very recently, however, the US unemployment rate climbed to European levels.
- In a perfectly functioning labor market, the unemployment rate would be zero.
- Possible explanations of unemployment include rigidities in wages, the market power of unions, and incentive effects.
Checking Your Understanding
- Explain in your own words why the standard supply-and-demand framework predicts zero unemployment when it is applied to the labor market.
- What wage is determined in labor market equilibrium—the real wage or the nominal wage?