This is “Comparative Statics”, section 31.16 from the book Theory and Applications of Economics (v. 1.0). For details on it (including licensing), click here.
For more information on the source of this book, or why it is available for free, please see the project's home page. You can browse or download additional books there. To download a .zip file containing this book to use offline, simply click here.
31.16 Comparative Statics
Comparative statics is a tool used to predict the effects of exogenous variables on market outcomes. Exogenous variables shift either the market demand curve (for example, news about the health effects of consuming a product) or the market supply curve (for example, weather effects on a crop). By market outcomes, we mean the equilibrium price and the equilibrium quantity in a market. Comparative statics is a comparison of the market equilibrium before and after a change in an exogenous variable.
A comparative statics exercise consists of a sequence of five steps:
- Begin at an equilibrium point where the quantity supplied equals the quantity demanded.
- Based on a description of the event, determine whether the change in the exogenous variable shifts the market supply curve or the market demand curve.
- Determine the direction of this shift.
- After shifting the curve, find the new equilibrium point.
- Compare the new and old equilibrium points to predict how the exogenous event affects the market.
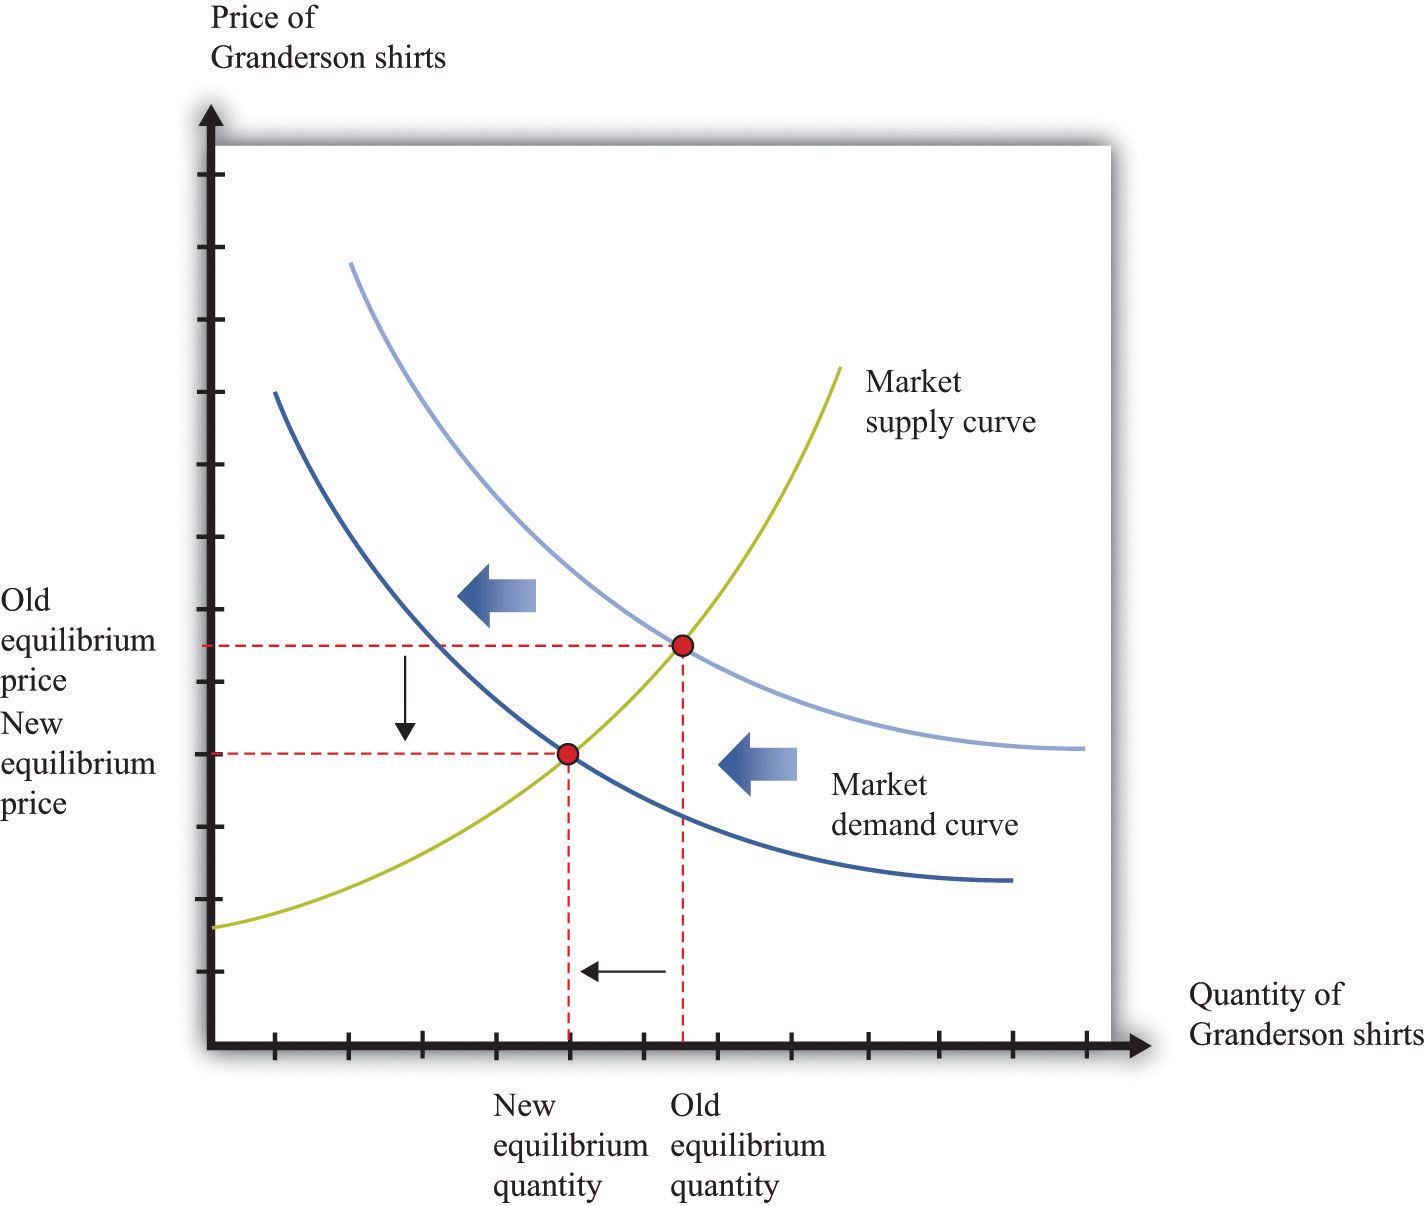
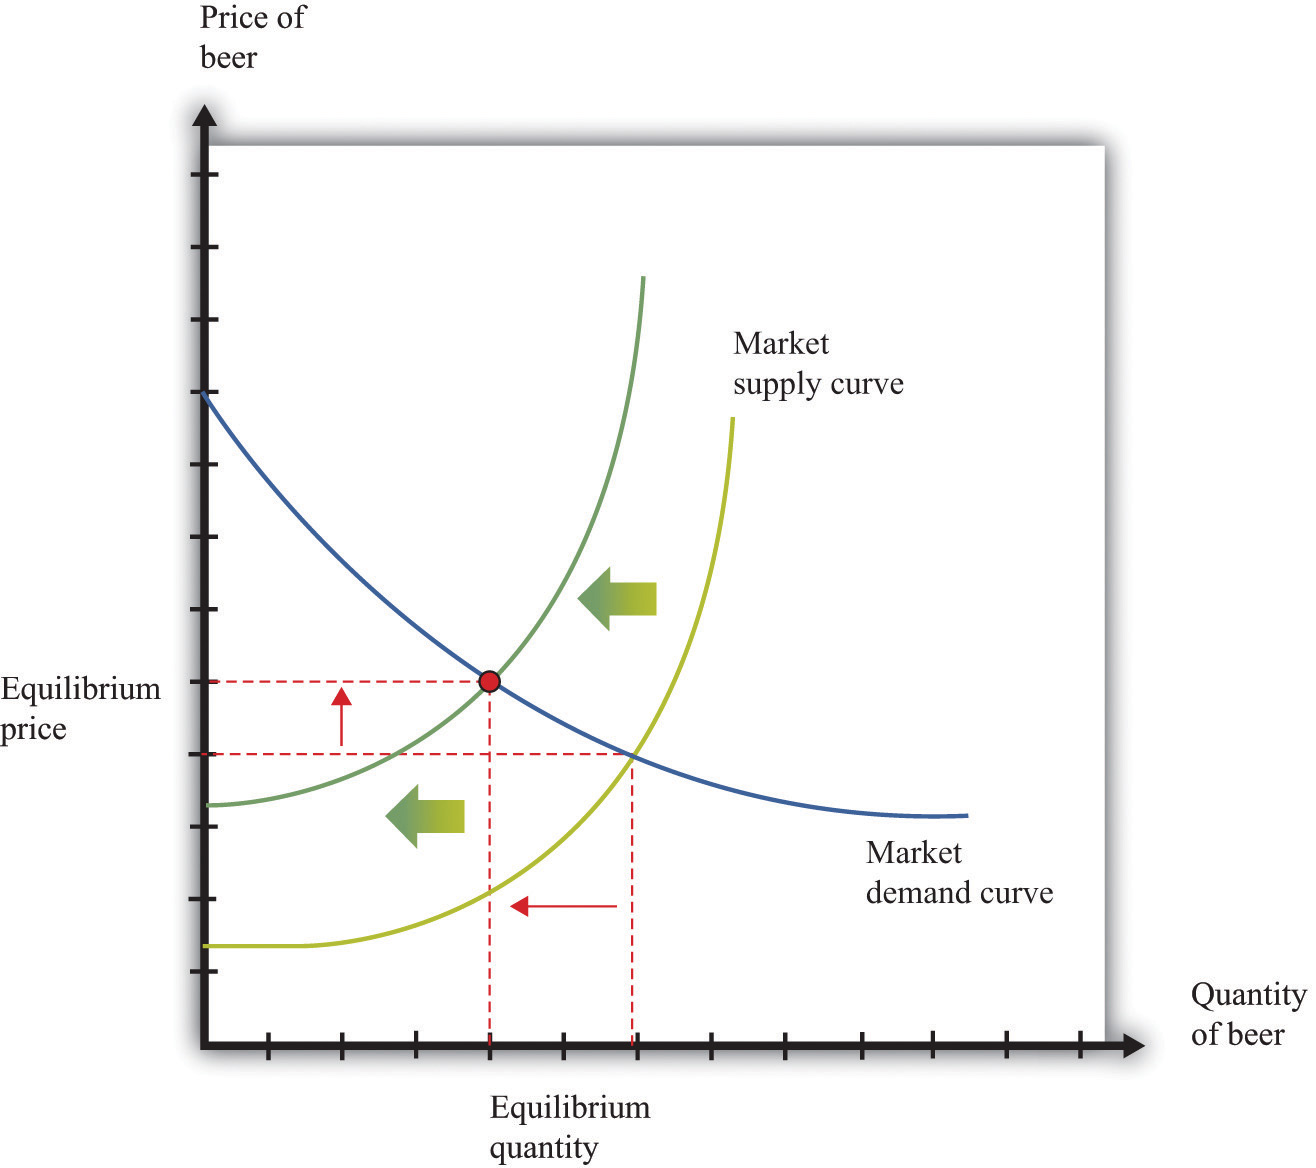
Figure 31.13 "A Shift in the Demand Curve" and Figure 31.14 "A Shift in the Supply Curve" show comparative statics in action in the market for Curtis Granderson replica shirts and the market for beer. In Figure 31.13 "A Shift in the Demand Curve", the market demand curve has shifted leftward. The consequence is that the equilibrium price and the equilibrium quantity both decrease. The demand curve shifts along a fixed supply curve. In Figure 31.14 "A Shift in the Supply Curve", the market supply curve has shifted leftward. The consequence is that the equilibrium price increases and the equilibrium quantity decreases. The supply curve shifts along a fixed demand curve.
Key Insights
- Comparative statics is used to determine the market outcome when the market supply and demand curves are shifting.
- Comparative statics is a comparison of equilibrium points.
- If the market demand curve shifts, then the new and old equilibrium points lie on a fixed market supply curve.
- If the market supply curve shifts, then the new and old equilibrium points lie on a fixed market demand curve.
Figure 31.13 A Shift in the Demand Curve

Figure 31.14 A Shift in the Supply Curve


