This is “Individual and Government Perspectives on Social Security”, section 28.1 from the book Theory and Applications of Economics (v. 1.0). For details on it (including licensing), click here.
For more information on the source of this book, or why it is available for free, please see the project's home page. You can browse or download additional books there. To download a .zip file containing this book to use offline, simply click here.


28.1 Individual and Government Perspectives on Social Security
Learning Objectives
After you have read this section, you should be able to answer the following questions:
- How do households respond to variations in income over their lifetime?
- What is the government’s budget constraint in a pay-as-you-go system?
- What is the effect of Social Security on lifetime income?
We begin with the individual perspective on Social Security.
Social Security: The Individual’s View
Household incomes tend to vary quite a lot, but households like their consumption to be approximately constant over time. Households therefore use their savings to smooth out the variations in their income.We also discuss consumption smoothing in Chapter 27 "Income Taxes". For the purposes of understanding Social Security—both its problems and its reforms—we need to examine this idea of consumption smoothing more rigorously. Because Social Security is a program to provide for consumption in retirement, we must carefully lay out the decisions of a household over the entire lifetime of its members. By so doing, we can determine the likely effect of a promise of a transfer in the future on behavior today. Bear in mind that these transfers may be far in the future: for a 25-year-old worker, we are thinking about money that won’t be received for another 40 years or so.
As is often the case in economics, we start by looking at the simplest setup we can imagine. We do this not because we think we can answer every question with a simple model, but because we must make sure we understand the fundamentals of Social Security before we worry about the complexities. So, to keep things simple, we examine the life of a single individual—that is, think of the household as containing just one person. Hence we do not have to worry about multiple wage earners (who might be of different ages), and we do not have to worry about how to incorporate children (who grow up and leave the household) into our story. In this chapter, we use the terms individual and household interchangeably. We call our individual Carlo.
Carlo thinks about his income and consumption over his entire lifetime. Because he has the possibility of saving and borrowing, his income and consumption need not be equal in any given year. Carlo faces a lifetime budget constraintThe discounted present value of lifetime consumption must equal the discounted present value of lifetime income., however; in the end, his lifetime spending is limited by his lifetime income. The life-cycle model of consumptionA model studying how an individual chooses a lifetime pattern of saving and consumption given a lifetime budget constraint. examines Carlo’s decisions about how much to consume each year, given this budget constraint.
We begin with a simple numerical example. Suppose Carlo is 20 years old and very well informed about his future. He knows that he is going to work for 45 years—that is, up to age 65. He knows that, every year, he will receive income of $40,000, excluding Social Security contributions. He has to pay Social Security contributions on this income at a rate of 15 percent. Thus he knows he will pay $6,000 each year to Social Security, and his after-tax income is $40,000 − $6,000 = $34,000. After he retires at age 65, he knows he will receive a Social Security payment of $18,000 each year until he dies, 15 years later, on his 80th birthday (of heart failure, brought on by the exertion of blowing out all those candles).
To decide on his lifetime consumption and saving patterns, Carlo needs to know what his lifetime resources are. We know that, in general, a dollar today is not worth the same amount as a dollar next year—or 60 years from now—because of interest rates and inflation. We sidestep that problem for the moment by imagining that the real interest rateThe rate of return specified in terms of goods, not money. is zero. In this case, it is legitimate to add together dollars from different time periods.
So Carlo earns $34,000 per year for each of his 45 working years and obtains $18,000 per year for his 15 retired years. His total lifetime resources are as follows:
lifetime income = income during working years + income during retirement years = ($34,000 × 45) + ($18,000 × 15) = $1,530,000 + $270,000 = $1,800,000.Over his life, therefore, he has $1.8 million to spend. Figure 28.1 "Lifetime Income" shows his lifetime income. His total lifetime resources are obtained by adding together the two rectangles labeled “Lifetime Income from Working” and “Lifetime Social Security Income.” The height of each rectangle gives his income, and the width of each rectangle gives the number of years for which he earns that income.
Figure 28.1 Lifetime Income
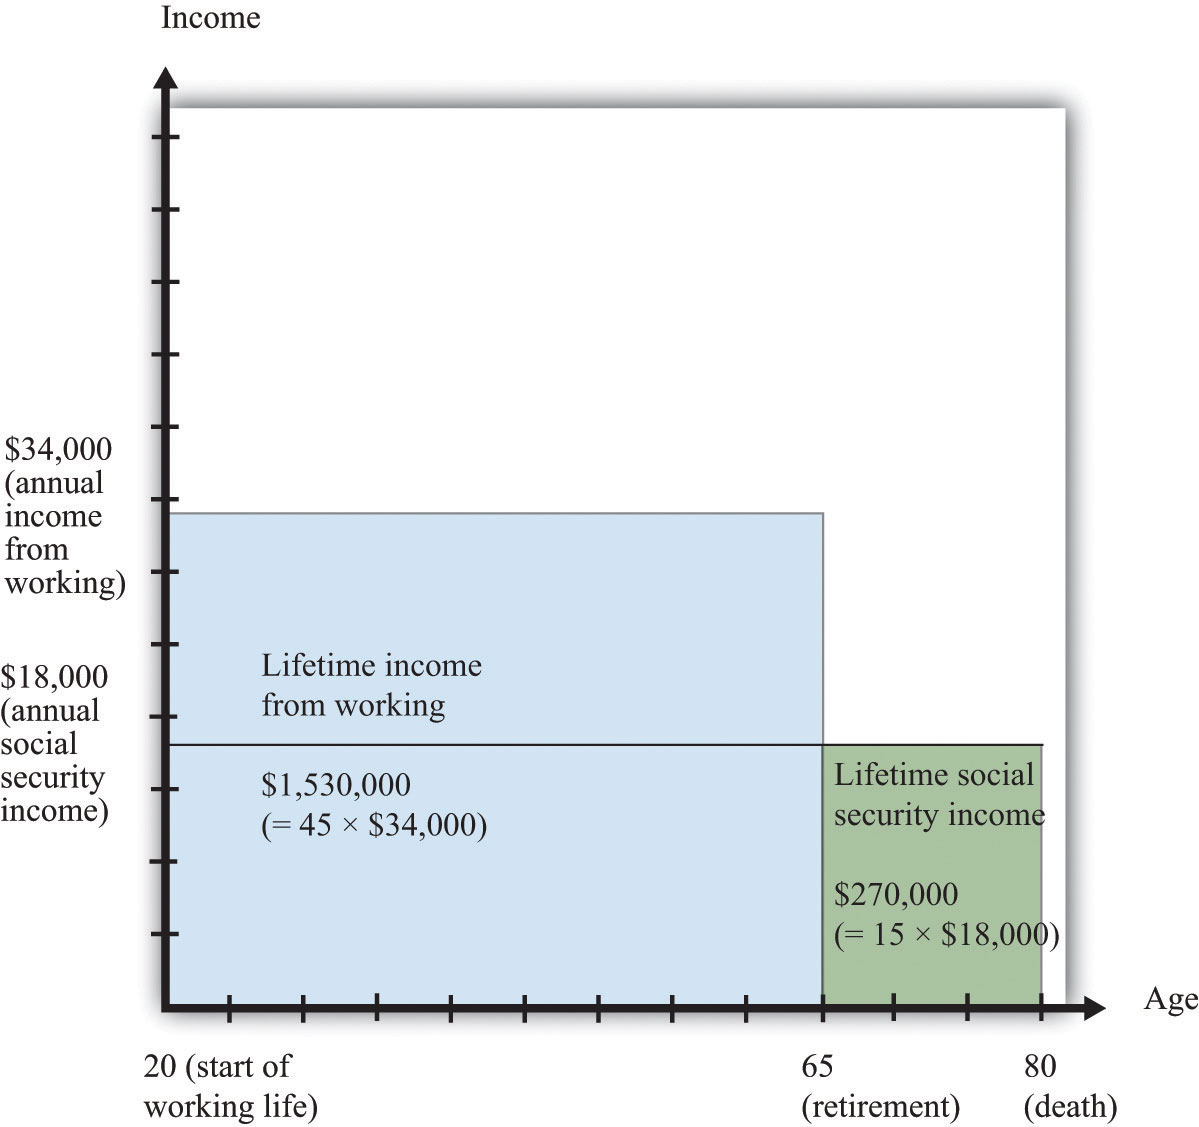
For 45 years, Carlo earns $34,000 per year (for a total of $1,530,000), and for 15 years, Carlo receives $18,000 per year in Social Security payments (for a total of $270,000). His total lifetime income is $1,800,000.
Carlo’s lifetime budget constraint says that his lifetime consumption must equal his lifetime income,
lifetime consumption = lifetime income.If Carlo wants to keep his consumption perfectly smooth, he will consume exactly the same amount in each of his 60 remaining years of life. In this case, his consumption each year is given by the following equation:
Figure 28.2 "Lifetime Consumption" shows Carlo’s consumption. The area of the rectangle is a measure of Carlo’s lifetime consumption since—as before—the height of the rectangle is his consumption per year, and the width is the number of years.
Figure 28.2 Lifetime Consumption
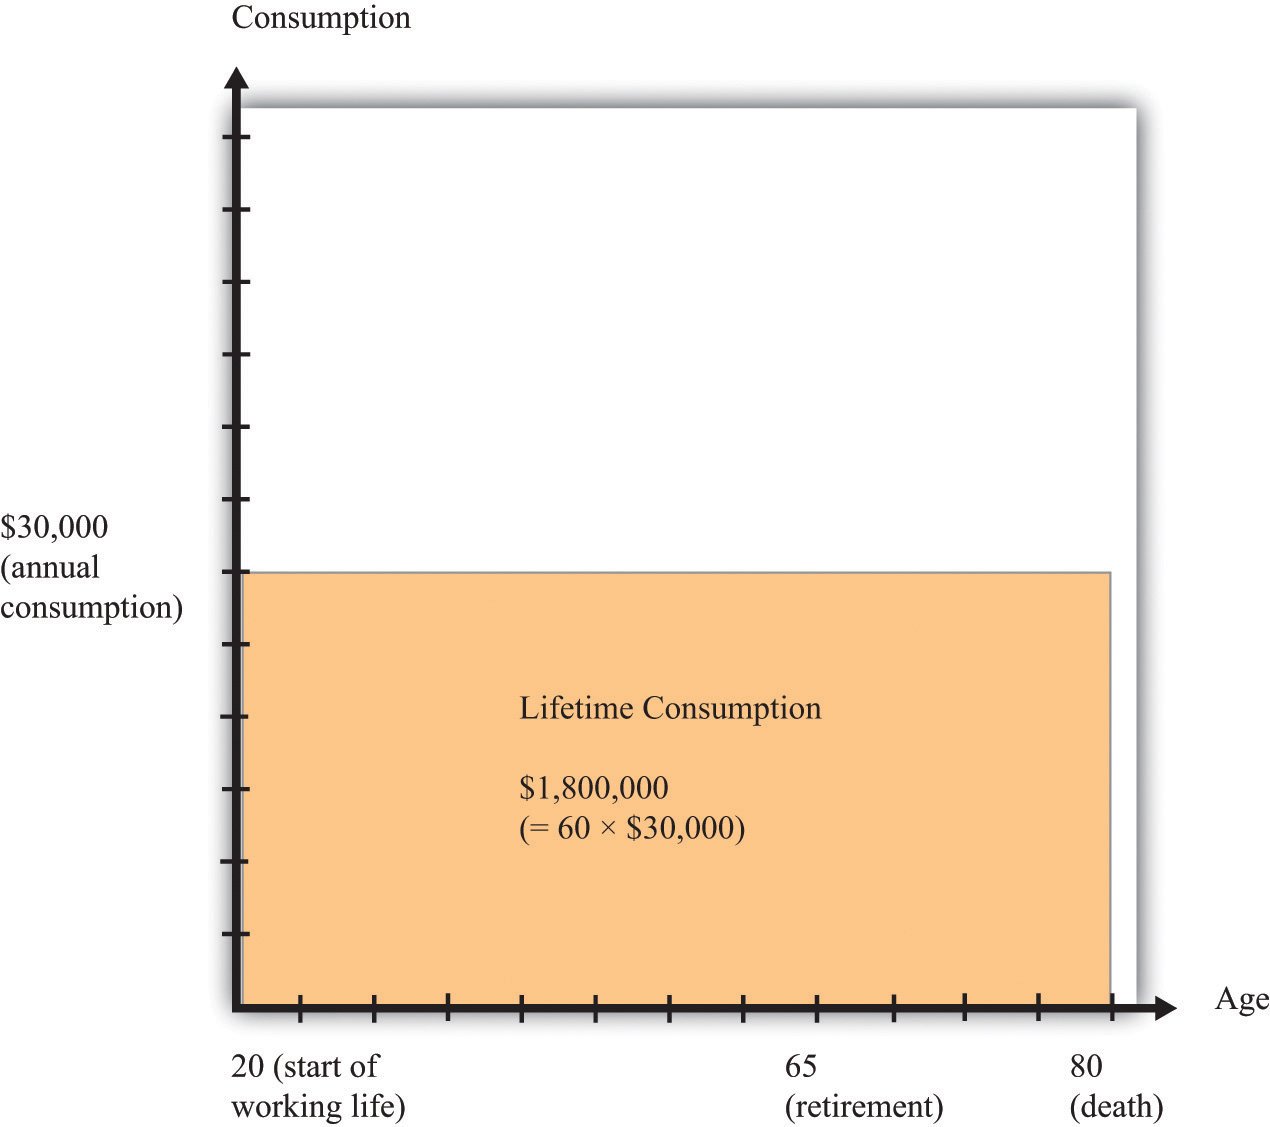
For the 60 years of his remaining life, Carlo spends $30,000 per year, making a total of $1,800,000 during his working years.
In each of his working years, Carlo earns $34,000 but consumes only $30,000. Thus he saves $4,000 every year. When he is 21 years old, he therefore has $4,000 in the bank. When he is 22 years old, he has $8,000 in the bank. By the time he retires at age 65, he has saved $180,000 (= 45 × $4,000).
During his retirement years, Carlo starts to draw on his savings. Social Security pays him $18,000, so he needs to take an additional $12,000 from his savings to have $30,000 in consumption. At age 66, therefore, he has savings of $180,000 − $12,000 = $168,000. For each of his retirement years, his savings are reduced by a further $12,000. After his 15 years of retirement, he has reduced his savings by $12,000 × 15 = $180,000 and dies at the age of 80 with exactly zero in the bank.
Figure 28.3 "Lifetime Consumption and Saving" combines Figure 28.1 "Lifetime Income" and Figure 28.2 "Lifetime Consumption" and shows Carlo’s income and consumption. The difference between income and consumption in Carlo’s working years is his saving. Notice the rectangles labeled “saving” and “dissaving.” One way of understanding his lifetime budget constraint is that these two rectangles must be equal in area.
Figure 28.3 Lifetime Consumption and Saving
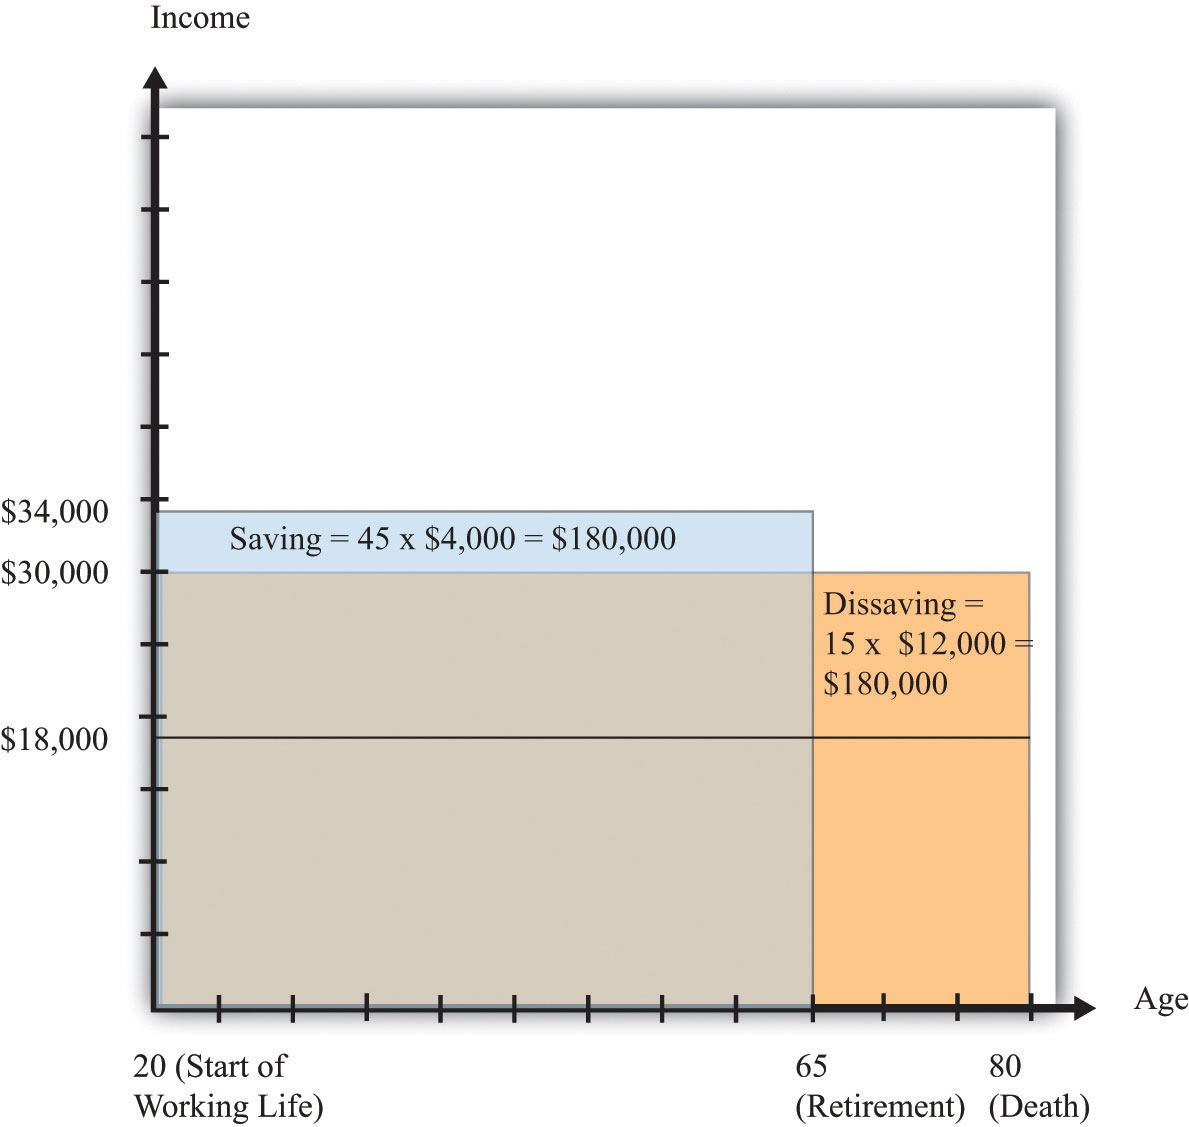
During his 45 working years, Carlo saves $4,000 per year. During his 15 retirement years, Carlo dissaves at a rate of $12,000 per year.
Figure 28.4 "Lifetime Wealth Accumulation" shows his wealth over his lifetime. It increases from zero to $180,000 and then decreases again to zero. The fact that he ends his life with exactly zero wealth is just another way of saying that he exactly satisfies his lifetime budget constraint.
Figure 28.4 Lifetime Wealth Accumulation
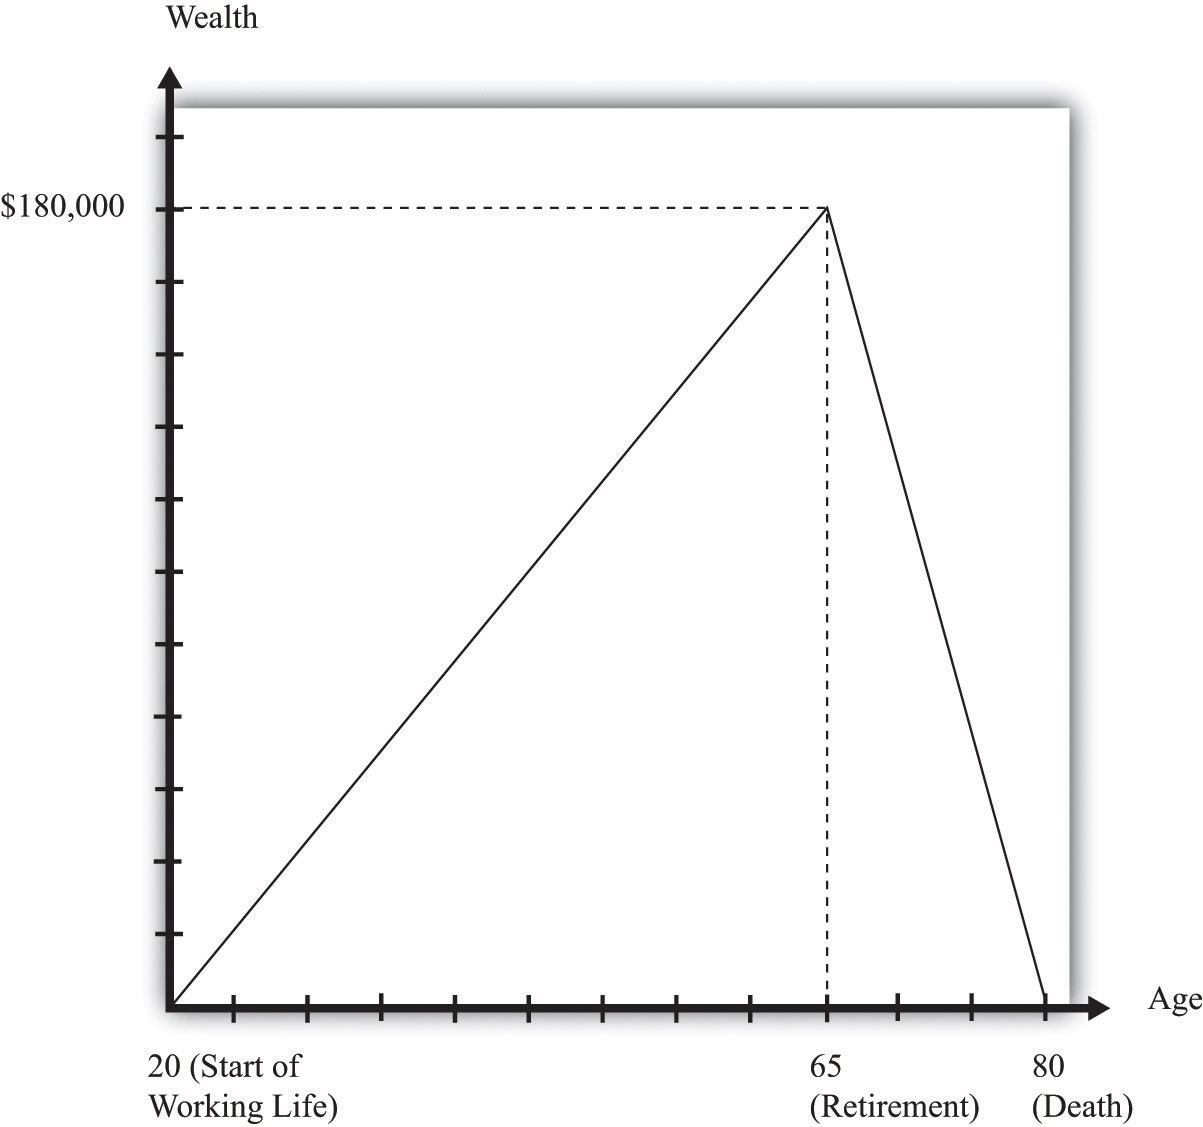
Over his working life, Carlo builds up his stock of wealth, so he has $180,000 in his bank account when he retires. During retirement, he dissaves, exactly using up the $180,000 he accumulated while working.
Social Security: The Government’s View
Now let us shift perspective and examine the Social Security system from the perspective of the government. The original intention was that Social Security would be (approximately) pay-as-you-go. Under a strict pay-as-you-go system, the inflows to the government in the form of tax revenues are exactly balanced by outflows to retired people. In any given year, in other words, the government takes money from those that are working and transfers all that money—not a cent more, not a cent less—to those who are retired.
Under this system the government does not maintain any kind of “savings accounts” for individuals: it taxes you when you work and transfers the revenues to retirees at the same time. The government promises to make payments to you after you retire, with these payments being financed by those who will then be working.
Let us pause for a moment here. We have to determine how to capture transfers across different generations in the economy in as simple a setup as possible. The easiest way to do this is to suppose that everyone in the economy is just like Carlo. That is, every working person in the economy earns $40,000 and pays $6,000 into the Social Security system. Every retired person receives a Social Security payment of $18,000 per year.
Let us further suppose that there is the same number of people of every age in the economy. In each year the same number of people is born, and—like Carlo—they all live to exactly the age of 80. Like Carlo, everyone works for 45 years (from age 20 to 65) and is retired for 15 years (from age 65 to 80). If we wanted to calibrate this roughly to the US economy (that is, make the numbers in the example a bit more realistic), we might suppose that there are 4 million people born every year. Since everyone lives to the same age, this means that there are 4 million 20-year-olds, 4 million 21-year-olds, and so forth, up to 4 million 79-year-olds. (This implies a total population of 320 million, which is close to the size of the actual US population.)
Having made these simplifications, it is a short step to realize that we might as well just suppose that there is only one person of each age. The basic structure of the economy will be the same, but the math will be much easier. (If you can prefer, though, you can multiply both sides of every equation that follows by 4 million.)
Given this demography, what do the government finances look like? Every year, the government collects $6,000 each in Social Security revenues from 45 working people, so that the total revenues are given by the following equation:
Social Security revenues = 45 × $6,000 = $270,000.Meanwhile, the government pays out $18,000 each year to 15 people:
Social Security payments = 15 × $18,000 = $270,000.You can see that we have chosen the numbers for our example such that the Social Security system is in balance: revenues equal receipts. A system like this one would indeed be pay-as-you-go.
The Effect of a Change in Social Security Benefits
Now, what would happen in this example if the government decided it wanted to increase Social Security payments by $3,000 per year? The total increase in payments would equal $45,000 since all 15 retired individuals would receive the extra $3,000. If the government is required to keep the Social Security system in balance, then it would also be obliged to increase Social Security contributions by $1,000 per worker (since there are 45 workers). How would Carlo (and everybody else like him) feel about this change?
Remember that Carlo had income before Social Security of $40,000 per year and had to pay $6,000 per year in Social Security contributions. Now he will have to pay $7,000 in contributions, so his income after tax is equal to $33,000. In his retirement years, however, Carlo will now get $21,000 a year instead of $18,000. His lifetime resources are therefore as follows:
lifetime income = ($33,000 × 45) + ($21,000 × 15) = $1,485,000 + $315,000 = $1,800,000.Carlo’s lifetime resources are exactly the same as they were before. Of course, this means that Carlo would choose exactly the same amount of consumption as before: $30,000 a year. However, his saving behavior would be different. He would now only save $3,000 a year. At the time of retirement, he would have saved a total of $135,000. Over the remaining 15 years of his life, Carlo would draw on his savings at the rate of $9,000 per year, which—combined with his Social Security payment of $21,000—would ensure that he had $30,000 to spend in his retirement years. His saving and dissaving are illustrated in Figure 28.5 "Lifetime Consumption and Saving".
Figure 28.5 Lifetime Consumption and Saving
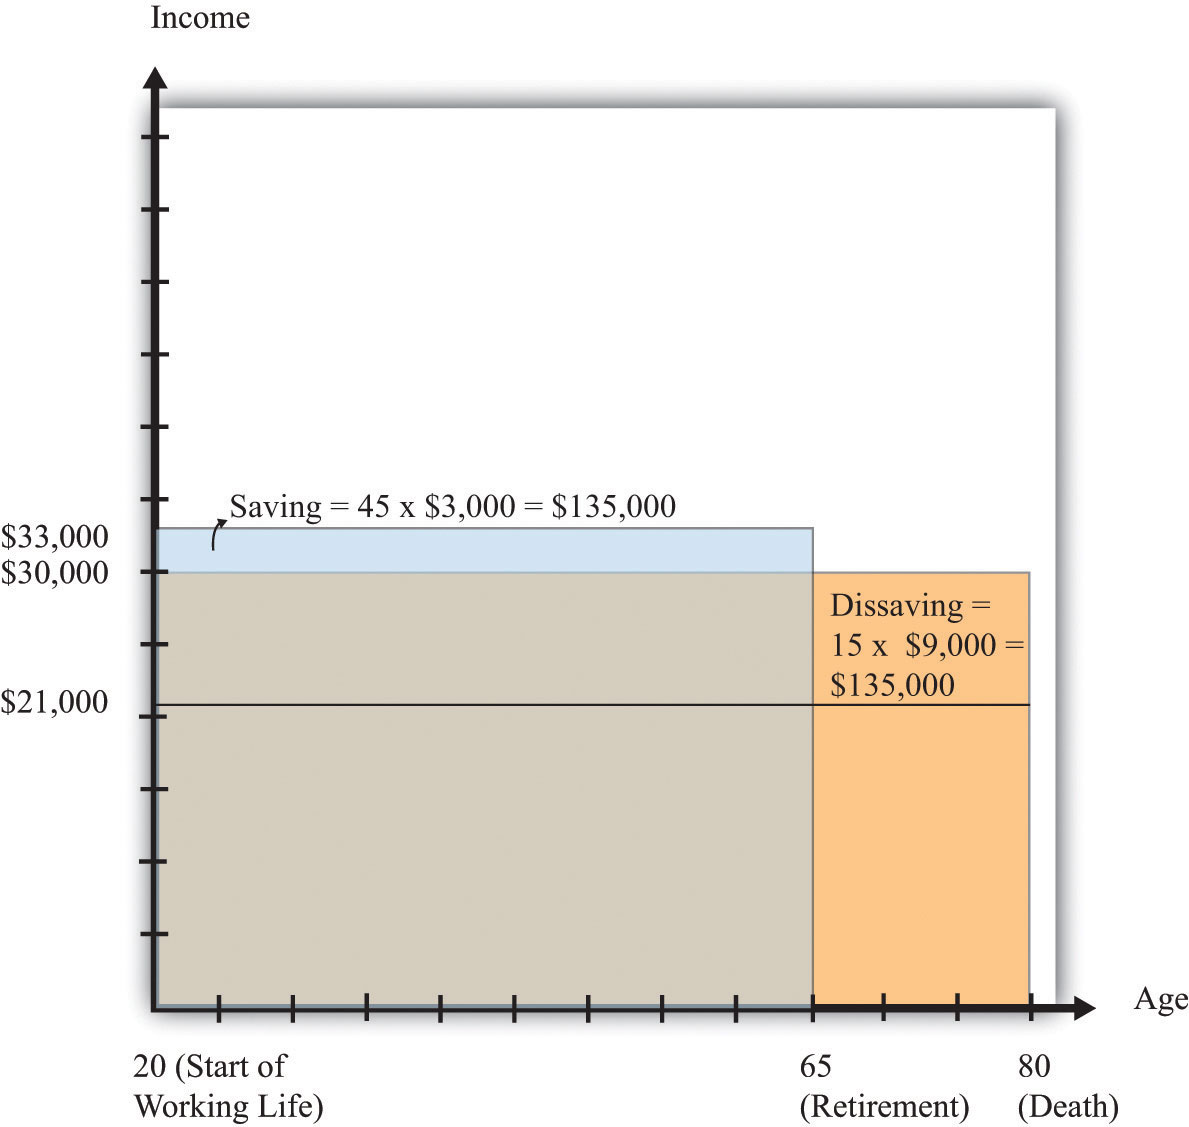
For his 45 working years, Carlo saves $3,000 a year. For his 15 retirement years, Carlo dissaves at a rate of $9,000 a year.
We have discovered a rather remarkable conclusion: the change in the government’s Social Security scheme has no effect on Carlo’s lifetime resources or lifetime consumption. From Carlo’s point of view, the change means that the government is saving more on Carlo’s behalf, and therefore he does not need to save so much for himself. Carlo’s saving declines by exactly the same amount as the increase in Social Security taxes ($1,000) per year; likewise, his dissaving declines by exactly the same amount as the increase in Social Security payments.
Another example is even more striking. Suppose there were no Social Security system at all. Then Carlo would receive $40,000 a year for 45 years but nothing at all in his retirement years. His lifetime resources would equal
lifetime income = $40,000 × 45 = $1,800,000,which is again the same as before. To enjoy lifetime consumption of $30,000 a year, Carlo would save $10,000 in every working year and dissave $30,000 in every retirement year.
These numerical examples suggest an extraordinary conclusion: Social Security seems to be completely irrelevant for Carlo. No matter what the scheme looks like, Carlo has the same lifetime resources and same lifetime consumption. This is an amazing and perhaps even shocking finding. We have used some economics to analyze one of the most important government programs, one that is a source of constant scrutiny and debate (and, not incidentally, requires substantial resources for its administration). Not only have we found no reason to expect a crisis in Social Security, we have found that it is irrelevant.
Should we now pack up and go home, saying that “economists have analyzed Social Security and it is actually a nonissue”? We hope it is obvious that the answer is no. After all, all we have done so far is present a numerical example. The example suggests that Social Security might be irrelevant under certain circumstances, but it certainly does not prove that it is irrelevant in general.
This is how economists very often work. A simple numerical example can help us understand the operation of a complicated system like Social Security and can lead to some suggestive conclusions. Our next task is to determine whether the conclusion from our example holds more generally. We will first see that the result does not depend only on the particular numbers that we chose. We will then try to understand exactly where the conclusion comes from.
Key Takeaways
- Households respond to variations in income over their lifetime through adjustments in saving to smooth consumption.
- In a pay-as-you-go system, the government’s payments to Social Security recipients exactly matches the revenues received from workers.
- The integration of the government and household budget constraints implies that in a pay-as-you-go system, Social Security influences household saving but leaves lifetime consumption and income unchanged.
Checking Your Understanding
- What uncertainties did Carlo face over his lifetime?
- In what parts of the discussion did we use the assumption that the real interest rate was zero?