This is “Global Prosperity and Global Poverty”, chapter 21 from the book Theory and Applications of Economics (v. 1.0). For details on it (including licensing), click here.
For more information on the source of this book, or why it is available for free, please see the project's home page. You can browse or download additional books there. To download a .zip file containing this book to use offline, simply click here.


Chapter 21 Global Prosperity and Global Poverty
Life Around the World
[…]
I thought about my new friend Mariya, her life and daily routine. She was married before I had my driver’s license. She pounded millet all day, sweating yet smiling. She hauled water from the well. She cooked. She birthed child after child. There was no end to the manual labor her life required. I liked to watch her. It was fascinating. But if hers was my life, I’d probably jump into that well.
I’ve always thought what life each soul is assigned to is a game of chance. I couldn’t help but to wonder what would have become of me had the powers that be had shaken those dice one more time on March 16, 1982, before moving the game piece that sent me to DePaul Hospital in St. Louis, Missouri.
If I had been born into Mariya’s life, would I have been able to hack it? If she had been born into my life, would she have been happier? […]Alexis Wolff, “Village Life—Niger,” February 27, 2005, accessed June 28, 2011, http://www.bootsnall.com/articles/05-02/village-life-niger.html.
In Niger, where Mariya lives, about 1 in 9 children die before their first birthday. Life expectancy at birth is 53 years, and less than 30 percent of the population can read and write. About one-fifth of the population is nomadic. An Oxfam study in 2005 found that nomads had recently lost about 70 percent of their animals, and that “almost one in ten families is surviving on a diet of mainly wild plants, leaves, and grass.”See “The World Factbook,” Central Intelligence Agency, accessed June 28, 2011, https://www.cia.gov/library/publications/the-world-factbook/index.html; and “Nomadic Way of Life in Niger Threatened by Food Crisis,” Oxfam America, August 16, 2005, accessed June 29, 2011, http://www.oxfamamerica.org/press/pressreleases/nomadic-way-of-life-in-niger-threatened-by-food-crisis. Real gross domestic product (real GDP)A measure of production that has been corrected for any changes in overall prices. per person in Niger is the equivalent of about $700 per year.
Call centers are a phenomenon that has taken over the young crowd of metros in India by a storm. Its implications are social, cultural and economic. It is a new society of the young, rich and free, selling the new dream of an independent life to the regular desi.
[…]
[C]heap labor in India owes its origin to the high rate of unemployment here. Hundreds of thousands of graduates are jobless and desperate for work in India.
[…]
Most call center jobs require a basic understanding of computers and a good grasp over English. And the urban youth of India are computer literate graduates with a command over English language. This is the ideal unskilled labor that the call center industry is looking for.
[…]
With its operations mainly during the night, the call centers offer an opportunity for the young to live a perpetual nocturnal life, a saleable idea to the youth. The fascination of the dark and the forbidden, is tremendous for the Indian youth, recently unleashed from the chains of tradition and culture. Because of this fascination, the industry has developed an air of revolution about itself. Not only is it cool to work for call centers, it is radical and revolutionary.
Just like the bikers subculture of the 60s and the flower children of the 70s, these call centerites also have their own lingo and a unique style of existence. Most of them are happy in a well paying monotonous job, reaping the benefits of technology, enjoying a life away from rush hour traffic and local trains. The moolah is good, the work is easy and life is comfortable.“The Indo-American Dream—Coming of Age with Call Center Jobs,” Mumbai Travel & Living Guide, accessed June 28, 2011, http://www.mumbaisuburbs.com/articles/call-centers-mumbai.html.
Life expectancy in India is 67 years, and the infant mortality rate is about 1 in 20. Real GDP per person is about $3,500.
More Americans own pets than ever before, and they're spending more money to keep them healthy, according to a survey released today by the American Veterinary Medical Association.
The number of U.S. households with pets climbed 7.6 million, to 59.5% of all homes, up from 58.3% in 2001. By comparison, about 35% of U.S. households have children, the Census Bureau says.
[…]
Pet owners are spending more on medical care. Veterinary expenditures for all pets were estimated at $24.5 billion in 2006. In inflation-adjusted dollars, Americans spent $22.4 billion in 2001.
This represents “the high-tech care that pet owners are demanding and willing to pay for,” DeHaven says. “Diseases that once would have been difficult to treat—diabetes, heart disease, cancer—today are very treatable. We’re even putting pacemakers in dogs.”Elizabeth Weiss, “We Really Love—and Spend on—Our Pets,” USA Today, December 11, 2007, accessed July 29, 2011, http://www.usatoday.com/life/lifestyle/2007-12-10-pet-survey_N.htm#.
In the United States, where spending on veterinary care for pets is considerably more than twice the entire GDP of Niger, the infant mortality rate is about 1 in 170, and life expectancy is about 78. Real GDP per person is more than 10 times greater than in India and almost 70 times greater than in Niger.
These stories are more than anecdotes. They are, in a real sense, representative of these three countries, as we can see by looking at economic data. Figure 21.1 "Real GDP per Person in the United States, India, and Niger" shows real GDP per person in India, the United States, and Niger over the 1960–2009 period.Alan Heston, Robert Summers, and Bettina Aten, “Penn World Table Version 6.2,” Center for International Comparisons of Production, Income and Prices at the University of Pennsylvania, September 2006, accessed June 29, 2011, http://pwt.econ.upenn.edu/php_site/pwt_index.php. The data in the Penn World Tables are constructed so that dollar figures for different countries can be legitimately compared. Specifically, the data are constructed on a purchasing power parity basis, meaning that they take into account the different prices of goods and services in different countries and are based on how much can actually be purchased. From part (a) of Figure 21.1 "Real GDP per Person in the United States, India, and Niger", we can see that GDP per person in the United States has grown substantially. On average, real GDP per person grew at 2 percent per year. Perhaps this doesn’t sound like a lot. Economic growth cumulates over time, however. An annual growth rate of 2 percent means that real GDP per person is about 2.6 times higher than half a century ago. To put it another way, each generation is roughly twice as rich as the previous generation. Although there are periods of high and low (sometimes even negative) growth in GDP per person, these fluctuations are overwhelmed by the overall positive growth in our economy. With this growth come many benefits: higher consumption, more varieties of goods, higher quality goods, better medical care, more enjoyable leisure time, and so on.
Figure 21.1 Real GDP per Person in the United States, India, and Niger
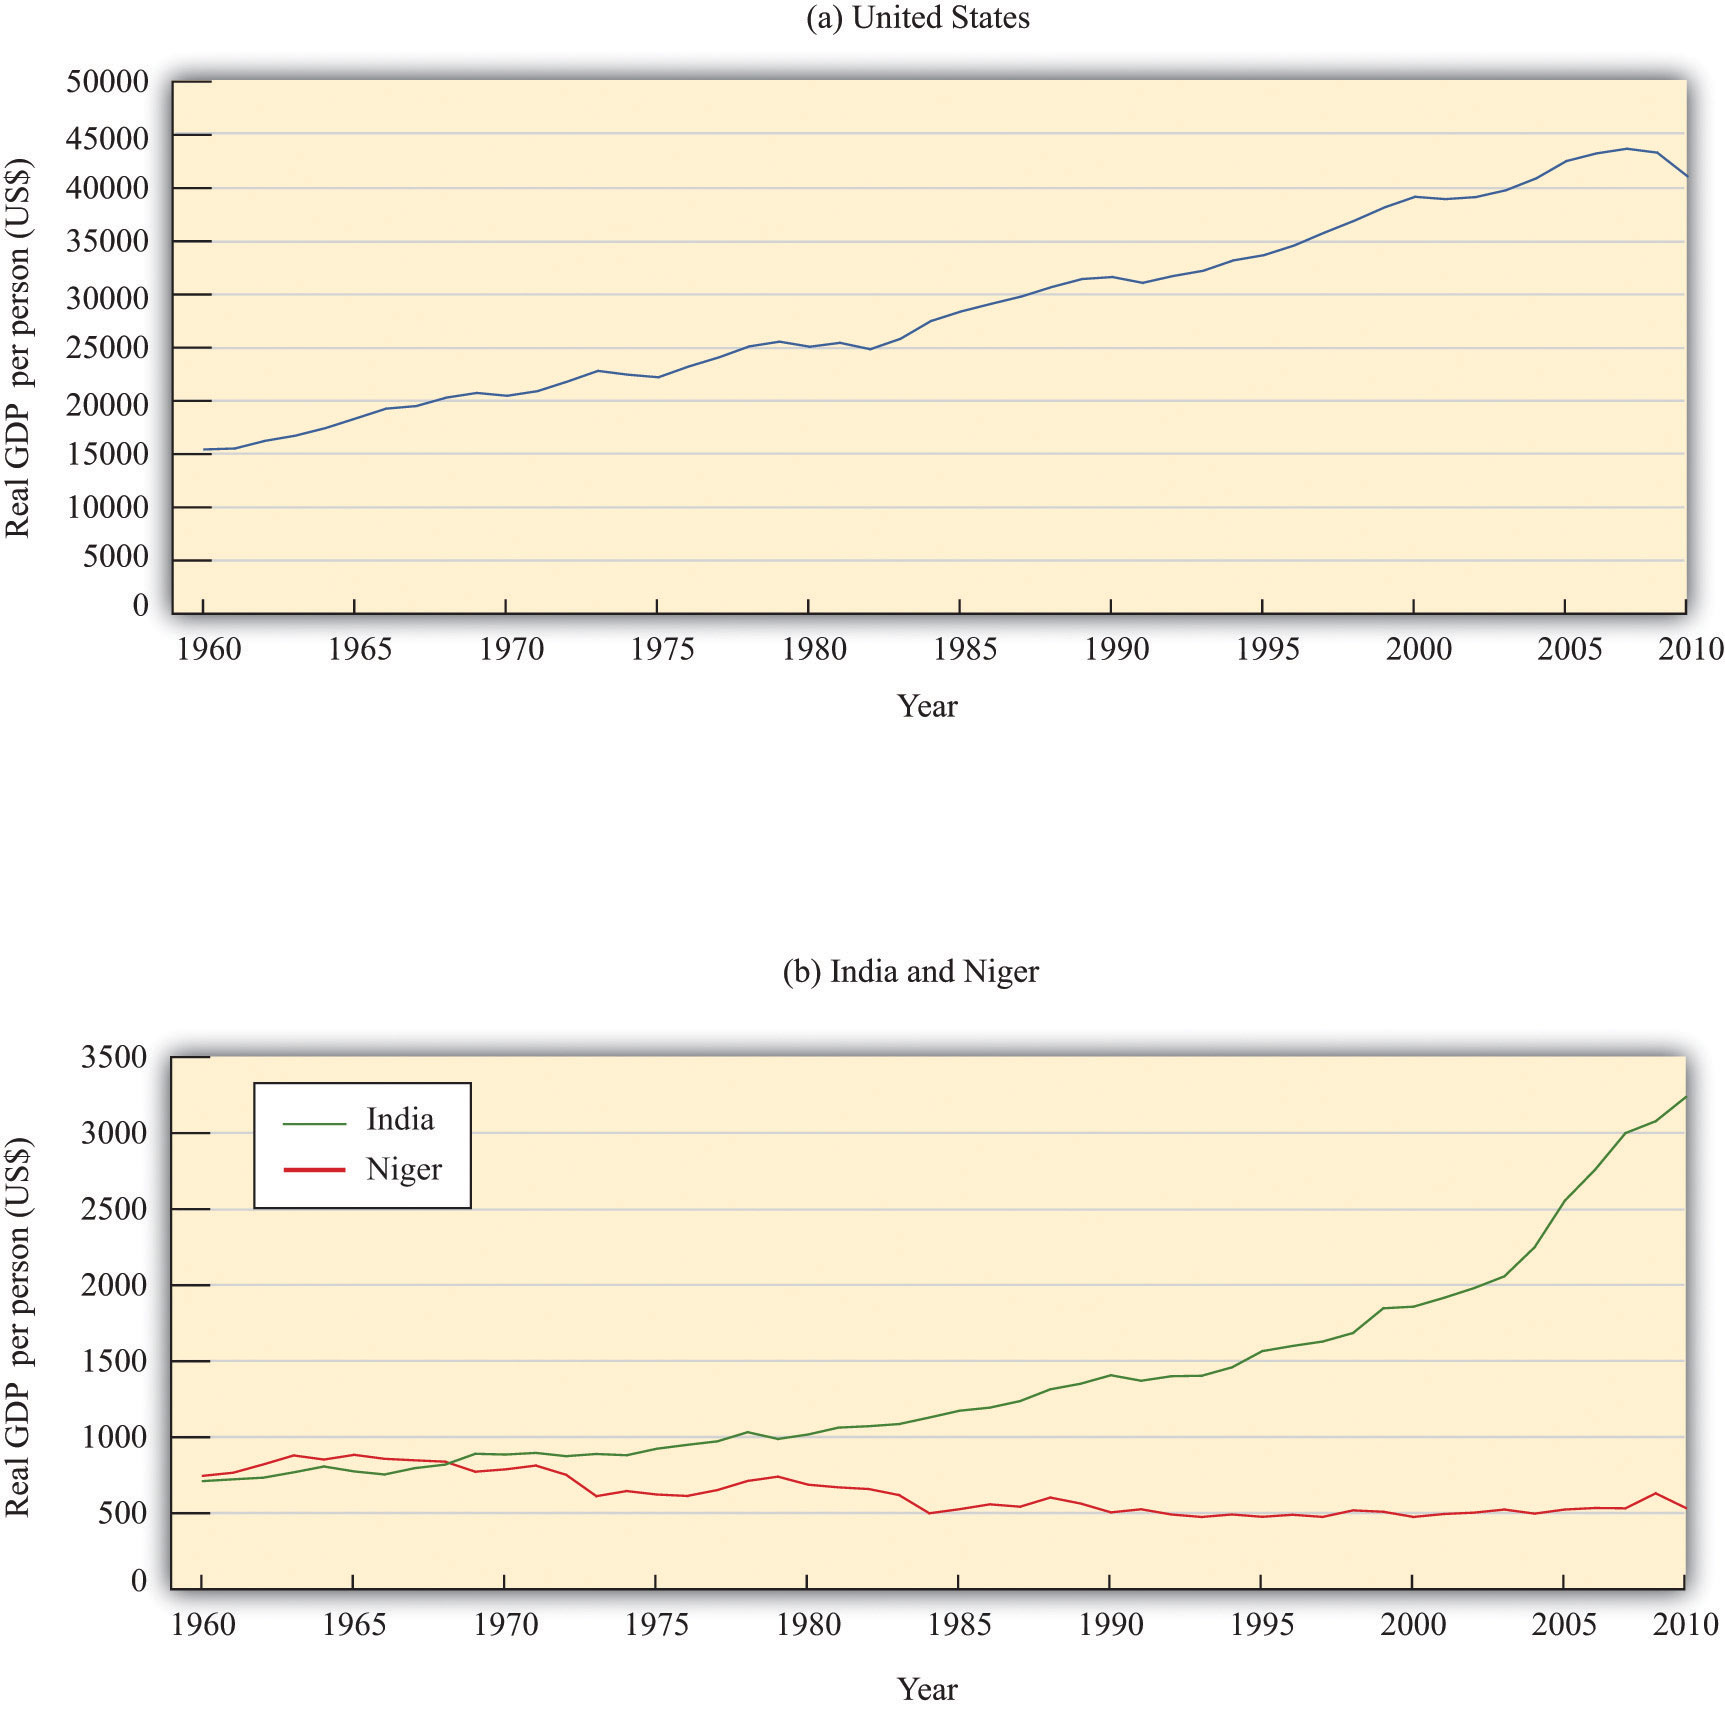
Real GDP per person in the United States (a) is substantially larger than (b) real GDP in India and Niger. The growth experiences of the three countries are also very different
Source: Alan Heston, Robert Summers and Bettina Aten, Penn World Table Version 7.0, Center for International Comparisons of Production, Income and Prices at the University of Pennsylvania, May 2011.
Part (b) of Figure 21.1 "Real GDP per Person in the United States, India, and Niger" shows real GDP per person for India and Niger. Notice first that the scale on this graph is very different. In 1960, real GDP per person in the United States was about $15,000 (measured in year 2005 dollars). In Niger and India, it was about 5 percent of the US figure—about $700 per person. The second striking feature of this graph is the very different performance of India and Niger. India, like the United States, has grown: GDP per person is much higher at the end of the sample than at the beginning. Indeed, India has grown faster than the United States: the average growth rate over the period was 3.1 percent. Over the last two decades, the difference is even starker: India has grown at about 4.4 percent per year on average. Nevertheless, the United States is still a lot richer than India.
By world standards, India is a long way from being the poorest country. In 1960, Niger was richer than India on a per person basis. But in the following half century, Niger became poorer, not richer. GDP per person decreased by almost 30 percent. India in 2009 was six times richer than Niger. Statistics on GDP are just that—statistics—and it is easy to look at graphs like these and forget that they are telling us about the welfare of human beings. But imagine for a moment that Niger had managed to grow like India, instead of collapsing as it did. People would not be surviving by eating grass, infants would be more likely to grow up to be adults instead of dying of preventable diseases, and children would be learning to read and write.
This is why the study of economic growth matters. And this is why, in this chapter, we take on arguably the most important question in the entire book.
Why are some countries rich and other countries poor?
Along the way, we tackle two other closely related questions. We want to know if the differences in income that we see in the world are likely to persist over time. The experiences of the United States, India, and Niger suggest that this question may not have a simple answer: India has been tending to catch up with the United States, but Niger has been falling further behind. As we seek to answer that question, we will also investigate the ultimate sources of economic growth:
Will poorer countries catch up to richer countries?
Why do countries grow?
Road Map
The big mystery we investigate in this chapter is the vast variation in economic performance from country to country. We want to know why the experiences of the United States, India, and Niger are so different from one another.
We begin this chapter with an extended story. We think about how growth would work in a country with just a single inhabitant. Then we turn to a back-of-the-envelope calculation to understand why countries differ so much in terms of economic performance. To understand these differences, we focus attention on different inputs to the production function, first considering physical capital and then looking at human capital and technology. After that, we develop a complete framework for understanding how and why economies grow in the very long run. Finally, we look at policy and international institutions.
21.1 The Single-Person Economy
Learning Objectives
After you have read this section, you should be able to answer the following questions:
- How does the capital stock increase?
- What are the factors that lead to output growth?
- What are the differences between growth in a closed economy and growth in an open economy?
The macroeconomy is very complicated. Overall economic performance depends on billions of decisions made daily by millions of people. Economists have developed techniques to keep us from being overwhelmed by the sheer scale of the economy and the masses of data that are available to us. One of our favorite devices is to imagine what an economy would look like if it contained only one person. This fiction has two nice features: we do not have to worry about differences among individuals, and we can easily isolate the most important economic decisions. Thinking about the economy as if it were a single person is only a starting point, but it is an extremely useful trick for cutting through all the complexities of, say, a $12 trillion economy populated by 300 million individuals.
Figure 21.2 The Aggregate Production Function
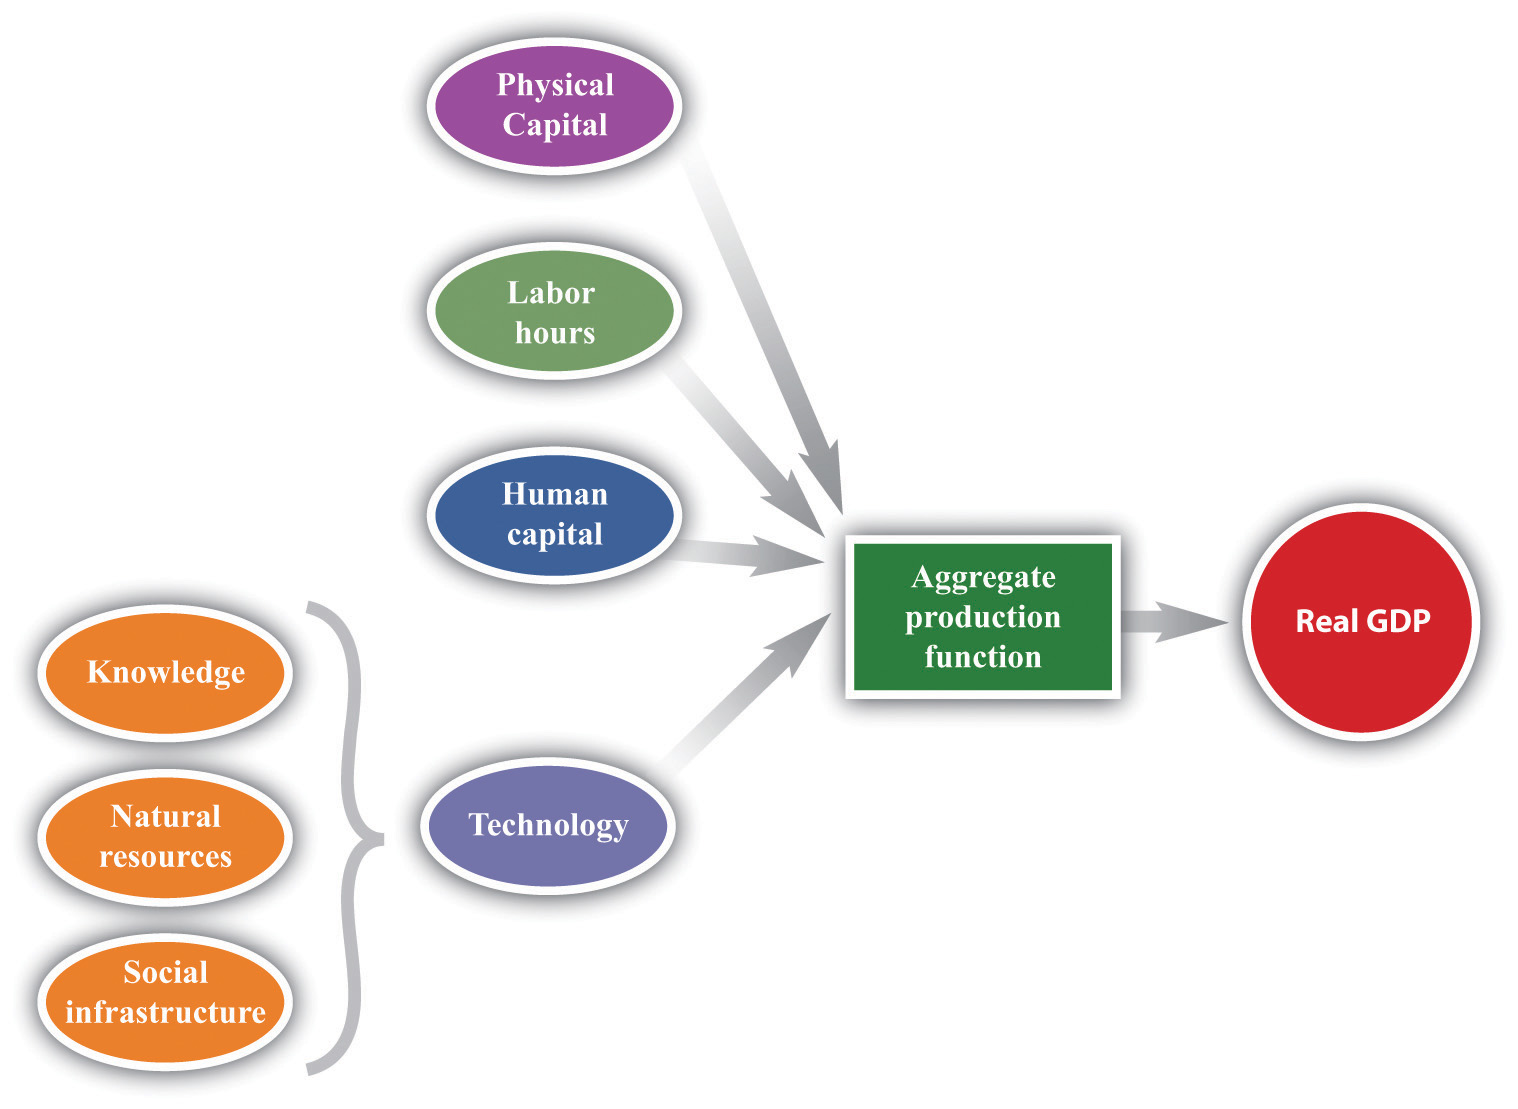
The aggregate production function combines an economy’s physical capital stock, labor hours, human capital, and technology to produce output (real gross domestic product [real GDP]).
Solovenia
Imagine, then, an economy called Solovenia. Solovenia is populated by one individual—we will call him Juan. Juan has access to an aggregate production function. The amount of output (real GDP) that he can produce depends on how large a physical capital stock he owns, how many hours he chooses to work, his human capital, and his technology (Figure 21.2 "The Aggregate Production Function"). Physical capital is the stock of factories and machinery in the economy, while human capital refers to the skills and education of the workforce. Technology is a catchall term for everything else (other than capital, labor, or human capital) that affects output.Physical capital, human capital, and technology are discussed in more detail in Chapter 20 "Globalization and Competitiveness". It includes the following:
- Knowledge. The technological know-how of the economy
- Social infrastructure. The institutions and social structures that allow a country to produce its real GDP
- Natural resources. The land and mineral resources in the country
Toolkit: Section 31.26 "The Aggregate Production Function"
You can review the aggregate production function, including its inputs, in the toolkit.
Much of our focus in this chapter is on how economies build up their stock of physical capital. Figure 21.3 "The Aggregate Production Function: Output as a Function of the Physical Capital Stock" shows how output in the aggregate production function depends on the capital stock. Increases in the capital stock lead to more output. If Juan has more tools to work with, then he can produce more goods. However, we usually think that the production function will exhibit diminishing marginal product of capital, which means that a given increase in the capital stock contributes more to output when the capital stock is low than when the capital stock is high. In Figure 21.3 "The Aggregate Production Function: Output as a Function of the Physical Capital Stock", we can see this from the fact that the production function gets flatter as the amount of physical capital increases.
Figure 21.3 The Aggregate Production Function: Output as a Function of the Physical Capital Stock
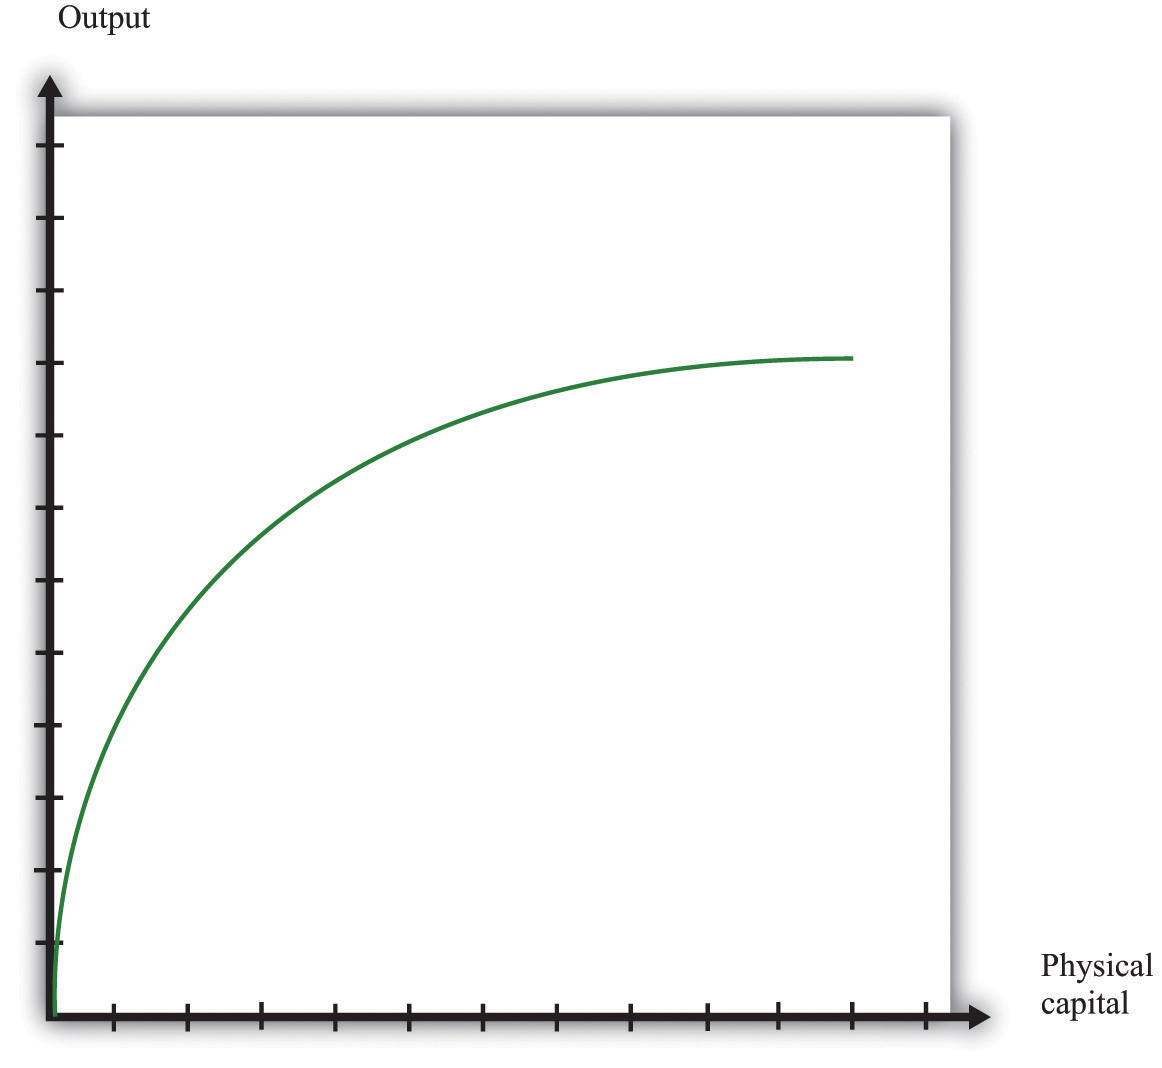
As the amount of physical capital increases, output increases, but at a decreasing rate because of the diminishing marginal product of capital.
Each day Juan chooses how much time to work and how much time to spend in leisure. Other things being equal, we expect that Juan likes to have leisure time. This is not to say that Juan never gets any satisfaction from working. But like most people—even those who enjoy their jobs—he would prefer to work a little bit less and play a little bit more. He cannot spend all his time in leisure, however. He works because he likes to consume. The harder he works, the more real GDP he can produce and consume. Juan’s decision about how many hours to work each day is determined in large part by how productive he can be—that is, how much real GDP he can produce for each hour of leisure time that he gives up.
Juan does not have to consume all the output that he produces; he might save some of it for the future. As well as deciding how much to work, he decides how much to consume and how much to save each day. You have probably made decisions like Juan’s. At some time in your life, you may have worked at a job—perhaps in a fast-food restaurant, a grocery store, or a coffee shop. Perhaps you were paid weekly. Then each week you might have spent all the money you earned on movies, meals out, or clothes. Or—like Juan—you might have decided to spend only some of that money and save some for the future. When you save money instead of spending it, you are choosing to consume goods and services at some future date instead of right now. You may choose to forgo movies and clothes today to save for the purchase of a car or a vacation.
The choice we have just described—consuming versus saving—is one of the most fundamental decisions in macroeconomics. It comes up again and again when we study the macroeconomy. Just as you and Juan make this choice, so does the overall economy. Of course, the economy doesn’t literally make its own decision about how much to save. Instead, the saving decisions of each individual household in the economy determine the overall amount of savings in the economy. And the economy as a whole doesn’t save the way you do—by putting money in a bank. An economy saves by devoting some of its production to capital goods rather than consumer goods. If Juan chooses to produce capital goods, he will have a larger capital stock in the future, which will allow him to be more productive and enjoy higher consumption in the future.
Growth in a Closed Economy
At any given moment, Juan’s ability to produce output is largely determined by his stock of physical capital, his human capital, and the state of technology in Solovenia. But, as time passes, the level of output in Solovenia can change through a variety of mechanisms.
First, the capital stock in Solovenia can grow over time, as shown in Figure 21.4. Juan builds up his capital stock by saving. Since Juan is the only inhabitant, the amount he saves is equal to the national savingsThe sum of private and government saving. of Solovenia. It is the difference between his output (real GDP of Solovenia) and the amount he consumes.In a real economy, national savings also include the savings of government: we must add in the government surplus or subtract the government deficit, as appropriate.
Figure 21.4
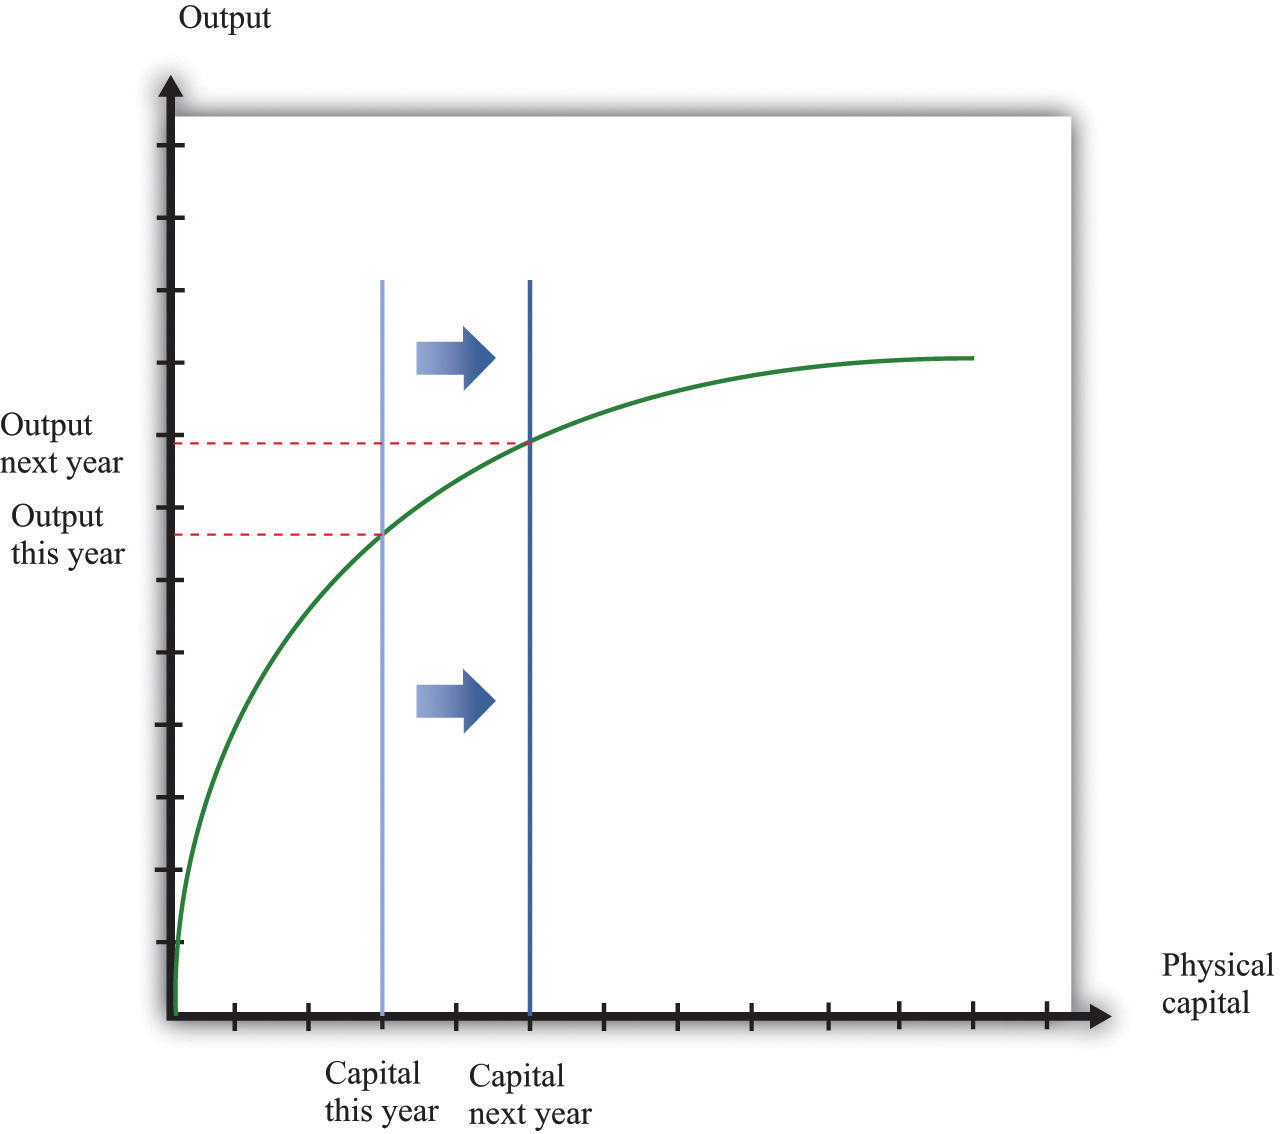
Increases in the capital stock lead to increases in output. If the capital stock in Solovenia increases between this year and next year, output also increases. Increases in the capital stock are one source of growth.
The more that Juan saves today, the more he can build up his capital stock, and the higher his future standard of living will be. If Juan chooses to consume less today, he will have a higher living standard in the future. If Juan chooses to consume more today, he must accept that this means less consumption in the future. Economies, like individuals, can choose between eating their cake now or saving it for the future.
In making this decision, Juan weighs the cost of giving up a little bit of consumption today against the benefit of having a little bit more consumption in the future. The higher the marginal product of capital, the more future benefit he gets from sacrificing consumption today. Other things being equal, a higher marginal product of capital induces Juan to save more. Juan’s choice also depends on how patient or impatient he is. The more patient he is, the more he is willing to give up consumption today to enjoy more consumption in the future.
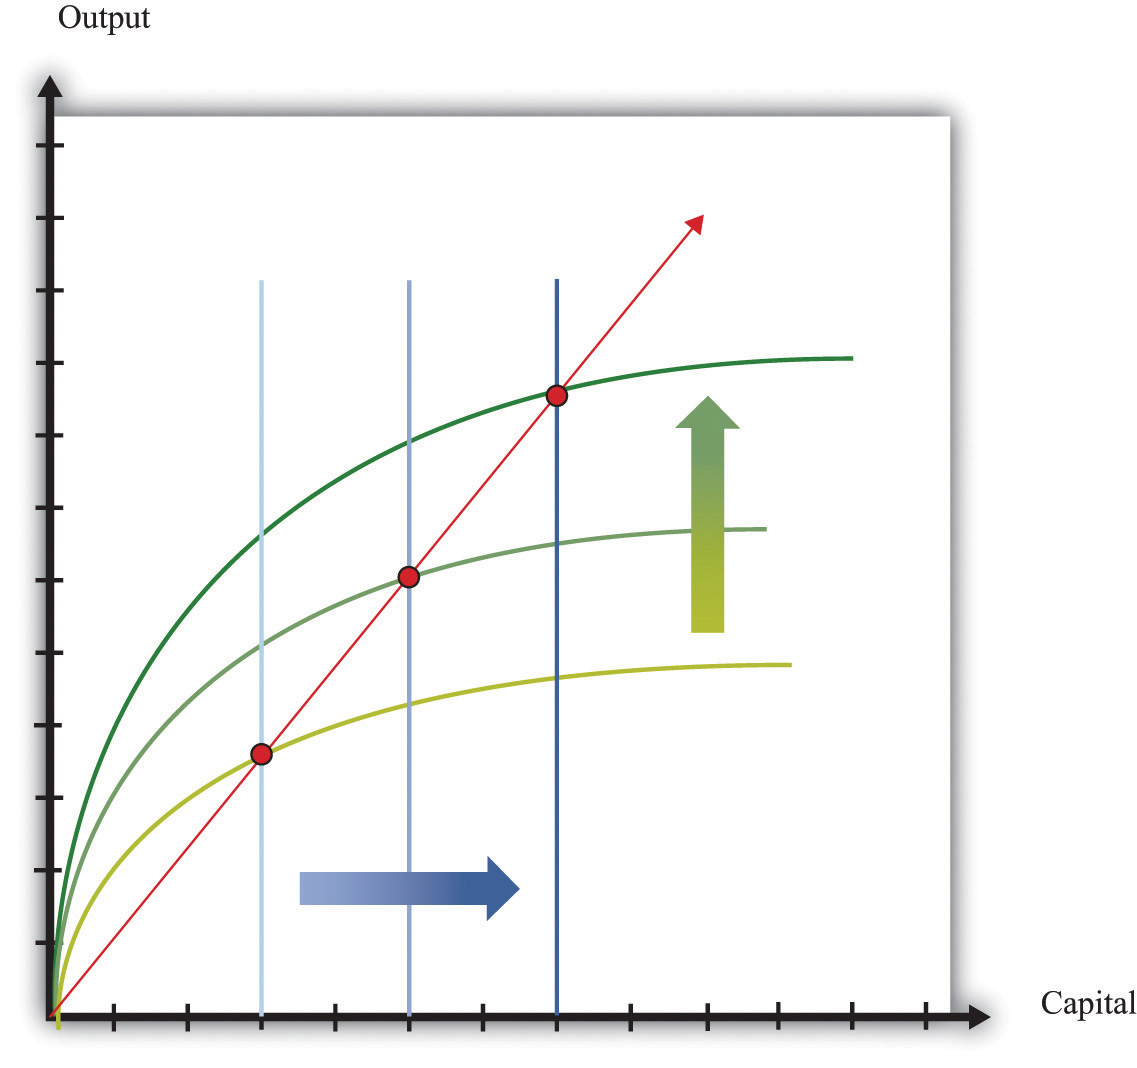
Increases in the amount of physical capital are one way in which an economy can grow. Another is through increases in human capital and technology. These shift the production function upward, as shown in Figure 21.5. Perhaps Juan sometimes has better ideas about how to do things. Perhaps he gets better with practice. Perhaps Juan spends some time trying to come up with better ways of producing things.
Figure 21.5
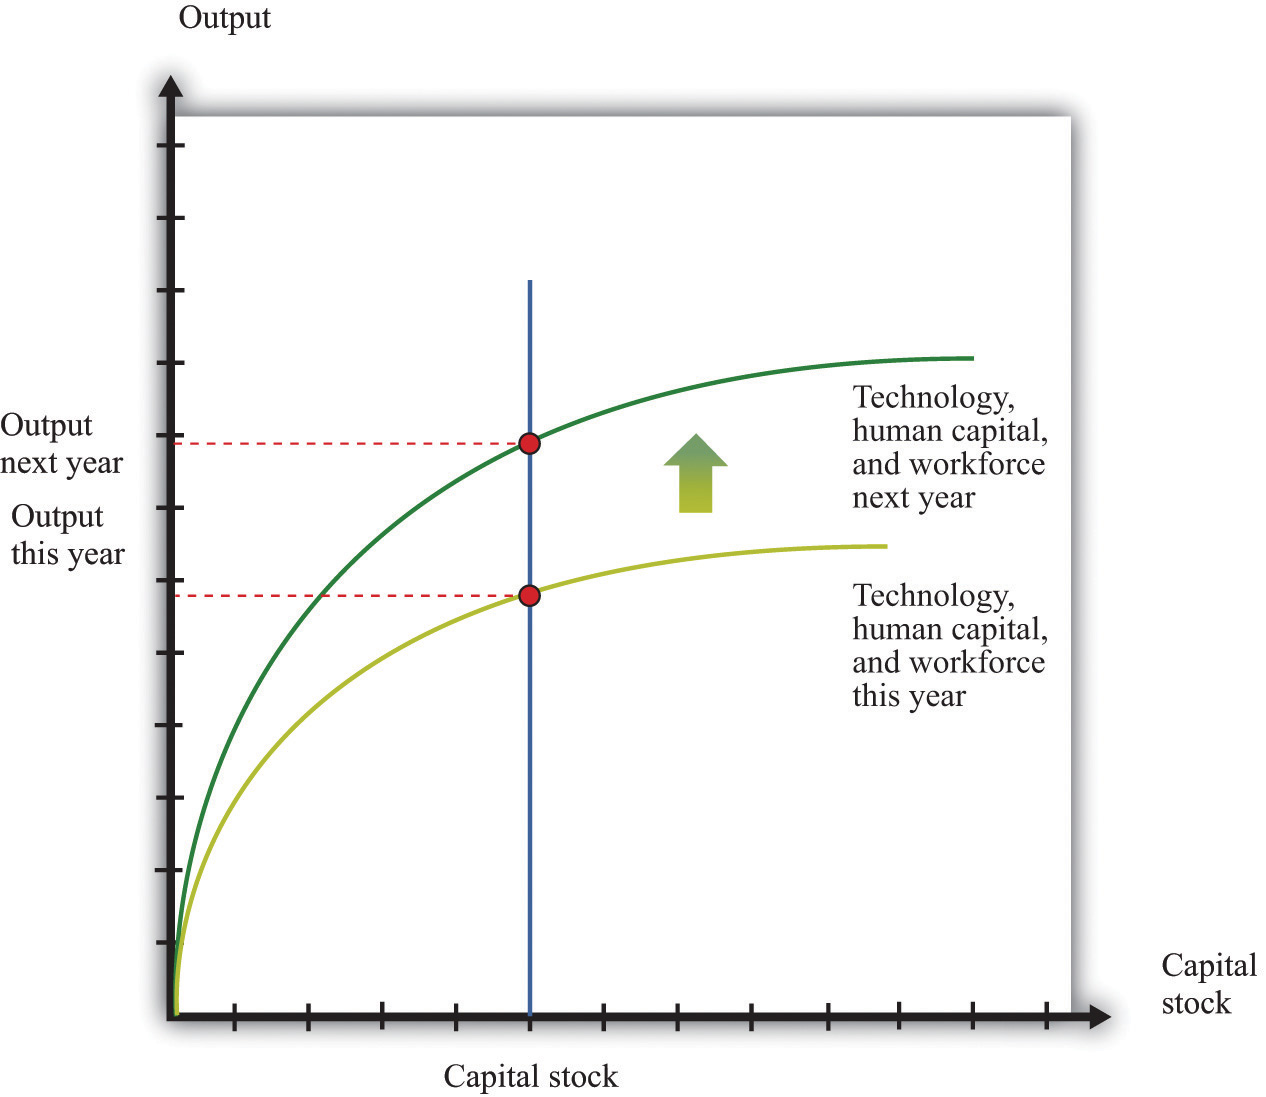
Increases in human capital or technology lead to increases in output. Increases in technology, human capital, and the workforce, like increases in the capital stock, are a source of output growth.
Through the accumulation of physical and human capital, and by improving the components of technology such as knowledge and social infrastructure, the output in Solovenia will grow over time. The combined effect of physical capital growth and improvements in technology is shown in Figure 21.6.
Figure 21.6
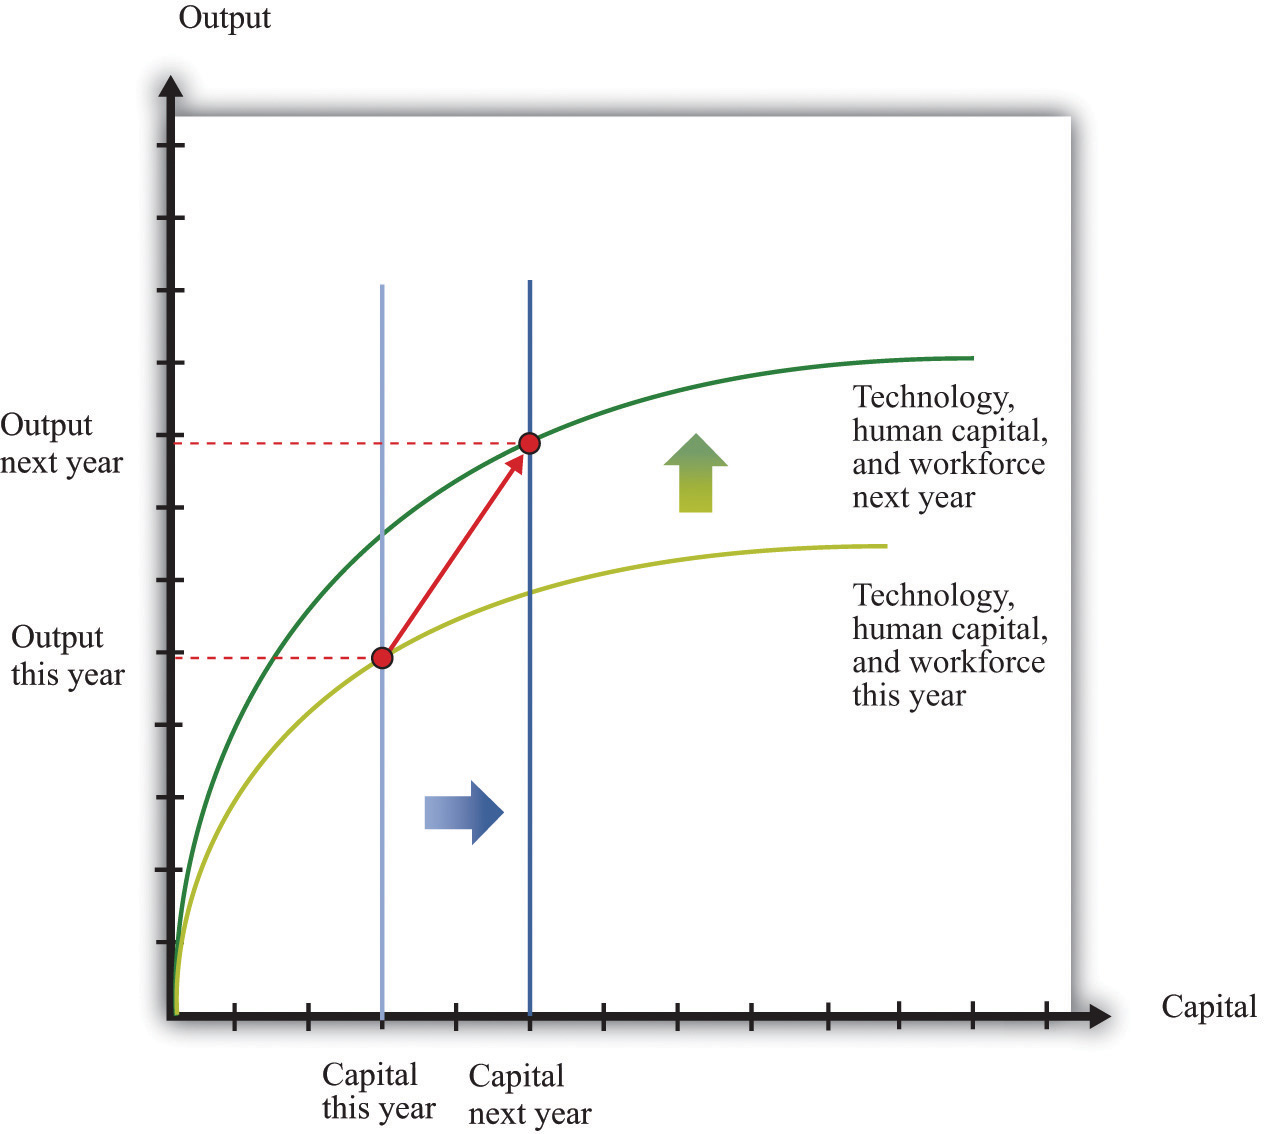
Increases in capital, human capital, and technology all lead to increases in output. In general, economies grow because of increases in capital, technology, human capital, and the workforce.
Growth in an Open Economy
If Juan does not trade with the rest of the world, his only way to save for the future is by building up his capital stock. In this case, national savings equal investmentThe purchase of new goods that increase capital stock, allowing an economy to produce more output in the future.. An economy that does not trade with other countries is called a closed economyAn economy that does not trade with the rest of the world.. An economy that trades with other countries is called an open economyAn economy that trades with other countries.. In the modern world, no economy is completely closed, although some economies (such as Belgium) are much more open than others (such as North Korea). The world as a whole is a closed economy, of course.
If Solovenia is an open economy, Juan has other options. He might decide that he can get a better return on his savings by investing in foreign assets (such as Italian real estate, shares of Australian firms, or Korean government bonds). Domestic investment would then be less than national savings. Juan is lending to the rest of the world.
Alternatively, Juan might think that the benefits of investment in his home economy are sufficiently high that he borrows from the rest of the world to finance investment above and beyond the amount of his savings. Domestic investment is then greater than national savings. Of course, if Juan lends to the rest of the world, then he will have extra resources in the future when those loans are repaid. If he borrows from the rest of the world, he will need to pay off that loan at some point in the future.
There may be very good opportunities in an economy that justify a lot of investment. In this case, it is worthwhile for an economy to borrow from other countries to supplement its own savings and build up the capital stock faster. Even though the economy will have to pay off those loans in the future, the benefits from the higher capital stock are worth it.
The circular flow of income shows us how these flows show up in the national accounts. If we are borrowing on net from other countries, there is another source of funds in additional to national savings that can be used for domestic investment. If we are lending on net to other countries, domestic investment is reduced.
Toolkit: Section 31.27 "The Circular Flow of Income"
You can review the circular flow of income in the toolkit.
Savings and investment in a country are linked, but they are not the same thing. The savings rate tells us how much an economy is setting aside for the future. But when studying the accumulation of capital in an economy, we look at the investment rateThe total investment as a fraction of GDP. rather than the savings rate. Total investment as a fraction of GDP is called the investment rate:
Figure 21.7 Investment Rates in the United States, India, and Niger
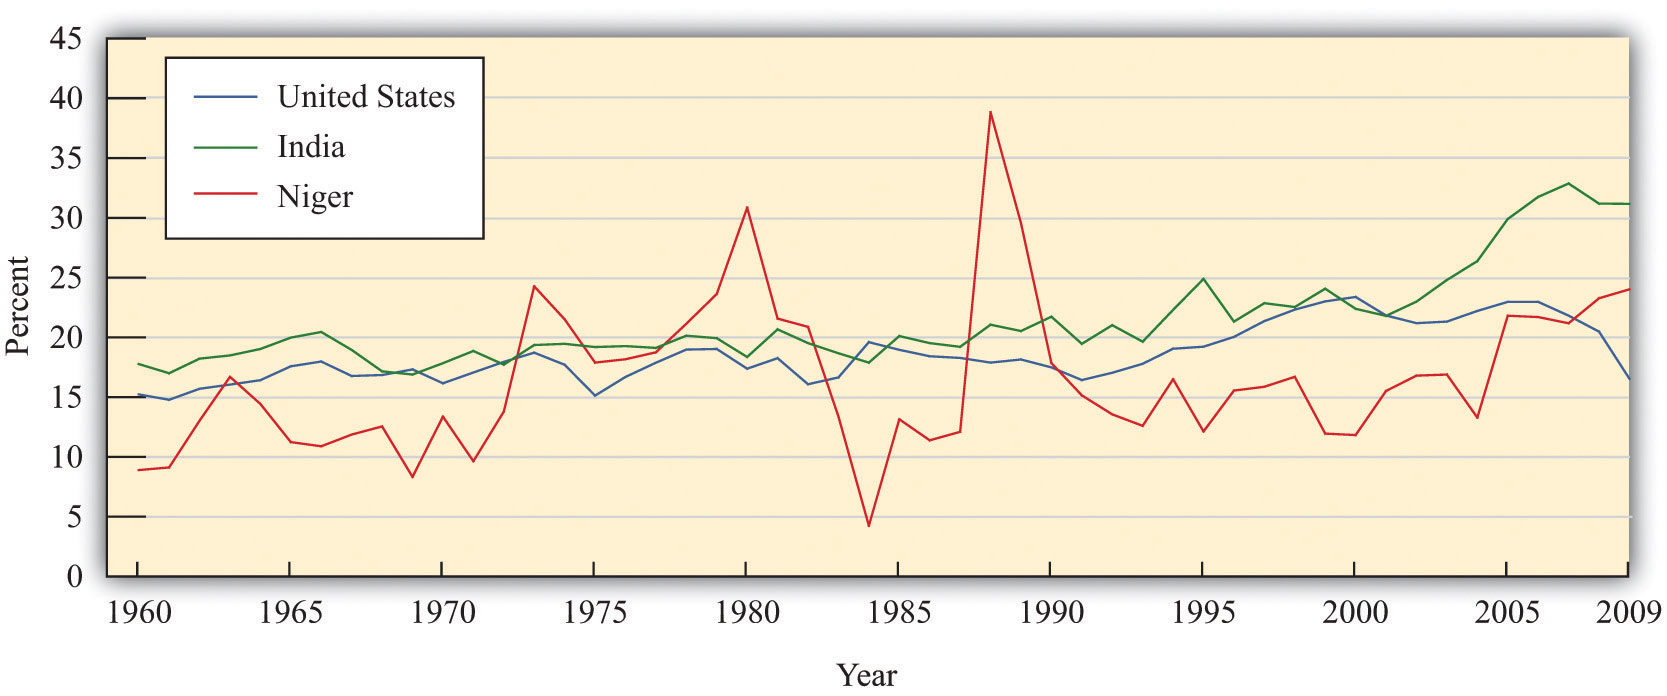
There are marked differences in investment rates in the United States, India, and Niger.
Source: Alan Heston, Robert Summers and Bettina Aten, Penn World Table Version 7.0, Center for International Comparisons of Production, Income and Prices at the University of Pennsylvania, May 2011.
Figure 21.7 "Investment Rates in the United States, India, and Niger" shows investment rates in the United States, India, and Niger from 1960 to 2009. A number of features of this picture are striking:International Monetary Fund, World Economic Outlook Database, April 2011, accessed July 29, 2011, http://www.imf.org/external/pubs/ft/weo/2011/01/weodata/index.aspx.
- For most of the period, India had a higher investment rate than the other two countries. As we saw earlier, India was also the fastest growing of the three countries. These facts are connected: capital accumulation plays an important role in the growth process.
- The investment rate in the United States has been relatively flat over time, though it has been noticeably lower in recent years.
- Investment rates in Niger have been more volatile than in the other two countries. They were low in the mid 1980s but have increased substantially in recent years.
Low investment rates may be due to low savings rates. They may also reflect relatively low returns to increases in the capital stock in a country. The low investment rate that prevailed for many years in Niger not only reflected a low saving rate but also indicates that something is limiting investment from external sources. For the United States, in contrast, a significant part of the high investment rate is due not to domestic savings but to inflows from other countries.
We know that output per person is a useful indicator of living standards. Increases in output per person generally translate into increases in material standards of living. But to the extent that an economy trades with other countries, the two are not equivalent. If an economy borrows to finance its investment, output per person will exaggerate living standards in the country because it does not take into account outstanding obligations to other countries. If an economy places some of its savings elsewhere, then measures of output per person will understate living standards.The national accounts deal with this issue by distinguishing between GDP, which measures the production that takes place within a country’s borders, and gross national product (GNP), which corrects for income received from or paid to other countries.
Solovenia and Solovakia
Now add another country, Solovakia (with a single inhabitant named Una), and compare it to Solovenia. We can compare Solovenia and Solovakia by investigating which is producing more output per person and why. Imagine, for example, that Solovenia is a relatively poor country, and Solovakia is richer. Using our knowledge of the aggregate production function, we can understand how this difference might arise. It might be because Una has more human capital or knowledge than Juan, or because Una has a larger stock of physical capital.
Another basis for comparison is the rate at which the two economies are growing. If Solovakia is richer, and if it is also growing faster than Solovenia, then the gap between the two countries will become wider over time. We call such a process divergenceA growth process where poor countries grow slower than rich countries.. Conversely, if Solovenia is growing faster than Solovakia, then the gap between Juan’s and Una’s living standards will become smaller over time. Such a situation, where poorer countries catch up to richer ones, is called convergenceA growth process where poor countries grow faster than rich countries..
Why might we see either convergence or divergence? Part of the answer has to do with the marginal product of capitalThe extra output obtained from one more unit of capital. in the two countries. Suppose that Solovakia is richer because it has a larger stock of physical capital than Solovenia. In that case, we expect the marginal product of capital to be larger in Solovenia. Solovenia is a more competitive economy than Solovakia. Juan will want to invest at home, while Una will take some of the output that she produces in Solovakia and invest it in Solovenia. Therefore we expect capital to migrate from Solovakia to Solovenia. As a consequence, it is likely that Solovenia will grow faster than Solovakia, leading to convergence.
Key Takeaways
- The capital stock increases through investment.
- Because physical capital is an input in the aggregate production function, growth in capital stock is one source of output growth. The other sources are the accumulation of human capital and increases in technology.
- In a closed economy, investment equals national savings. In an open economy, investment equals national savings plus inflows of funds from abroad. So in an open economy, growth in the capital stock and hence output growth can be financed both by domestic savings and borrowing from other countries.
Checking Your Understanding
- Draw a version of Figure 21.3 "The Aggregate Production Function: Output as a Function of the Physical Capital Stock" with labor hours instead of physical capital on the horizontal axis. Explain how the figure illustrates the positive marginal product of labor and diminishing marginal product of labor. How would you illustrate a change in the capital stock using this figure?
- Explain how an economy can have an investment rate of 10 percent but a savings rate of only 3 percent.
21.2 Four Reasons Why GDP Varies across Countries
Learning Objectives
After you have read this section, you should be able to answer the following questions:
- What are the main possible explanations for real GDP differences across countries?
- How important are differences in technology for explaining differences in real GDP across countries?
We started this chapter with the following question: “Why are some countries rich and other countries poor?” The aggregate production function and the story of Juan help us to understand what determines the amount of output that an economy can produce, taking us the first step toward explaining why some countries are richer than others.
The production function tells us that if we know four things—the size of the workforce, the amount of physical capital, the amount of human capital, and the level of technology—then we know how much output we are producing. When comparing two countries, if we find that one country has more physical capital, more labor, a better educated and trained workforce (that is, more human capital), and superior technology, then we know that country will have more output.
Differences in these inputs are often easy to observe. Large countries obviously have bigger workforces than small countries. Rich countries have more and better capital goods. In the farmlands of France, you see tractors and expensive farm machinery, while you see plows pulled by oxen in Vietnam; in Hong Kong, you see skyscrapers and fancy office buildings, while the tallest building in Burkina Faso is about 12 stories high; in the suburbs of the United States, you see large houses, while you see shacks made of cardboard and corrugated iron in the Philippines. Similarly, rich countries often have well-equipped schools, sophisticated training facilities, and fine universities, whereas poorer countries provide only basic education. We want to be able to say more, however. We would like to know how much these different inputs contribute to overall economic performance.
To get some sense of this, we look at some rough numbers for the United States, India, and Niger. We carried out this exercise using data from 2003, but the fundamental message does not depend on the year that we have chosen; we would get very similar conclusions with data from any recent year. To start, let us look at the different levels of output in these countries. Table 21.1 "Real GDP in the United States, India, and Niger" gives real gross domestic product (real GDP) in these countries. Note that we are now looking at the overall level of GDP, rather than GDP per person as we did at the beginning of this chapter. Real GDP in the United States was about $10.2 trillion. In India, real GDP was about one-third of US GDP: $3.1 trillion. In Niger, real GDP was under $10 billion. In other words, the United States produces about 1,000 times as much output as Niger.
Table 21.1 Real GDP in the United States, India, and Niger
| Country | Real GDP in 2003 (Billions of Year 2000 US Dollars) |
|---|---|
| United States | 10,205 |
| India | 3,138 |
| Niger | 9 |
Source: Alan Heston, Robert Summers and Bettina Aten, Penn World Table Version 7.0, Center for International Comparisons of Production, Income and Prices at the University of Pennsylvania, May 2011.
In the following subsections, we look at how the different inputs contribute to bring about these large differences in output. We go through a series of thought experiments in which we imagine putting the amount of each input available in the United States into the production functions for the Indian and Niger economies.
Differences in the Workforce across Countries
The United States, India, and Niger differ in many ways. One is simply the number of people in each country. The workforce in the United States is about 150 million people. The workforce in India is more than three times greater—about 478 million in 2010—while the workforce in Niger is only about 5 million people. Thus India has much more labor to put into its production function than does Niger.
In Table 21.2 "Real GDP in 2003 in the United States, India, and Niger if All Three Countries Had the Same Workforce" we look at what would happen to output in India and Niger if—counterfactually—each had a workforce the size of that in the United States while their other inputs were unchanged. Output in the United States is, of course, unchanged in this experiment. India’s output would decrease to about $1.4 trillion because they would have a smaller workforce. Niger’s output would increase about tenfold to $88 trillion. Differences in the workforce obviously matter but do not explain all or even most of the variation across the three countries. Niger’s output would still be less than 1 percent of output in the United States.
Table 21.2 Real GDP in 2003 in the United States, India, and Niger if All Three Countries Had the Same Workforce
| Country | Real GDP in 2003 (Billions of Year 2000 US Dollars) |
|---|---|
| United States | 10,205 |
| India | 1,475 |
| Niger | 88 |
Differences in Physical Capital across Countries
Not surprisingly, the United States also has a much larger capital stock than does Niger. The capital stock in the United States is worth about $30 trillion. India’s capital stock is about $3 trillion, and Niger’s capital stock is much, much smaller—about $9 billion. So what would happen if we also gave India and Niger the same amount of physical capital as the United States? Table 21.3 "Real GDP in the United States, India, and Niger if All Three Countries Had the Same Workforce and Physical Capital Stock" shows the answer.
India’s GDP, in this thought experiment, goes back to something close to its actual value of around $3 trillion. In other words, the extra capital compensates for the smaller workforce. Real GDP in the United States is still more than three times larger than that in India. The extra capital makes a big difference in Niger, increasing its output about ten-fold. Even if Niger had the same size workforce and the same amount of capital as the United States, however, it would still have only a tenth of the amount of output. The other two inputs—human capital and technology—evidently matter as well.
Table 21.3 Real GDP in the United States, India, and Niger if All Three Countries Had the Same Workforce and Physical Capital Stock
| Country | Real GDP in 2003 (Billions of Year 2000 US Dollars) |
|---|---|
| United States | 10,205 |
| India | 3,054 |
| Niger | 1,304 |
Differences in Human Capital across Countries
Differences in education and skills certainly help to explain some of the differences among countries. Researchers have found evidence that measures of educational performance are correlated with GDP per person. The causality almost certainly runs in both directions: education levels are low in Niger because the country is so poor, and the country is poor because education is low.
We can include measures of education and training in an attempt to measure the skills of the workforce. In fact, economists Robert Hall and Chad Jones have constructed a measure that allows us to compare the amount of human capital in different countries.To estimate relative human capital levels in different countries, we use the figures in Robert Hall and Chad Jones, “Why Do Some Countries Produce So Much More Output per Worker Than Others?” Quarterly Journal of Economics 114, no. 1 (1999): 83–116. In Table 21.4 "Real GDP in 2003 in the United States, India, and Niger if All Three Countries Had the Same Workforce, Physical Capital Stock, and Human Capital Stock", we bring the human capital level in India and Niger up to the level in the United States and, as before, suppose that all three countries have the same amount of labor and physical capital. Real GDP in India would climb to about $5.2 trillion, or a little over half the level in United States. Niger’s real GDP would equal about $2.8 trillion, meaning the increased human capital would more than double Niger’s GDP. However, real GDP in the United States would still be more than three times greater than that of Niger.
Table 21.4 Real GDP in 2003 in the United States, India, and Niger if All Three Countries Had the Same Workforce, Physical Capital Stock, and Human Capital Stock
| Country | Real GDP in 2003 (Billions of Year 2000 US Dollars) |
|---|---|
| United States | 10,205 |
| India | 5,170 |
| Niger | 2,758 |
Differences in Technology across Countries
To summarize, even after we eliminate differences in labor, physical capital, and human capital, much is still left to be explained. According to our production function, the remaining variation is accounted for by differences in technology—our catchall term for everything apart from labor, physical capital, and human capital.
Just as firms accumulate physical capital, they also accumulate knowledge in various ways. Large firms in developed countries develop new knowledge through the activities of their research and development (R&D) divisions.Gains in productivity of this form sometimes end up embodied in capital stock—think of a computer operating system, such as Windows or Linux. Such knowledge increases the value of capital stock and is already captured by looking at the ratio of capital stock to GDP. In poorer countries, firms may access existing knowledge by importing technology from more developed countries.
Differences in knowledge help to explain differences in output per worker. The rich countries of the world tend to have access to state-of-the-art production techniques. We say that they are on the technology frontierWhere the most advanced production technologies are available.; they use the most advanced production technologies available. Factories in poor countries often do not use these production techniques and lack modern machinery. They are inside the technology frontier.
As economists have researched the differences in economic performance in rich and poor countries, they have found that success depends on more than physical capital, human capital, and knowledge. Appropriate institutions—the social infrastructure—also need to be in place. These are institutions that allow people to hold property and write and enforce contracts that ensure they can enjoy the fruits of their investment. Key ingredients are a basic rule of law and a relative lack of corruption. An ability to contract and trade in relatively free markets is also important.
Particularly in more advanced countries, we need the right institutions to encourage technological progress. This is complicated because there is a trade-off between policies to encourage the creation of knowledge and policies to encourage the dissemination of knowledge. Knowledge is typically a nonexcludable goodA good (or resource) for which it is impossible to selectively deny access., so individuals and firms are not guaranteed the rights to new knowledge that they create. This reduces the incentive to produce knowledge. To counter this problem, governments establish certain property rights over new knowledge, in the form of patent and copyright laws. Knowledge is also typically a nonrival goodA good where one person’s consumption of that good does not prevent others from also consuming it., so everyone can, in principle, benefit from a given piece of knowledge. Once new knowledge exists, the best thing to do is to give it away for free. Patent and copyright laws are good for encouraging the development of knowledge but bad for encouraging the dissemination of knowledge. Current debates over intellectual property rights (file sharing, open source, downloading of music, etc.) reflect this trade-off.
Differences in natural resourcesOil, coal, and other mineral deposits; agricultural and forest lands; and other resources used in the production process. can also play a role in explaining economic performance. Some countries are lucky enough to possess large amounts of valuable resources. Obvious examples are oil-producing states such as Saudi Arabia, Kuwait, Venezuela, the United States, and the United Kingdom. Yet there are many countries with considerable natural resources that have not enjoyed great prosperity. Niger’s uranium deposits, for example, have not helped that country very much. At the same time, some places with very little in the way of natural resources have been very successful economically: examples include Luxembourg and Hong Kong. Natural resources help, but they are not necessary for economic success, nor do they guarantee it.
Key Takeaways
- Differences in real GDP across countries can come from differences in population, physical capital, human capital, and technology.
- After controlling for differences in labor, physical capital, and human capital, a significant difference in real GDP across countries remains.
Checking Your Understanding
- In Table 21.2 "Real GDP in 2003 in the United States, India, and Niger if All Three Countries Had the Same Workforce", Table 21.3 "Real GDP in the United States, India, and Niger if All Three Countries Had the Same Workforce and Physical Capital Stock", and Table 21.4 "Real GDP in 2003 in the United States, India, and Niger if All Three Countries Had the Same Workforce, Physical Capital Stock, and Human Capital Stock", the level of real GDP for the United States is the same as it is in Table 21.1 "Real GDP in the United States, India, and Niger". Why is this the case?
- What kinds of information would help you measure differences in human capital?
- How can human capital and knowledge flow from one country to another?
21.3 The Accumulation of Physical Capital
Learning Objectives
After you have read this section, you should be able to answer the following questions:
- What factors determine the growth rate of the capital stock?
- Will poorer countries catch up to richer countries because of faster growth of capital stock?
- What is the evidence on convergence?
- Why might countries not converge?
Our first task in this chapter was to explain the vast differences in living standards that we observe in the world. We now know that this variation is due to differences in physical capital, human capital, and technology. The rough calculations in Section 21.2 "Four Reasons Why GDP Varies across Countries" tell us that variations in physical capital, human capital, and technology all play a role in explaining differences in economic performance.
Now we consider these inputs separately. In this section, we look at the accumulation of physical capital. In Section 21.4 "Balanced Growth", we look at the role of human capital and technology. Our main aim is to consider one of our two remaining questions:
Will poorer countries catch up to richer countries?
The Growth Rate of the Capital Stock
Capital goods are goods such as factories, machines, and trucks. They are used for the production of other goods and are not completely used up in the production process. Economies build up their capital stocks by devoting some of their gross domestic product (GDP) to new capital goods—that is, investment. As we saw in our discussion of Solovenia in Section 21.2 "Four Reasons Why GDP Varies across Countries", if a country does not interact much with other countries (that is, it is a closed economy) the amount of investment reflects savings within a country. In open economies, the amount of investment reflects the perceived benefits to investment in that country compared to other countries.
Capital goods wear out over time and have to be scrapped and replaced. A simple way to think about this depreciation is to imagine that a fraction of the capital stock wears out every year. A reasonable average depreciation rateThe fraction of the capital stock that wears out each year. for the US economy is 4 or 5 percent. To understand what this means, think about an economy where the capital stock consists of a large number of identical machines. A depreciation rate of 5 percent means that for every 100 machines in the economy, 5 machines must be replaced every year.The depreciation rate can be understood in terms of the average lifetime of a typical machine. For example, a depreciation rate of 5 percent is the same as saying that, on average, machines last for 20 years. To see this, imagine that capital stock is kept constant at 100 machines, and each machine lasts for 20 years. Imagine also that 5 machines are 1 year old, 5 machines are 2 years old, and so forth, with the oldest 5 machines being 20 years old. Each year, these 5 oldest machines would wear out (5 percent depreciation) and have to be replaced by 5 new machines. After a year has passed, the situation will be exactly the same as the previous year: there will be 5 machines that are 1 year old, 5 machines that are 2 years, and so forth. Mathematically, we are saying that the lifetime of a machine = 1/depreciation rate: 20 = 1/0.05.
The depreciation of capital goods reduces the capital stock. The total amount of capital lost to depreciation each year is calculated by multiplying the depreciation rate and the capital stock together. If the capital stock is $30 trillion, for example, and the depreciation rate is 5 percent, then $1.5 trillion (= $30 trillion × 0.05) worth of capital is lost each year.
The capital stock increases as long as there is enough new investment to replace the worn out capital and still contribute some extra. The overall change in the capital stock is equal to new investment minus depreciation:
change in capital stock = new investment − depreciation rate × capital stock.For example, suppose that the current capital stock (measured in trillions of dollars) is 40, and the depreciation rate is 10 percent per year. Then the capital stock after depreciation is 40 − (.1 × 40) = 40 − 4 = 36. Suppose that new investment is $4.8 trillion. Then the new capital stock is 36 + 4.8 = 40.8. In this case, capital stock has increased by $0.8 trillion, or 2 percent.
The equation for the change in the capital stock is one of the fundamental ingredients of economic growth. It tells us that economies build up their capital stock—and therefore their real GDP—by devoting enough output to new investment to both replace worn out capital and then add some more. If we divide both sides of the previous equation by the capital stock, we can obtain the growth rateThe change in a variable over time divided by its value in the beginning period. of the capital stock. (Remember that the growth rate of a variable is the change in the variable divided by its initial level.)
The growth rate of the capital stock depends on three things:
- The amount of investment. The more investment the economy carries out, the more quickly the capital stock grows.
- The current capital stock. The larger the capital stock, other things being equal, the lower its growth rate.
- The depreciation rate. If existing capital wears out faster, the capital stock grows more slowly.
It is intuitive that a higher investment rate increases the growth rate of the capital stock, and a higher depreciation rate decreases the growth rate of the capital stock. It is less obvious why the growth rate of the capital stock is lower when the capital stock is higher. The growth rate measures the change in the capital stock as a percentage of the existing capital stock. A given change in the capital stock results in a smaller growth rate if the existing capital stock is larger. For example, suppose that the current capital stock is 100, and the change in the capital stock is 10. Then the growth rate is 10 percent. But if the current capital stock is 1,000, then the same change of 10 in the capital stock represents only a 1 percent growth rate.
Toolkit: Section 31.21 "Growth Rates"
The toolkit contains more information on how growth rates are calculated.
Convergence through Capital Accumulation
Why are we so interested in the accumulation of capital? One reason is that poverty of the kind we observe in Niger and elsewhere is a massive problem for the world. About 40 percent of the world’s population—close to 2.5 billion people—live in conditions of poverty. (The World Bank defines poverty as living on less than US$2 per day.) We are not going to solve the problem of mass poverty overnight, so we would like to know whether this gap between the rich and the poor is a permanent feature of the world. It might be that economies will diverge, meaning that the disparities in living standards will get worse and worse, or it might be that they will converge, with poorer countries catching up to richer countries.
When comparing two countries, if we find that the poorer economy is growing faster than the richer one, then the two are converging. If we find that the richer country is growing faster than the poorer one, they are diverging. Moreover, if a country has a small capital stock, we know that—other things being equal—it will tend to be a poorer country. If a country has a large capital stock, then—again, other things being equal—it is likely to be a richer country. The question of convergence then becomes: other things being equal, do we expect a country with a small capital stock to grow faster than an economy with a large capital stock?
The answer is yes, and the reason is the marginal product of capital. From the production function, the marginal product of capital is large when the capital stock is small. Think again about Juan in Solovenia. A large marginal product of capital means that he can obtain a lot of extra output if he acquires some extra capital. This gives him an incentive to save rather than consume. A large marginal product of capital also means that Juan can attract investment from other countries.
A country where the marginal product of capital is high is a competitive economy—one where both domestic savers and foreign savers want to build up the capital stock. The capital stock will grow quickly in such an economy. This is precisely what we saw in the equation for the growth rate of the capital stock: higher investment and a lower capital stock both lead to a larger capital stock growth rate. Both of these imply that a country with a large marginal product of capital will tend to grow fast.
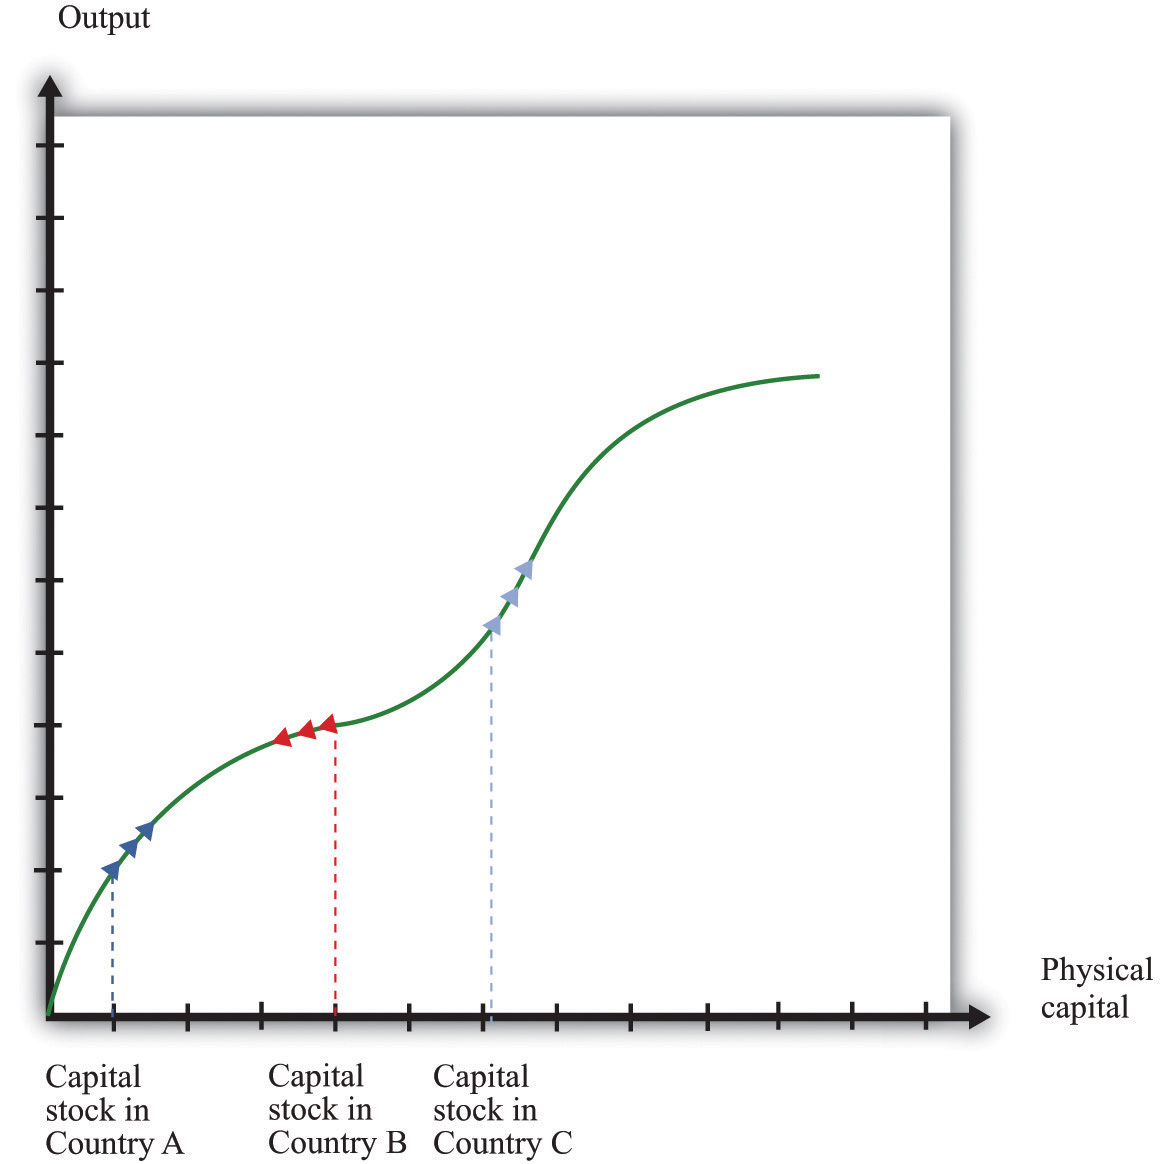
We illustrate this idea in Figure 21.8 "Convergence through the Accumulation of Capital". Country A has a small capital stock. The aggregate production function tells us that this translates into a large marginal product of capital—the production function is steep. In turn, a large marginal product of capital means that country A will grow quickly. Country B has an identical production function but a larger capital stock, so the marginal product of capital is lower in country B than in country A. There is less incentive to invest, implying that country B, while richer than country A, grows more slowly.
Figure 21.8 "Convergence through the Accumulation of Capital" also shows that it is possible for a country to have such a large capital stock that it shrinks rather than grows. Country C has so much capital that its marginal product is very low. There is little incentive to build up the capital stock, so the capital stock depreciates faster than it is replaced by new investment. In such an economy, the capital stock and output would decrease over time.
Figure 21.8 Convergence through the Accumulation of Capital
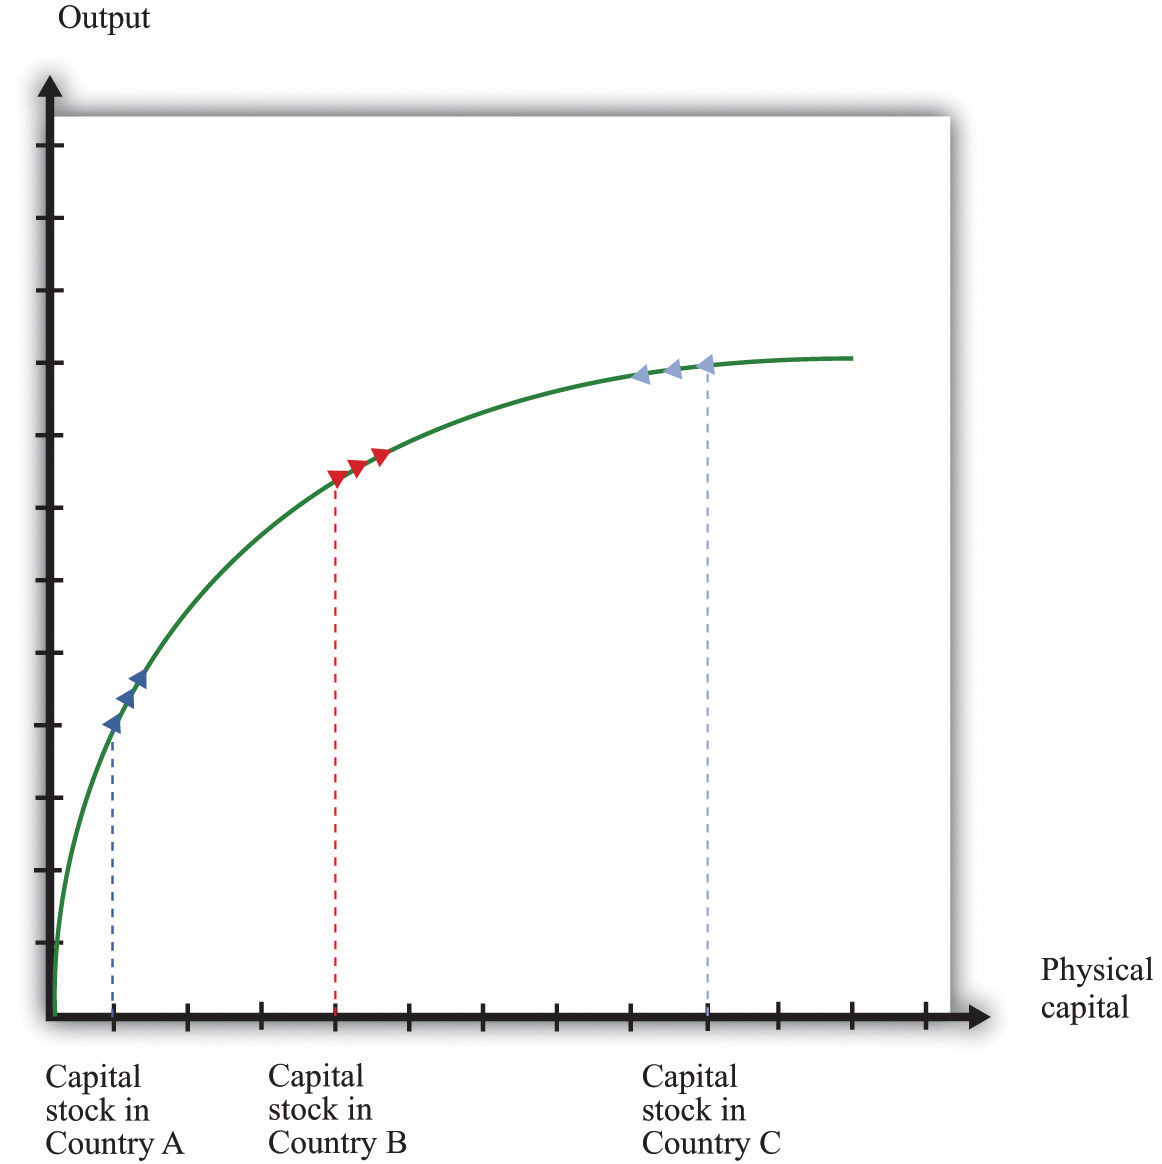
The growth rate of the capital stock depends on the marginal product of capital. Country A has little capital, so the marginal product of capital is large, and the capital stock will grow rapidly. Country B has more capital, so the capital stock grows more slowly. Country C has so much capital that the capital stock decreases.
Figure 21.8 "Convergence through the Accumulation of Capital" suggests an even stronger conclusion: all three economies will ultimately end up at the same capital stock and the same level of output—complete convergence. This conclusion is half right. If the three economies were identical except for their capital stocks and if there were no growth in human capital and technology, they would indeed converge to exactly the same level of capital stock and output. In Section 21.4 "Balanced Growth", we look at this argument more carefully. First, though, we examine the evidence on convergence.
Convergence or Divergence? Two Contrasting Pictures
Convergence is a very pretty theory but is it borne out by the evidence? Figure 21.9 "Some Evidence of Convergence" shows the growth experience of several countries in the second half of the 20th century. These countries are all members of the Organisation for Economic Co-operation and Development (OECD) and are, relatively speaking, rich.The countries are Australia, Austria, Belgium, Canada, Denmark, Finland, France, Iceland, Ireland, Italy, the Netherlands, Norway, Portugal, Spain, Switzerland, and the United States. The median real GDP per capita in 1950 for these countries was about $6,000, in year 1996 dollars. Data for Figure 21.9 "Some Evidence of Convergence" and Figure 21.10 "Some Evidence of Divergence" come from Alan Heston, Robert Summers, and Bettina Aten, “Penn World Table Version 6.2,” Center for International Comparisons of Production, Income and Prices at the University of Pennsylvania, September 2006, accessed June 29, 2011, http://pwt.econ.upenn.edu/php_site/pwt_index.php. Figure 21.9 "Some Evidence of Convergence" shows real GDP per person in these countries relative to the United States (the United States itself is the horizontal line near the top of the figure.) Figure 21.9 "Some Evidence of Convergence" does show some evidence of convergence. Countries with higher levels of real GDP person in 1950 tended to grow more slowly than countries with lower levels of real GDP per person. Poorer countries in this group tended to catch up with richer countries.
Figure 21.9 Some Evidence of Convergence
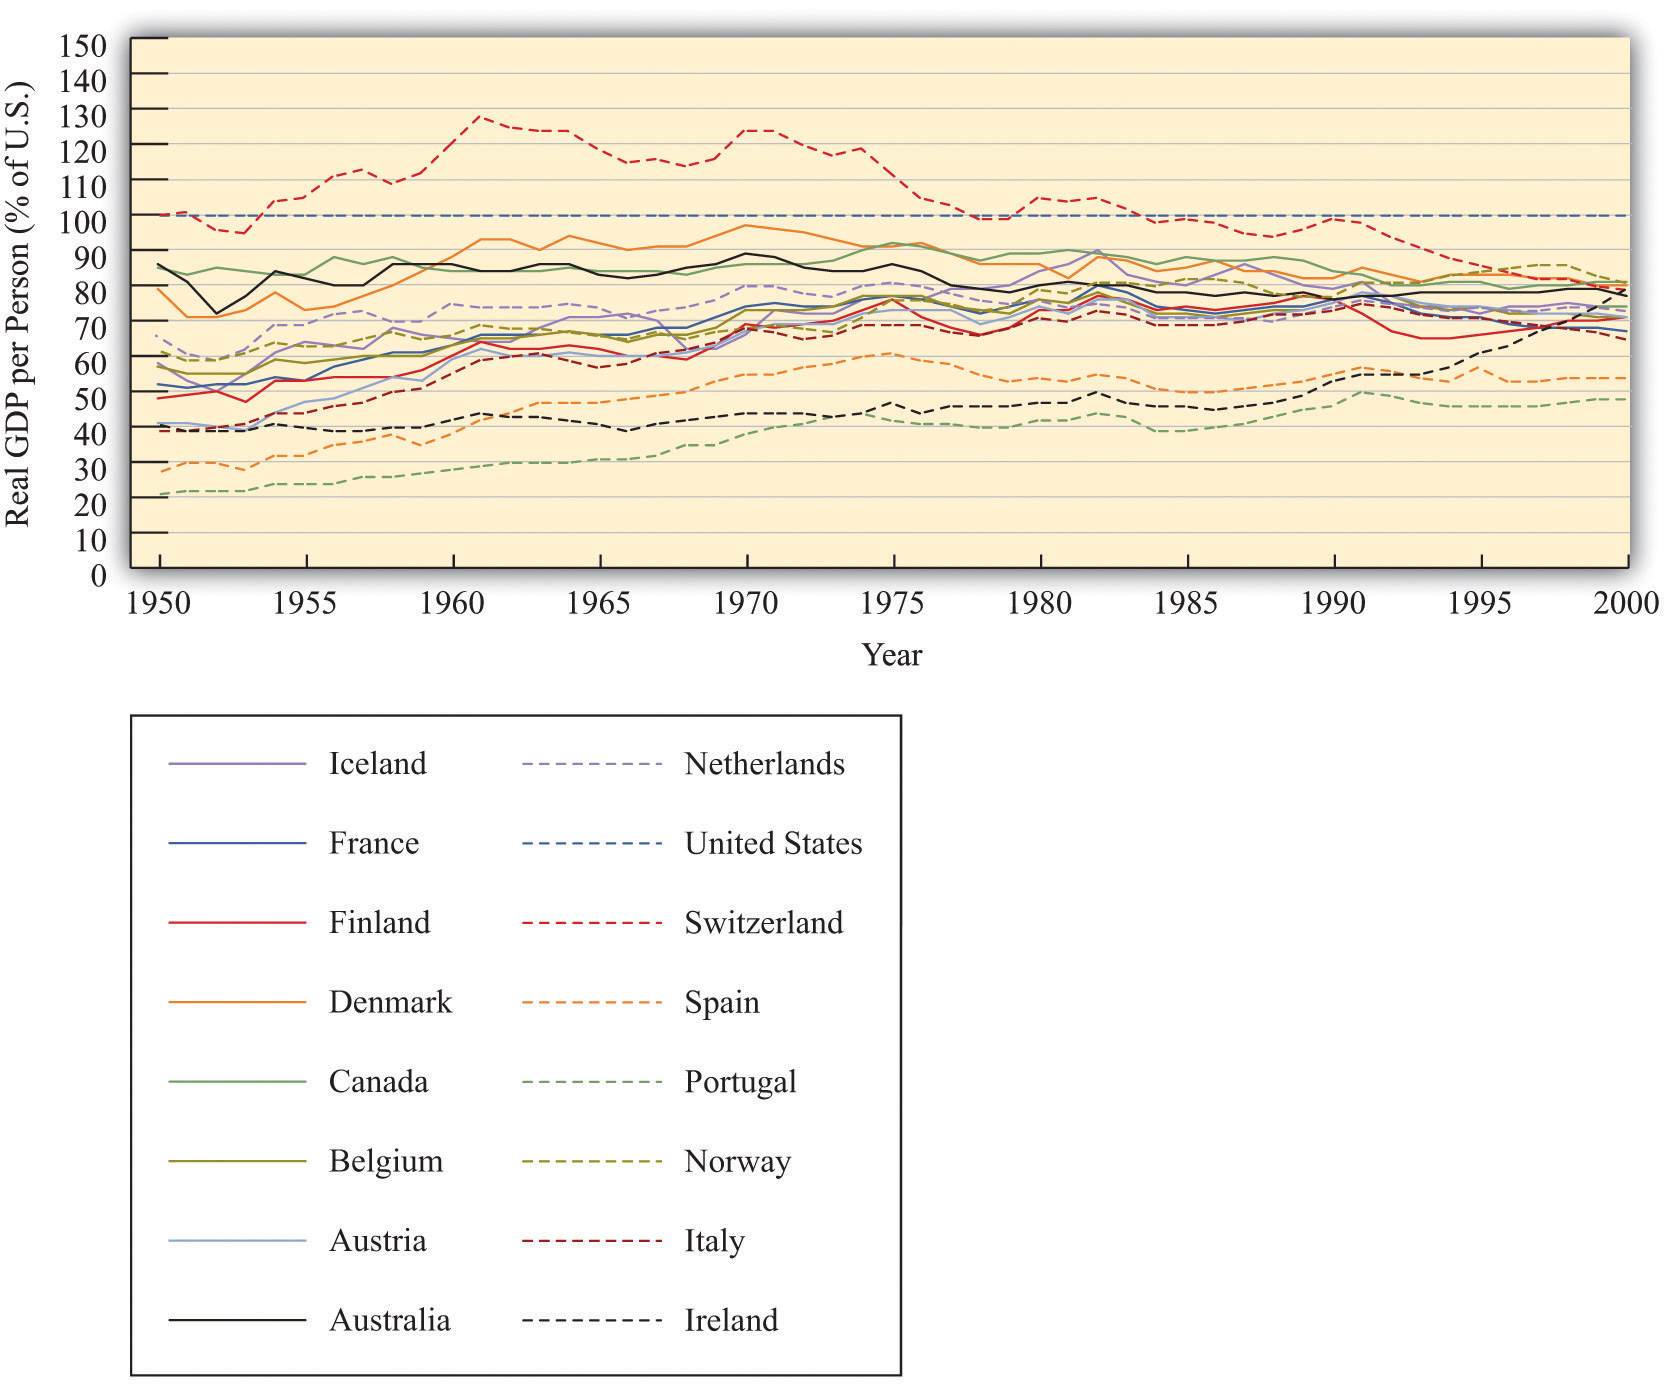
The growth experience of 16 relatively developed countries, measured as real GDP per person relative to the level in the United States, shows considerable evidence of convergence.
So far so good. But Figure 21.10 "Some Evidence of Divergence" shows the growth experience over the same period for a more diverse group of countries. This group is largely composed of poorer countries. The picture here is very different: we do not see convergence. There is no evidence that the poorer countries are growing faster than the richer countries. In some cases, there even appears to be divergence: poor countries growing more slowly than rich countries so that output levels in rich and poor countries move further apart.
Figure 21.10 Some Evidence of Divergence
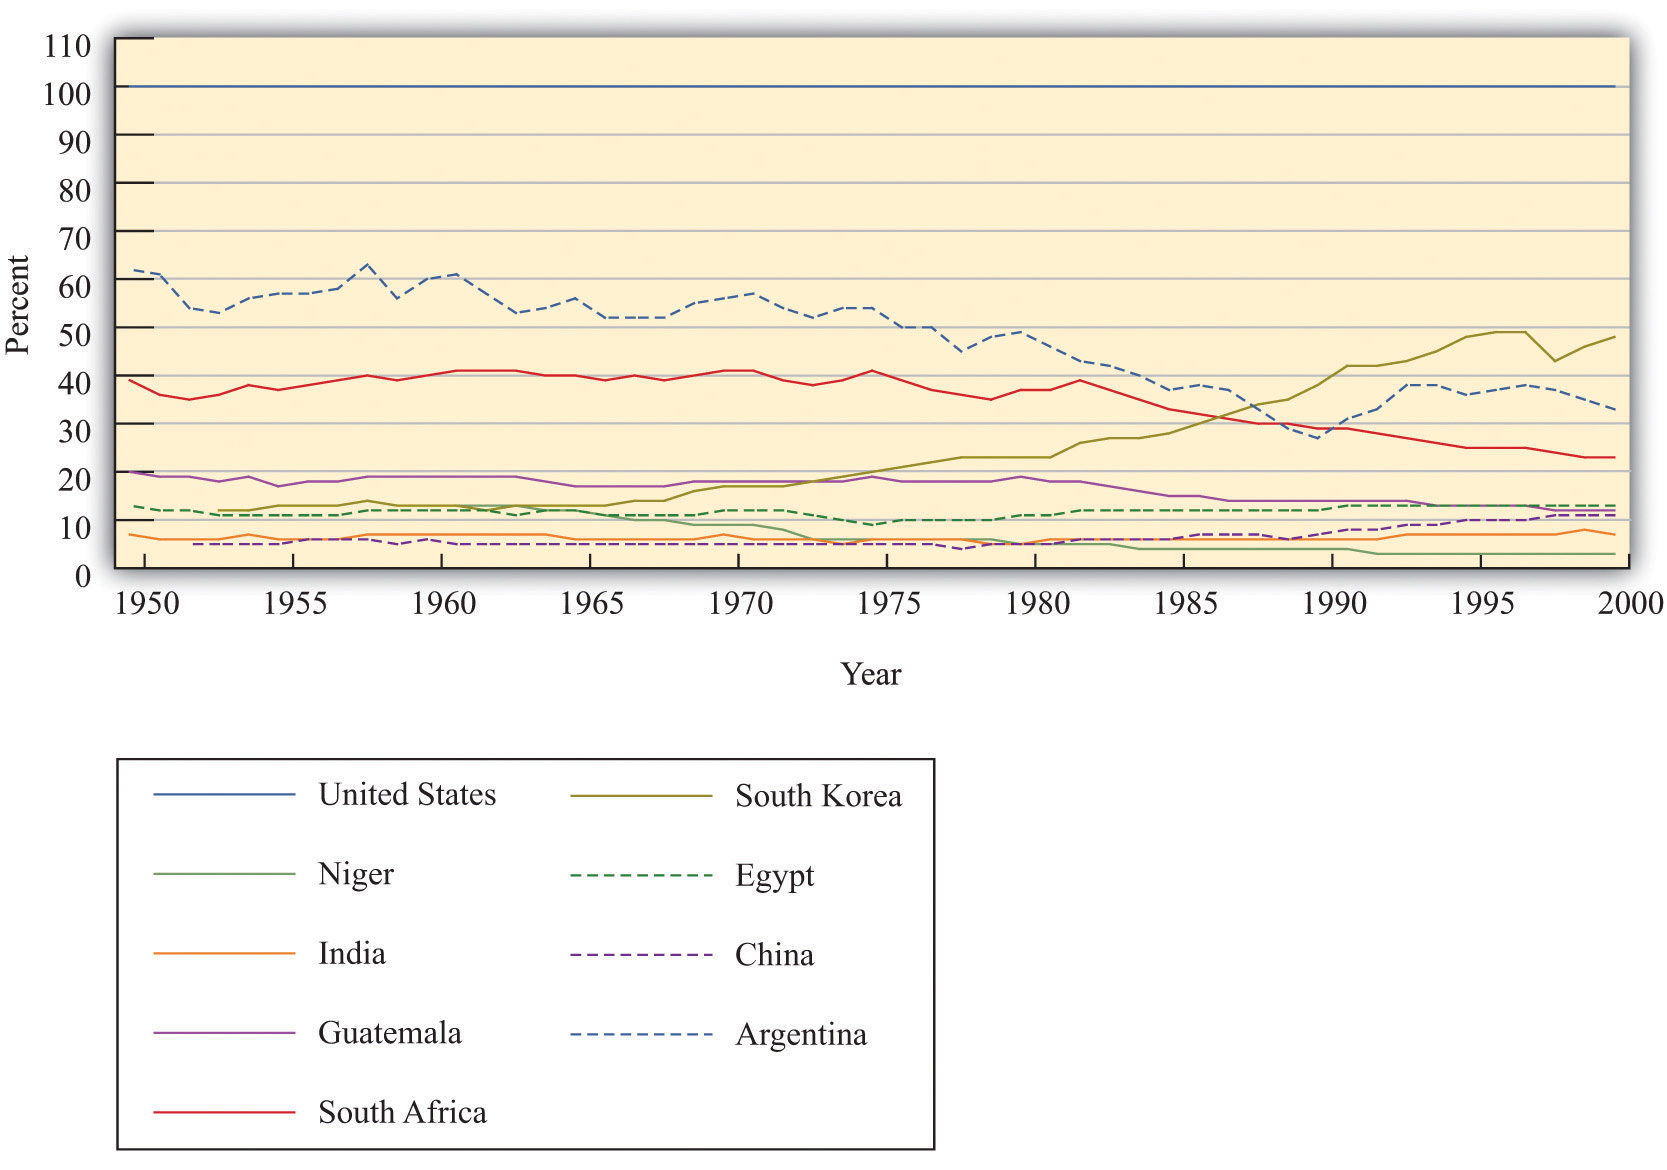
In contrast to Figure 21.9 "Some Evidence of Convergence", the countries in this sample do not appear to be converging. Many countries that were poor in 1950 were just as poor, relatively speaking, in 2000.
Table 21.5 "Evidence from Select Countries" shows more data for some of these countries. It lists the level of initial GDP per person and the average growth rate in GDP per person between the early 1950s and the end of the century. For example, Argentina had real GDP per person of $6,430 in 1950 (in year 1996 dollars) and grew at an average rate of 1.25 percent over the 50-year period. Egypt and South Korea had very close levels of GDP per person in the early 1950s, but growth in South Korea was much higher than that in Egypt: by the year 2000, GDP per person was $15,876 in South Korea but only $4,184 in Egypt. These two countries very clearly diverged rather than converged. Looking at China, the level of GDP per person in the early 1950s was less than 10 percent that of Argentina. By 2000, GDP per person in China was about 33 percent of that in Argentina.
Table 21.5 Evidence from Select Countries
| Country (Starting Year) | Real GDP per Capita (Year 1996 US Dollars) | Percentage Average Growth Rate to 2000 |
|---|---|---|
| Argentina (1950) | 6,430 | 1.25 |
| Egypt (1950) | 1,371 | 2.33 |
| China (1952) | 584 | 4.0 |
| South Korea (1953) | 1,328 | 5.5 |
Source: Penn World Tables
Overall, this evidence suggests that our theory can explain the behavior over time of some but not all countries. If we look at relatively rich countries, then we do see evidence of convergence. Across broader groups of countries, we do not see convergence, and we see some evidence of divergence.
Explaining Divergence
Why is it that, contrary to what Figure 21.8 "Convergence through the Accumulation of Capital" seems to suggest, not all countries converge? The logic of that picture rests on the diminishing marginal product of capital. If rich countries have lower marginal product of capital than poor countries, then we expect poor countries to catch up. If, for some reason, richer countries sometimes also have a higher marginal product of capital than poorer countries, then the argument for convergence disappears.
Figure 21.11 "Divergence Arising from Increasing Marginal Product of Capital" shows an example where the aggregate production function looks a bit different. This production function has a range where increases in capital stock lead to a higher rather than a lower marginal product of capital. That is, for some amounts of capital, we see increasing marginal product of capital rather than diminishing marginal product of capital. In the figure, country A and country B converge, just as in our previous diagram. But country C is rich enough to lie on the other side of the range where there is an increasing marginal product of capital. Country C therefore has a higher marginal product of capital than country B, even though country C is richer. Countries B and C will diverge, rather than converge.
Figure 21.11 Divergence Arising from Increasing Marginal Product of Capital
In this diagram, three countries have an aggregate production function that does not always exhibit diminishing marginal product of capital. As a result, the economies need not converge.
Figure 21.12 "Divergence Arising from Differences in Technology" shows another reason why a richer country might have a higher marginal product of capital than a smaller country. In Figure 21.8 "Convergence through the Accumulation of Capital" we supposed that the three countries had the same production function and differed only in terms of their capital stock. In Figure 21.12 "Divergence Arising from Differences in Technology", country B is richer than country A for two reasons: it has more capital and has a superior technology (or more labor or human capital). The higher capital stock, other things being equal, means a lower marginal product of capital in country B. But the superior technology, other things being equal, means a higher marginal product of capital in country B. In the picture we have drawn, the technology effect dominates. Country B has the higher marginal product of capital, so it is the more attractive location for capital—it is more competitive. Because of this, the capital stock increases in country B. Indeed, if the only factor driving investment is the marginal product of capital, then we would expect capital to flow among countries until the marginal product of capital is equal everywhere.We discuss capital migration across countries in more detail in Chapter 20 "Globalization and Competitiveness".
One reason why a richer economy might have better technology is because it has better social infrastructure. In particular, developed economies often have the legal and cultural institutions that preserve property rightsAn individual’s (or institution’s) legal right to make all decisions regarding the use of a particular resource.. The return on investment is higher, other things being equal, when property rights are protected. In economies with less well-developed institutions, investors need a higher rate of return to compensate them for the additional risk of placing their capital in those countries.
Measuring these aspects of social infrastructure is a challenge. The World Bank has attempted to do so in its 2005 World Development Report.World Bank, World Development Report 2005: A Better Investment Climate for Everyone (New York: World Bank and Oxford University Press, 2004), 8, accessed August 22, 2011, http://siteresources.worldbank.org/INTWDR2005/Resources/complete_report.pdf. The study looks at various aspects of doing business in 48 countries. The top constraints on investment reported by firms were policy uncertainty, macroeconomic instability, and taxes. Many of the risks of doing business are directly associated with government action in the present and in the future. This is nicely stated in the World Bank report: “Because investment decisions are forward looking, firms’ judgments about the future are critical. Many risks for firms, including uncertain responses by customers and competitors, are a normal part of investment, and firms should bear them. But governments have an important role to play in maintaining a stable and secure environment, including by protecting property rights. Policy uncertainty, macroeconomic instability, and arbitrary regulation can also cloud opportunities and chill incentives to invest. Indeed, policy-related risks are the main concern of firms in developing countries.”World Bank, World Development Report 2005: A Better Investment Climate for Everyone (New York: World Bank and Oxford University Press, 2004), 5, accessed August 22, 2011, http://siteresources.worldbank.org/INTWDR2005/Resources/complete_report.pdf.
Figure 21.12 Divergence Arising from Differences in Technology
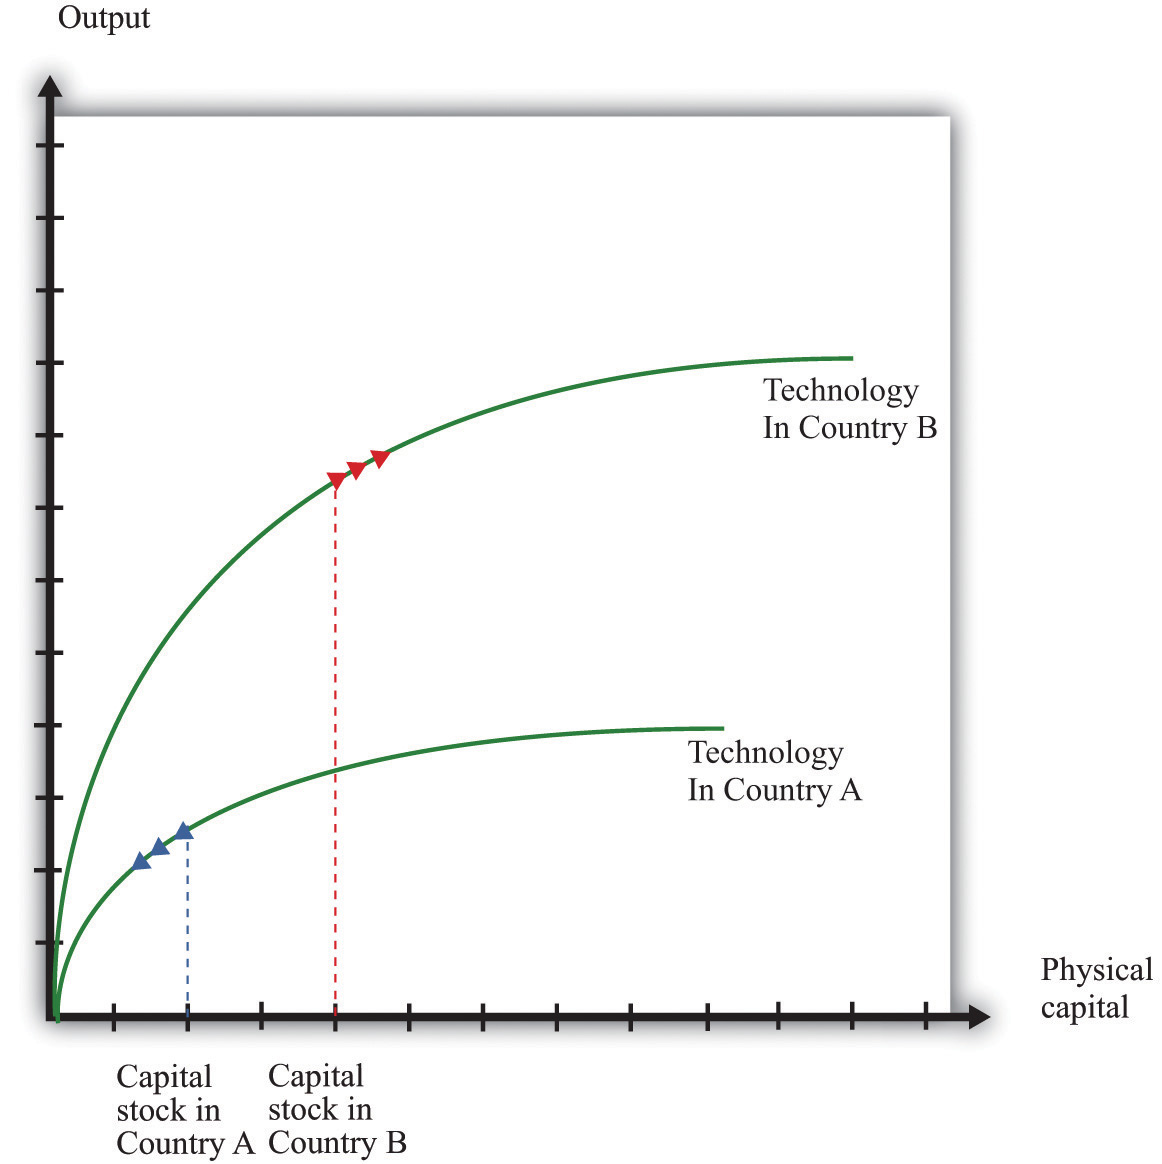
In this diagram, country B has a better technology or more human capital than country A. Even though country B has a larger capital stock, it also has a larger marginal product of capital.
Key Takeaways
- Capital stock increases from investment and decreases due to the depreciation of capital stock.
- All else being the same, poorer countries have a lower capital stock and therefore a higher marginal product of capital compared to rich countries. Thus capital accumulation should be faster in poor countries, which will lead to convergence with richer countries.
- The evidence suggests convergence between some but not all economies.
- Divergence of output across countries might come from the presence of an increasing marginal product of capital or from one country having a superior technology to another.
Checking Your Understanding
-
Suppose we have 100 units of capital stock at the beginning of 2012 and the following table gives the investment for the next 5 years. Suppose the depreciation rate is 5 percent. Fill in the blanks in the table for the years 2012–2017.
Year Capital Stock (Start of Year) Investment Depreciation 2012 100 80 2013 20 2014 50 2015 120 2016 10 - If one country has a higher level of real GDP than another, does that mean it must have a higher growth rate as well?
- If citizens of a relatively poor country are educated in a richer country, does this help or hinder convergence?
21.4 Balanced Growth
Learning Objectives
After you have read this section, you should be able to answer the following questions:
- What is balanced growth?
- Why does balanced growth matter?
- When will economies converge to a balanced-growth path?
We have seen that the accumulation of capital—other things being equal—leads economies to converge over time. However, we saw that the evidence for such convergence in the data is highly mixed. To understand more about when economies will and will not converge, we need a more complete theory of the sources of economic growth. In this section, we develop such a theory and then use it to look again at the question of convergence. We initially take as given—that is, as exogenousSomething that comes from outside a model and is not explained in our analysis.—the growth rates of human capital, the workforce, and the technology.
Growth Accounting
We begin with the tool of growth accounting. The growth accounting equation for our aggregate production function is as follows:Growth accounting is discussed in more detail in Chapter 20 "Globalization and Competitiveness".
output growth rate = [a × (capital growth rate)] + [(1 − a) × (workforce growth rate + human capital growth rate)] + technology growth rate.Toolkit: Section 31.28 "Growth Accounting"
You can review growth accounting in the toolkit.
In this equation, a is just a number. For the US economy, a is approximately equal to 1/3. Remember that output is just another term for real gross domestic product (real GDP).
It turns out that, in the very long run, we expect the capital stock and the level of output to grow at exactly the same rate. We see why later in this section. Such a situation is called balanced growthWhen the growth rate of the capital stock and the output growth rate are equal.. When this is true, the growth accounting equation then becomesYou don’t need to worry about the mathematical details, but if you are interested, we obtain this equation by setting the capital growth rate equal to the output growth rate:output growth rateBG = [a × (output growth rateBG)] + [(1 − a) × (workforce growth rate + human capital growth rate)] + technology growth rate, which implies (1 − a) × output growth rateBG = [(1 − a) × (workforce growth rate + human capital growth rate)] + technology growth rate.Dividing this equation by (1 − a) gives us the equation in the text.
For example, suppose that a = 1/3, the human capital growth rate = 0.01, the technology growth rate = 0.02, and the workforce growth rate = 0.03. Then
The Growth Rate of Output per Worker in a Balanced-Growth Economy
When we are comparing living standards across countries, it is better to adjust for differences in the size of the workforce to obtain output per worker. This is a measure of the overall productivityThe effectiveness of an economy for producing output. of an economy—that is, the effectiveness of an economy for producing output. (Of course, output per worker and output per person are very closely related. For the US economy, the workforce is roughly half the total population, so output per person is therefore approximately half as much as output per worker.) The growth rate of output per worker equals the growth rate of output minus the growth rate of the workforce:
This equation tells us that, in the end, the secret to economic growth is the development of knowledge and skills. Invention, innovation, education, training, and improvements in social infrastructure are the drivers of economic growth in the very long run.
Perhaps surprisingly, the growth rate of the capital stock is not a fundamental determinant of the growth rate. When we have balanced growth, the capital stock grows, which contributes to the overall growth of output. But if we ask what determines the overall growth rate in an economy, it is the growth of technology and human capital. The capital stock then adjusts to keep the economy on its balanced-growth path. By the definition of balanced growth, the growth rate of the capital stock is equal to the output growth rate.
Figure 21.13 Output and Capital Stock in a Balanced-Growth Economy
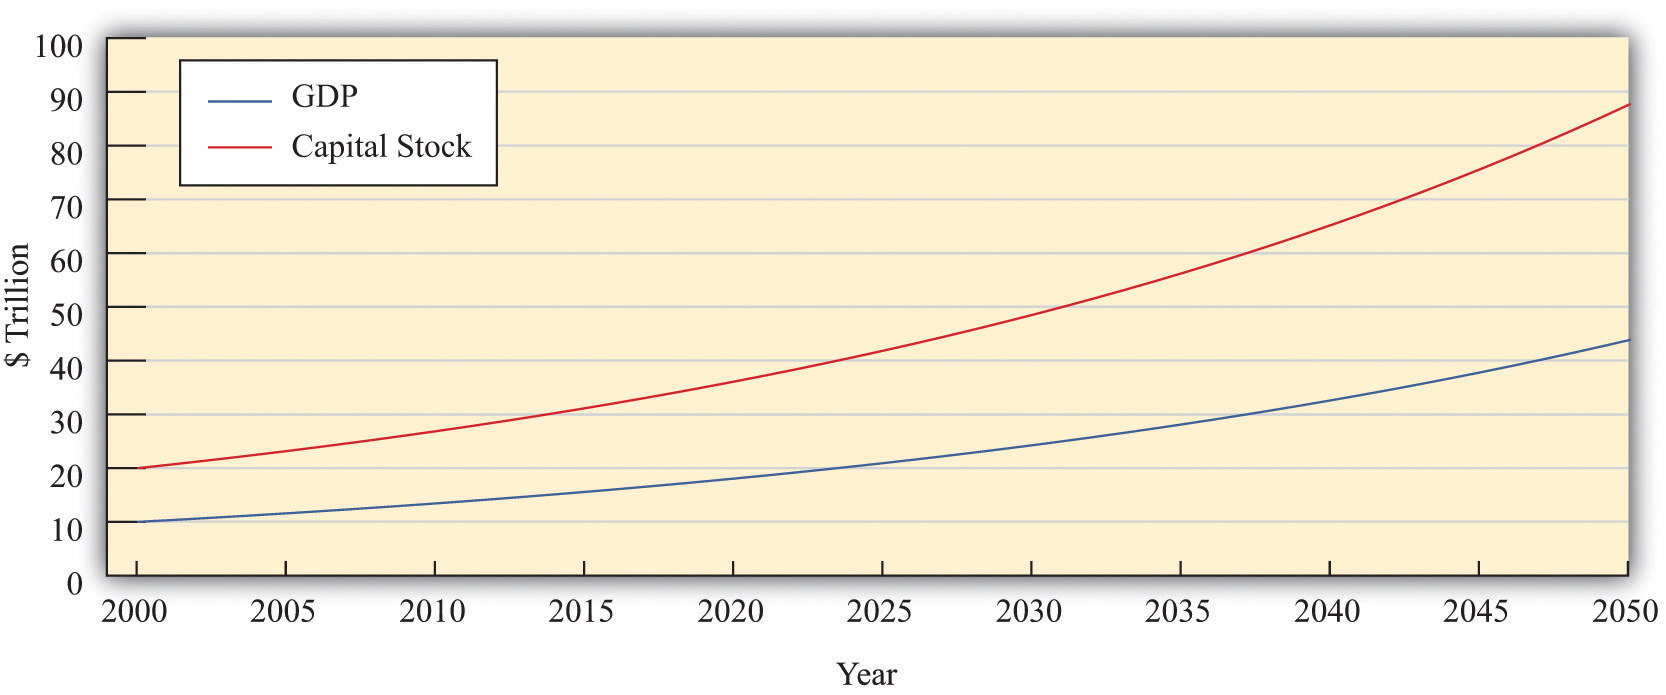
This picture shows an example of an economy on a balanced-growth path. Both variables grow at 3 percent per year and the capital stock is always equal to exactly twice the level of GDP.
Figure 21.13 "Output and Capital Stock in a Balanced-Growth Economy" illustrates balanced growth. Look first at output. Notice that even though the growth rate of output is constant, the graph is not a straight line. Instead, it curves upward: the change in the level of output increases over time. This is because a growth rate is a percentage change. In our example, output in 2000 is $10 trillion, and the growth rate is 3 percent. From 2000 to 2001, output increases by $300 billion (= $10 trillion × 0.03). By 2050, output is equal to $44 trillion. Between that year and the next, output increases by $1.3 trillion (= $44 trillion × 0.03). Even though the growth rate is the same, the change in the level of output is more than four times as large.
When output and the capital stock grow at the same rate, the ratio of the capital stock to GDP does not change. In Figure 21.13 "Output and Capital Stock in a Balanced-Growth Economy", the value of the capital stock is always twice the value of output. The capital stock and real GDP both grow at the same rate (3 percent per year), so the ratio of the capital stock to GDP does not change over time.
Figure 21.14
Balanced growth means that the ratio of the capital stock to output does not change. On a balanced-growth path, output and the capital stock grow at the same rate, so the ratio of the capital stock to output is always the same: the growth path of the economy is a straight line from the origin.
Figure 21.14 shows what a constant ratio of the capital stock to GDP looks like in our production function diagrams. Along any straight line from the origin, the ratio of the capital stock to output does not change. As a simple example, suppose that (as in Figure 21.13 "Output and Capital Stock in a Balanced-Growth Economy") the capital stock is always twice the level of output. This means that output is always half of the capital stock:
output = 0.5 × capital stock.This is just the equation of a straight line that passes through the origin. In Figure 21.14, increases in human capital or technology shift the production function upward. On the balanced-growth path, capital stock grows at exactly the right rate so that the economy grows along a straight line from the origin.
The Transition to Balanced Growth
If an economy is not yet on its balanced-growth path, it will tend to go toward that path. If a country has a small capital stock relative to GDP, then its capital stock will grow faster than real GDP. Countries that are still developing may well be in this position. Countries that are further along in the development process are likely to be (approximately) on their balanced-growth paths. For such countries, the ratio of capital stock to output is unchanging.
Economies that have not yet accumulated enough capital to be on their balanced-growth paths will have a growth rate that equals the balanced-growth rate plus an additional factor due to the growth rate of capital relative to GDP.If you are interested in the mathematical derivation of this equation, you can find it in the toolkit.
The first term is the growth rate along the balanced-growth path. The second term is the additional component to growth that comes about whenever the capital stock is growing faster than output.
Table 21.6 "Approaching the Balanced-Growth Path" gives an example of an economy that is approaching a balanced-growth path. Like the economy in Figure 21.13 "Output and Capital Stock in a Balanced-Growth Economy", the balanced-growth output growth rate is 3 percent. The workforce grows at 1 percent, so output per worker grows at 2 percent along the balanced-growth path. However, this economy starts off (in the year 2000) with a smaller capital stock than is needed for balanced growth. Looking at the first row of the table, you can see that the capital stock grows at 14.4 percent, while output grows at 6.8 percent. Because capital grows faster than output, there is an additional component to growth, as we have just explained. This contributes an extra 3.8 percentage points to the growth rate, so output per worker grows at 5.8 percent.
As time goes on, the capital stock grows relative to output, and the economy gets closer to the balanced-growth path. As this happens, the additional component of growth becomes smaller. For example, in 2010, the capital stock grows at 6.8 percent, and output grows at 4.3 percent. The growth rate of output per worker is 3.3 percent—2 percentage points being the balanced-growth contribution and 1.3 percent due to the faster growth rate of capital stock compared to output. By 2050, the economy is close to balanced growth: output per worker grows at 2.3 percent, with capital stock growing only a little bit faster than output.
Table 21.6 Approaching the Balanced-Growth Path
| Year | Balanced-Growth Output Growth Rate (%) | Balanced-Growth Output per Worker Growth Rate (%) | Capital Growth Rate (%) | Output Growth Rate (%) | Output per Worker Growth Rate (%) |
|---|---|---|---|---|---|
| 2000 | 3.0 | 2.0 | 14.4 | 6.8 | 5.8 |
| 2005 | 3.0 | 2.0 | 9.3 | 5.1 | 4.1 |
| 2010 | 3.0 | 2.0 | 6.8 | 4.3 | 3.3 |
| 2015 | 3.0 | 2.0 | 5.5 | 3.8 | 2.8 |
| 2020 | 3.0 | 2.0 | 4.7 | 3.6 | 2.6 |
| 2025 | 3.0 | 2.0 | 4.1 | 3.4 | 2.4 |
| … | … | … | … | … | … |
| 2050 | 3.0 | 2.0 | 3.8 | 3.3 | 2.3 |
Countries that are well below their growth path will see their capital stock grow rapidly relative to GDP. They will experience relatively rapid GDP growth. Countries that are close to their balanced-growth path will see their capital stock grow more slowly relative to GDP and have a GDP growth rate that is only slightly bigger than the balanced-growth rate. Although the economy will eventually reach its balanced-growth value, this adjustment may take decades. For this reason, we say that the economy will achieve balanced growth only in the very long run.To be mathematically precise, the economy gets closer and closer to its balanced-growth path but never quite gets there. Over a period of decades, it gets close enough that it makes no practical difference.
Convergence Revisited
We can now use our theory of balanced growth to make our earlier argument for convergence more precise. Then we consider whether we might also see convergence from changes in human capital and technology.
Convergence in Physical Capital
Imagine that we are comparing two countries that are identical in almost every respect. They both have the same levels of technology and human capital and the same balanced-growth ratio of capital stock to GDP. However, they have different amounts of physical capital. Suppose that one of the countries has a large capital stock (call it the rich country) and the other country has a much smaller capital stock (call it the poor country).
These two economies will initially have different levels of output and living standards. Our model predicts, however, that these differences will be temporary. Both economies will approach the balanced-growth path. The poor country will grow more rapidly because its ratio of capital stock to GDP will be increasing more quickly as it moves toward the balanced-growth path. Over time, we expect to see the poor country catch up to the rich one. We illustrate this in Figure 21.15 "Convergence of a Rich Country and a Poor Country".
Figure 21.15 Convergence of a Rich Country and a Poor Country
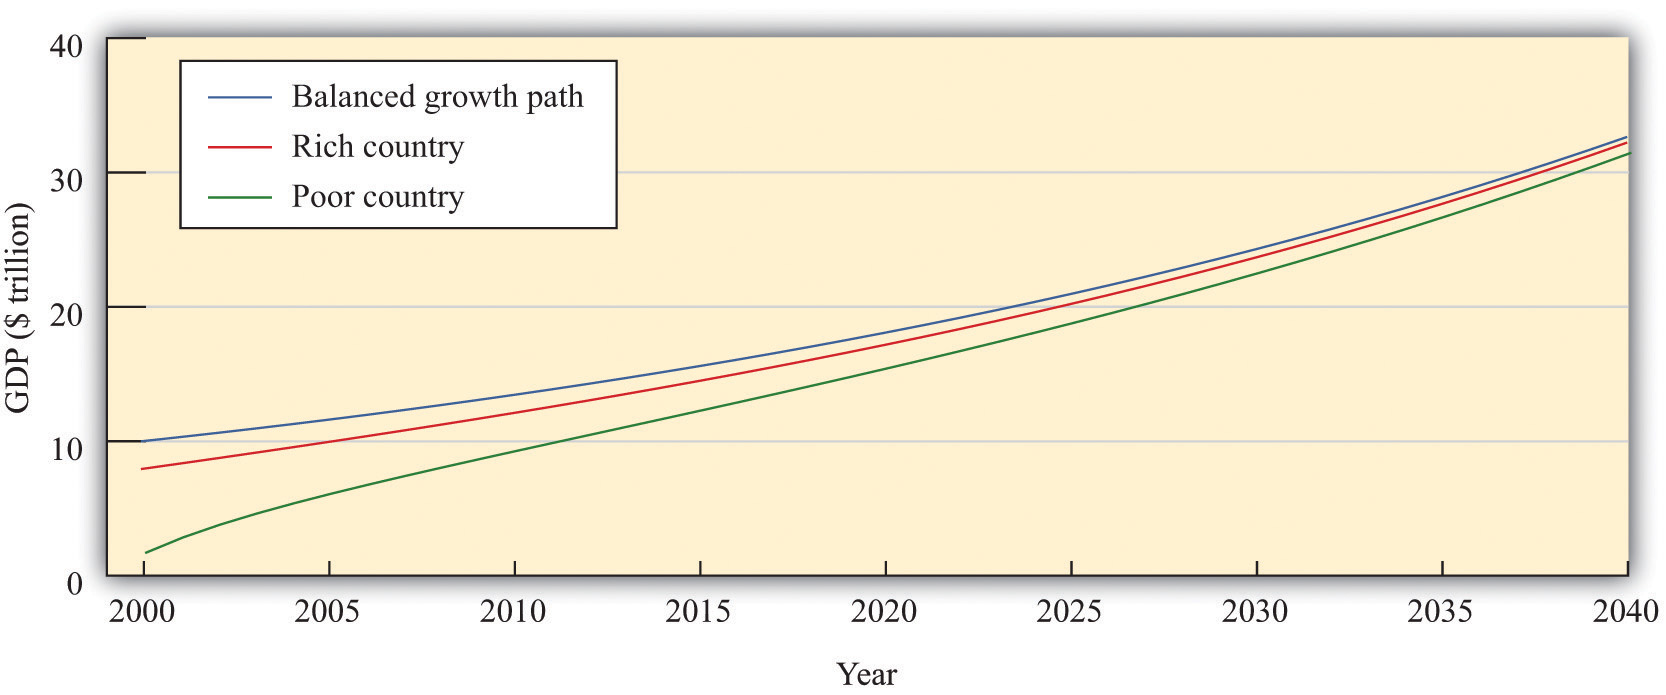
Consider two economies, identical in all respects except that one has a smaller capital stock than the other. The poorer country accumulates capital faster than the richer country and grows faster.
This is exactly the same mechanism for convergence that we saw before. The country with a smaller capital stock will have a higher marginal product of capital and will grow faster because the country is a more attractive place for investment. Because the poor country accumulates capital more rapidly than the richer country, it will grow faster. The two countries will converge to the same balanced-growth path and to the same level of output per person.
Convergence in Human Capital
So far we have not considered why human capital might change over time. If there are reasons to think that this variable might grow more quickly in poor countries than in rich countries, we have another force that might drive convergence.
In some ways, human capital resembles physical capital. As with the physical capital stock, some accumulation is the result of decisions by governments, and some comes from decisions by private agents. From the government side, it is likely that economies with low levels of human capital might also be economies in which there is a high return to basic education. If literacy rates are low and most children do not receive much education, even straightforward investments in schooling might yield big gains in terms of the ultimate capabilities of the workforce. Governments in poor countries might see big potential gains from investment in education. Private individuals and firms may also perceive that the returns on education are larger in poorer economies. If very few people in the economy have college degrees, an individual might find that a college education yields a very large payoff. By contrast, if the population as a whole is highly educated, it might take a much larger investment to stand out from others.
This discussion is somewhat speculative. Human capital is difficult to measure, and the marginal product of human capital is even harder to quantify. Nevertheless, there are some good reasons to believe that the incentives to invest in human capital are greater in poorer economies. If so, we have another reason to expect convergence.
Convergence in Technology
What about technology? Will it grow faster in poorer economies? The answer depends on which aspect of technology we are talking about.
Differences in knowledge between rich and poor countries are likely to diminish over time. Rich economies are typically close to the technology frontier, meaning that they are using state-of-the-art production techniques. For countries on the technology frontier, growth in knowledge can only come the hard way, through investment in research and development (R&D). Countries inside the technology frontier are typically poorer developing countries. These economies can grow their stock of knowledge simply by importing knowledge from countries at the frontier. Technological advance is much cheaper and easier if you can use others’ inventions and innovations rather than coming up with your own. We therefore expect such countries to have faster growth rates of knowledge. As they become more developed, the growth of knowledge in these economies will slow down to the rate experienced by other countries near the technology frontier. But in the meantime, they will grow faster than rich countries. Technology transfer to developing economies is surely a force leading to convergence of economies.
There is less to say about social infrastructure and natural resources. The amount of natural resources available in an economy is largely due to accidents of history and geography: there is no obvious reason to expect the growth rate of natural resources to be linked to the level of development. Social infrastructure, meanwhile, is a complicated mix of institutions, customs, and other factors. Again, there is no obvious reason to expect social infrastructure to grow more quickly in poorer economies.
Divergence Revisited
Now that we have incorporated human capital and technology into our framework, we can identify some further possible explanations of divergence. Our theory says that economies will converge if they differ only in terms of their initial capital stock. But it is possible that different economies will also have different balanced-growth paths. Figure 21.16 "Balanced Growth in Two Countries with Different Ratios of Capital to Output" shows what this looks like. The ratio of capital stock to output in the very long run depends on a number of different factors, including the growth rate of technology and the growth rate of the workforce. If these differ across countries, then their balanced-growth paths will differ as well, and we will not observe convergence.The toolkit presents a complete model of balanced growth, including a formula for the balanced-growth ratio of capital stock to output.
Figure 21.16 Balanced Growth in Two Countries with Different Ratios of Capital to Output
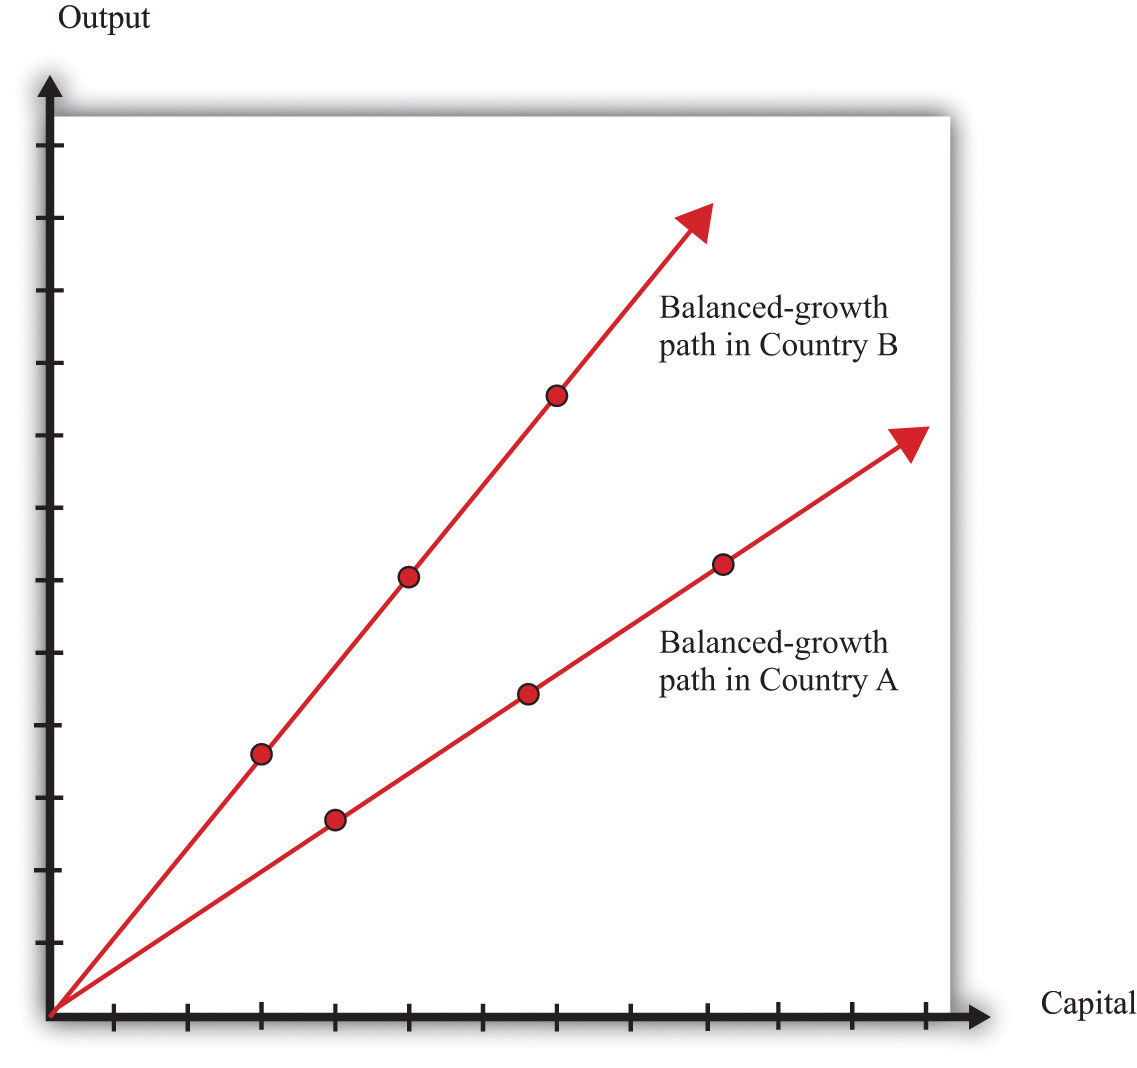
Economies may have different balanced-growth paths. In this example, the ratio of capital stock to output is higher in country A than in country B.
This explanation—and our previous stories of divergence—tells us why different economies will not necessarily end up at exactly the same level of output per worker. But the problem of divergence is in some ways worse than that. Some countries are not only failing to converge but also moving further and further apart. In other words, in some cases, richer economies are growing faster than poorer economies. Indeed, as we saw with Niger, some of the poorest economies in the world have been shrinking rather than growing.
Remember that the growth rate of output per worker on a balanced-growth path is as follows:
We can explain divergence in our framework if human capital or technology is growing more slowly in poor countries than in rich ones. Are there reasons to expect this to be the case? Earlier, we said that countries with low levels of human capital might also be countries where the return to human capital investment was large, which is a force for convergence. We also pointed out, however, that the marginal product of physical capital might be larger in an economy with a superior technology, even if that economy had more capital. The same is true of human capital. Countries can build up their human capital through schooling and training. They can also build up their human capital by attracting skilled workers from other countries. If richer countries are able to attract skilled workers, then we will see divergence rather than convergence.In Chapter 20 "Globalization and Competitiveness", we discuss how economies actively seek to attract human capital.
Turning to technology, divergence in social infrastructure is certainly a possibility. Social infrastructure includes the rule of law, the general business climate, social attitudes toward corruption, the protection of property rights, and many other intangible factors. These influences on economic growth are difficult to define and almost impossible to measure accurately. Yet economists are convinced that successful economies must have a good set of such social institutions. It is likely that it is easier to build and improve such institutions in countries that are relatively prosperous, which would again lead richer countries to grow more rapidly than poorer countries.
Economists have built some of these ideas into the theoretical framework of economic growth. Unfortunately, the models are too complicated for an introductory economics textbook, so we will not go into them in any detail here. We can, however, provide a simple example that conveys the flavor of these more complex ideas. The story goes as follows. We know that workers acquire human capital through education and on-the-job training. Suppose that, when there is more physical capital in the economy (relative to the number of workers), it is easier to acquire human capital. You can study in modern facilities with up-to-date computers. You work with state-of-the-art machinery and become more skilled. In this story, human capital is endogenousSomething that is explained within our analysis.: it depends on the amount of physical capital.
To be concrete, imagine that technology is constant, and the amount of human capital is proportional to the amount of physical capital per worker. When we incorporate this assumption into the production function, we end up with a very straightforward relationship:
output = B × physical capital,where B is just a number.The derivation of this equation is not very difficult; it is explained in the toolkit.
In this economy, the ratio of capital stock to GDP is constant at all times (capital/output = 1/B). This economy is always on a balanced-growth path. Because of this, the growth rate of output equals the growth rate of capital stock:
output growth rate = physical capital growth rate.The more important point, though, is that this technology does not exhibit diminishing marginal product of capital. The marginal product of capital is constant: it equals B. If this number were different in different economies, then we would expect to see capital stock flowing from economies where B is small toward economies where B is large. We would see divergence rather than convergence.
The model that we have described in this subsection is simplistic. Its point is simply to show that, if we make human capital endogenous, it is much easier to explain divergence. Economists have built more complicated and realistic models with endogenous human capital and technology that give similar results.
Key Takeaways
- Balanced growth occurs when capital stock grows at the same rate as output. Along a balanced-growth path, the ratio of output to capital stock does not change.
- Balanced growth is important to understand because over long periods of time, we expect economies to reach their balanced-growth path.
- There are reasons to expect at least some convergence in physical capital, human capital, and knowledge. However, there is no strong argument for why we would see convergence in social infrastructure.
Checking Your Understanding
- Suppose that an economy has a balanced-growth path where the physical capital stock is three times the level of GDP. If the current capital stock is four times the level of GDP, do you expect capital stock to grow faster or slower than GDP?
- Suppose we have two economies that are currently identical, except in the first economy a is 0.3 and in the second economy a is 0.5. Will the balanced-growth path be the same in both countries? Which economy will converge more quickly to the balanced-growth path?
21.5 The Role of International Institutions in Promoting Growth
Learning Objectives
After you have read this section, you should be able to answer the following questions:
- What are the main international organizations that help to promote growth?
- What do these institutions do to achieve their stated goals?
Governments acting alone can do a lot to promote economic growth. We have discussed the importance of protecting property rights and establishing a climate of political stability. These efforts by individual governments are complemented by international actions to promote growth and development in poorer countries. In this section, we describe three powerful and controversial international economic organizations: the World Bank, the International Monetary Fund (IMF), and the World Trade Organization (WTO). We briefly explain what these institutions do and how they go about reaching their goals.The websites of the World Bank, the IMF, and the WTO are, respectively, as follows: http://www.worldbank.org, http://www.imf.org/external/index.htm, and http://www.wto.org.
The World Bank
The World Bank is an international intermediary funded by 184 member countries. Its goal is to provide loans and grants to developing countries with the aim of eliminating poverty by promoting economic growth. Economists working at the World Bank rely on variants of the growth model used in this chapter to understand the growth experiences of different countries and determine the effects of policies in those countries.
The World Bank borrows money on international capital markets and also receives funds directly from member countries. The World Bank is similar to a bank that a household or a firm would approach for a loan to build a factory or a house, except that its borrowers are national governments. It often funds projects that would otherwise not be undertaken. In many cases, these are projects that promote infrastructure, education, health, and so forth. Projects like these may have social benefits yet not be profitable enough for private firms to undertake. Building a road in a rural part of a developing country is not the type of investment project one normally associates with a profit-seeking firm, for example, even though the road may have spurred rural development.
In 2010 the World Bank made about $45 billion in loan commitments and $29 billion in loan disbursements.“Annual Report 2010: Financial Information,” World Bank, accessed August 22, 2011, http://web.worldbank.org/WBSITE/EXTERNAL/EXTABOUTUS/EXTANNREP/ EXTANNREP2010/0,,contentMDK:22626599~menuPK:7115719~pagePK:64168445~piPK:64168309 ~theSitePK:7074179,00.html. At one level, this is evidently substantial—a project worth $100 million or more can certainly have a large impact on a poor country. At another level, it is not a huge sum of money in the global economy. For comparative purposes, BP set aside over $40 billion to pay for the cleanup of its 2010 oil spill in the Gulf of Mexico.
World Bank projects range broadly. They include funding for infrastructure construction, promoting health care (such as HIV/AIDS programs), promoting education, and so forth. Many of these projects involve the provision of public goods, so they create benefits for society as a whole that exceed the direct return on investment. That is, many of the projects that are funded by national governments in richer countries are funded through the World Bank in developing countries. At the beginning of this chapter, we saw an example of a World Bank project in Niger, which was aimed at increasing human capital in that country. As another example, here is a description of a recent World Bank loan to Guyana to provide water access to the poor.
Guyana: Water Sector Consolidation Project
GRANT AMOUNT: $12.3 million
PROJECT DESCRIPTION: This project’s main objective is to increase access to safe water among the poor. The project seeks to support the achievement of sustainable universal access to safe and affordable water for the population of Guyana, especially the poor. The project will also help to consolidate the water sector modernization and reform process undertaken by the government with support of the International Development Association (IDA) and other donors in recent years.“Water Sector Consolidation Project,” World Bank, July 12, 2005, accessed June 30, 2011, http://web.worldbank.org/external/projects/main?pagePK=64283627&piPK=73230& theSitePK=40941&menuPK=228424&Projectid=P088030&cid=3001_72.
The project described here would not likely be a profitable private sector project, but it is important for the development of Guyana. Notice, too, that this loan, like many other World Bank loans, is for the development of infrastructure (roads, bridges, schools, communication systems, etc.). In more developed countries, such projects are usually performed by governments, but in developing countries, these investments are frequently undertaken through the World Bank.
Investment in infrastructure is typically complementary to the accumulation of other physical capital, such as machines and plants. Even though developing countries have relatively low capital stocks, investment in plants and equipment may not be very profitable if basic infrastructure is lacking. There is no point in building a factory if there are no roads to take your goods to market. Investment in infrastructure can increase the marginal product of capital and make other investment more attractive.
The International Monetary Fund
The IMF was established to (among other things) provide short-term support for countries facing financial difficulties. This is explicitly stated in the IMF’s Articles of Agreement: “To give confidence to members by making the general resources of the Fund temporarily available to them under adequate safeguards, thus providing them with opportunity to correct maladjustments in their balance of payments without resorting to measures destructive of national or international prosperity.”“Articles of Agreement of the International Monetary Fund,” International Monetary Fund, February 22, 2010, accessed June 30, 2011, http://www.imf.org/external/pubs/ft/aa/aa01.htm.
A country’s balance of payments has two main components. The first is the trade balance. A balance of payment maladjustment may mean that a country is running persistent trade deficits—that is, its imports are greater than its exports. This means the country is borrowing from other countries and is building up its external debt. The second component of the balance of payments is the interest that a country must pay on its existing external debt. This means that imbalances in the past lead to worse imbalances in the present. Imagine, for example, that Juan in Solovenia borrowed extensively in the past. It is then difficult for him to get out of debt because he has to pay so much interest. Moreover, the amount of external debt in a country cannot grow forever. When countries get into trouble by accumulating large amounts of debt, there is a temptation to default on outstanding debt. A key role of the IMF is to help countries through these difficult episodes.
IMF help has strings attached. A controversial aspect of the IMF’s mode of operation is in the phrase…under adequate safeguards. As part of a deal to provide resources to countries in need of funds, the IMF often makes explicit demands about government fiscal and monetary policies. This is termed IMF “conditionality” and is described by the IMF as follows: “When a country borrows from the IMF, its government agrees to adjust its economic policies to overcome the problems that led it to seek financial aid from the international community. These loan conditions also serve to ensure that the country will be able to repay the Fund so that the resources can be made available to other members in need. In recent years, the IMF has streamlined conditionality in order to promote national ownership of strong and effective policies.”“IMF Conditionality,” International Monetary Fund, March 18, 2011, accessed August 22, 2011, http://www.imf.org/external/np/exr/facts/conditio.htm.
A quick tour of the IMF website (http://www.imf.org/external/index.htm) provides a lot of information about past and ongoing loans. One example is the ongoing relationship between the IMF and Argentina.The IMF formulates country reports on an annual basis, and these are available on the IMF website. These reports summarize the dealings between individual countries and the IMF. Argentina had reached an agreement with the IMF in September 2003 providing Argentina with access to SDR 8,981 million. SDR means “special drawing right.” It is a unit of account used by the IMF whose value is an average of four key currencies. Its actual value on any given date can be found at http://www.imf.org/external/np/fin/data/rms_sdrv.aspx. In May 2011, 1 SDR was worth US$1.59. This agreement with Argentina came after Argentina was unable to meet demands for payment on some of its external debt and after real gross domestic product (real GDP) had fallen by nearly 11 percent in 2002. Agreement with the IMF was not immediate, partly due to the conditionality of a prospective loan. Though agreement was ultimately reached, there were lengthy negotiations regarding the conduct of fiscal and monetary policy in Argentina as a condition for IMF assistance.
The World Trade Organization
The WTO “makes the rules” for international trade. It is a relatively new organization—having been founded in 1995—and has 150 member countries. It arose from earlier trade agreements between countries, most notable the General Agreement on Tariffs and Trade. The WTO website describes the role of the organization as follows:
[…]
Essentially, the WTO is a place where member governments go, to try to sort out the trade problems they face with each other. The first step is to talk. The WTO was born out of negotiations, and everything the WTO does is the result of negotiations. The bulk of the WTO’s current work comes from the 1986–94 negotiations called the Uruguay Round and earlier negotiations under the General Agreement on Tariffs and Trade (GATT). The WTO is currently the host to new negotiations, under the “Doha Development Agenda” launched in 2001.
Where countries have faced trade barriers and wanted them lowered, the negotiations have helped to liberalize trade. But the WTO is not just about liberalizing trade, and in some circumstances its rules support maintaining trade barriers—for example to protect consumers or prevent the spread of disease.
[…]“What Is the World Trade Organization?” World Trade Organization, accessed June 30, 2011, http://www.wto.org/english/thewto_e/whatis_e/tif_e/fact1_e.htm.
The negotiations at the WTO set the ground rules for international trade. Using the mechanisms of the WTO, countries agree on trade policies, such as the levels of tariffs. This is also a forum for designing policies on the protection of intellectual property rights. The WTO also provides a forum for dispute resolution.
Many critics of globalization have focused their attention on the WTO. For example, the nongovernmental organization Global Exchange (http://www.globalexchange.org) lists 12 “top reasons to oppose the WTO,” including the claims that the WTO is increasing hunger, increasing inequality, trampling human rights, destroying the environment, and killing people through its policies. Critics such as this group argue that the WTO is fundamentally undemocratic, writing the rules so as to favor powerful corporations and rich countries. Defenders of the WTO argue that it gives poorer countries a much greater voice in international economic decision making. They point out, for example, WTO decisions are based on consensus, meaning that all 150 member countries must agree to them.
Key Takeaways
- The World Bank, the IMF, and the WTO are three leading international organizations that help countries in the development process.
- The World Bank funds projects in recipient countries, the IMF provides balance of payments support, and the WTO works to reduce trade barriers.
Checking Your Understanding
- In what way does the IMF work to promote convergence across countries?
- The WTO helps to govern intellectual property rights. What is the impact of those rights on development?
21.6 End-of-Chapter Material
In Conclusion
We live in a world today that would be unrecognizable and unimaginable to those born two centuries ago. Things we take for granted—jet travel, antibiotics, electricity, the Internet, dentistry—are all products of the extraordinary growth of the last 200 years. Yet despite all our technological advances, billions of people in the world still live in poverty. Although some countries continue to grow rapidly, others stagnate or even go backward. If we could unlock the secrets of economic growth, we would have the means to help people to permanently better lives.
Even as economists emphasize economic growth as a way to combat poverty, noneconomists are often critical of economic growth, pointing out that it comes with costs as well as benefits. For example, as countries become richer, they use more energy and more of the world’s natural resources. Oil reserves are being depleted, and rainforests are disappearing. Growth may lead to increased pollution, such as greenhouse gas emissions that in turn contribute to climate change. These are serious and legitimate concerns. In brief, economists have four main responses.
- The framework we presented in this chapter does, in fact, capture the effect of declining natural resources. They lead to a slower rate of growth in technology. Indeed, it is possible that declining natural resources could more than offset growth in knowledge and social infrastructure so that the technology growth rate becomes negative. As yet, there is no evidence that this is a significant concern, but—at least until we have a better understanding of the drivers of knowledge and social infrastructure growth—it certainly might become relevant in the future.
- There are indeed uncompensated side effects of economic growth, such as increased pollution. Economists agree that such effects can be very important. However, they can and should be corrected directly. Curtailing growth is an extremely indirect and inefficient response to its adverse side effects. As Nobel Prize–winner Robert Solow put it, “What no-growth would accomplish, it would do by cutting off your face to spite your nose.”Robert M. Solow, “Is the End of the World at Hand?” Challenge 16, no. 1 (March/April 1973): 39–50. Also available at http://www.jstor.org/stable/40719094.
- The evidence reveals that some environmental problems are solved rather than exacerbated by growth. Air pollution is a much more serious problem in the developing countries of the world than in the rich countries of the world. In part this is because a clean environment is a luxury good; people only worry about the state of the environment once their basic needs of food and shelter are addressed.
- The most serious problems are those where we cannot rely on market mechanisms. If oil becomes scarce, then increases in the price of oil will provide incentives for people to economize on their use of fuel and look for alternative sources of energy. These incentives will at least ease the adjustment of the world economy. But there are no functioning market mechanisms to deal with climate change, for example.
Decades of research by economists have told us that there is no magic bullet, no simple and painless way to encourage economic growth. At the same time, we have learned a great deal about how and why countries grow. We have learned that growth depends on the accumulation of both physical and human capital. We have learned that growth ultimately hinges on the growth of knowledge, highlighting the importance of education, training, and research and development (R&D). And we have learned that good institutions are critical for countries that want to promote economic growth.
We have made progress, but the study of economic growth remains one of the most fascinating and challenging problems in all economics. There is no doubt that economists will continue their search for the elusive secrets of prosperity. As the Nobel Prize–winning economist Robert Lucas observed, “Once one starts to think about [economic growth], it is hard to think about anything else.”
Key Links
- Penn World Tables: http://pwt.econ.upenn.edu
- International Monetary Fund (IMF): http://www.imf.org/external/index.htm
-
World Bank: http://www.worldbank.org
- World Bank Development Report: http://econ.worldbank.org/WBSITE/EXTERNAL/EXTDEC/EXTRESEARCH/EXTWDRS/0,,contentMDK:20227703~pagePK:478093~piPK:477627~theSitePK:477624,00.html
- World Bank Development Indicators: http://www.google.com/publicdata/overview?ds=d5bncppjof8f9_&ctype=l&strail=false&nselm=h&hl=en&dl=en
- World Trade Organization: http://www.wto.org
- CIA World Factbook: https://www.cia.gov/library/publications/the-world-factbook
- Angus Maddison’s home page: http://www.ggdc.net/maddison
- Excel file of long-run data: http://www.ggdc.net/maddison/Historical_Statistics/horizontal-file_03-2007.xls
Exercises
- Think about your last visit to a shopping center or a large food store in the United States or other developed economy. Which of these goods and services do you think are available in a typical market in Niger? Which were available in the United States 50 years ago? 100 years ago?
-
(Advanced) In the late 1990s, the US government was running a surplus of about 1 percent of gross domestic product (GDP). Current projections show that the government is going to run deficits in excess of 5 percent of GDP in the future. Let us imagine that there are no changes in private saving or in foreign borrowing/lending.The condition that private savings do not change is important. For example, if the government cuts taxes, it is possible that people will predict that taxes will be higher in the future and will increase their savings in anticipation. We will say more about this in Chapter 29 "Balancing the Budget". In this case, the increased deficit translates directly into a decrease in the investment rate. To investigate the implications of such a decrease, suppose that, in the year 2000
investment rate = 0.24, depreciation rate = 0.085, and output growth rate = 0.035.-
On a balanced-growth path, the ratio of capital stock to output is given by the following formula:
Suppose that the economy was on a balanced-growth path in 2000. Calculate the balanced-growth ratio of the capital stock to GDP.
- Suppose the production function for this economy is output per worker = 15,000 × capital/output. What is output per worker in 2000?
- Now suppose that the increase in the government deficit means that the investment rate decreases to 0.18. What is the new balanced-growth ratio of the capital stock to GDP?
- Suppose that by 2040, improvements in technology and human capital mean that the production function is given by output per worker = 30,000 × capital/output. Suppose also that the economy has reached its new balanced-growth path. What is output per worker in 2040?
- What would output per worker equal in 2040 if there had been no change in the investment rate?
-
- Try to estimate approximately how much you spend every day. Be sure to include an amount for rent, utilities, and food. Do you think it would be possible for you to live on $2 per day?
- Suppose there are two economies. The first has a current level of real GDP of 100, and the second has a current level of real GDP of 200. The poorer country is forecasted to grow at 10 percent in the coming year, while the richer country is forecasted to grow at 15 percent. If these forecasts are true, what will their levels of real GDP be next year? Is this a case of divergence or convergence?
- When capital’s share of output (a) is larger, does an economy move to its balanced-growth path more quickly or more slowly? Explain.
- Suppose that capital’s share of output is 0.5, the human capital growth rate is 2 percent, the technology growth rate is 1 percent, and the workforce is not growing. What is the balanced-growth growth rate of output?
- Look at Table 21.6 "Approaching the Balanced-Growth Path". Explain why the output growth rate decreases over time.
- (Advanced) Think about Juan in Solovenia. Consider two cases. In the first case, he experiences an increase in his productivity that he knows will last for only one month. In the second, he experiences a permanent increase in his productivity. How do you think his decisions about how hard to work will be different in the two cases?
-
On a balanced-growth path, the ratio of capital stock to output is given by the following formula:
Use the formula for the balanced-growth rate of output to determine how the ratio of capital stock to output depends on the growth rate of the workforce. Does an increase in the growth rate of the workforce lead to an increase or a decrease in the ratio of capital stock to output?
Economics Detective
- Find savings rates for the United States, India, and Niger and compare these to the investment rates for these countries. What can you say about capital inflows from other countries?
- Go to the Penn World Tables (http://datacentre2.chass.utoronto.ca/pwt61). Click on “Alphabetical List of Countries.” Select the United States and two other countries of your choice. Look at the data for real GDP per capita and real GDP per worker. Briefly describe in words what has happened to these two variables over the period for which data are available.
Spreadsheet Exercises
- Using a spreadsheet, reproduce Figure 21.13 "Output and Capital Stock in a Balanced-Growth Economy". Specifically, suppose that GDP starts with the value 10 in the year 2000, and capital stock in the same year has the value 20. Now set the growth rate of each series equal to 3 percent (0.03). What is the capital stock in 2050? What is GDP? Has the ratio of capital stock to GDP stayed constant?
- Using the same spreadsheet and keeping the growth rate of GDP equal to 3 percent, examine what happens if the growth rate of capital is (a) 1 percent; (b) 5 percent.
-
Suppose that an economy has the following production function:
Suppose that the workforce is growing at 1 percent per year, and human capital is growing at 2 percent per year. (We are assuming technology is constant in this example.) Suppose that we find that the ratio of capital stock to GDP is 4 on all dates and, initially, human capital is 15,000. What are the values for the growth rate of output per worker, the growth rate of output, and the growth rate of capital?
- By experimenting with a spreadsheet, find out how long it will take for output per worker to double in this example.