This is “The Demand for Automobiles”, section 17.1 from the book Theory and Applications of Economics (v. 1.0). For details on it (including licensing), click here.
For more information on the source of this book, or why it is available for free, please see the project's home page. You can browse or download additional books there. To download a .zip file containing this book to use offline, simply click here.


17.1 The Demand for Automobiles
Learning Objectives
- What determines a household’s demand for a car?
- In what sense is a car an asset?
- What are some of the complementary goods and services for cars?
People don’t buy cars only because they want to look at a piece of fine engineering and enjoy a luxurious ride (although this sometimes plays a role). They buy cars because they want to be able to travel from one place to another. The demand for automobiles is a piece of a larger market: the demand for transportation in general. As the price of a particular car increases, the law of demand tells us that the quantity demanded of that car will decrease. There are three kinds of substitution at work here. In response to a price increase, households can
- delay the purchase of a new car,
- choose to purchase another type of car, or
- choose not to buy a car and use another mode of transportation instead.
Suppose you are thinking of buying a car, but the price of your favorite model increases. One possible response would be to delay your purchase until a later time. With this form of substitution, you decide not to buy a new car right now. This does not mean you will never buy a new car. Instead, you are keeping your options open for the future: you will drive your old car for perhaps another year and then search again next year for a replacement. Next year, of course, you might decide to defer your purchase still further. A second possible response to a price increase in your preferred model is to purchase another type of car. There is a substitution effect at work again, but now it applies across cars rather than over time. Perhaps you are indifferent between buying a Ferrari racing car and a Mini Cooper. If the price of the Mini Cooper increases, you would be induced to buy the Ferrari. Finally, if the price of your preferred car increases, you might substitute another form of transportation for your car, such as a bicycle or the bus. From this perspective, your demand for a car is really a demand for transportation.
Household Demand for Cars
The decision to buy a car is best understood as an example of unit demand. Most households—even if they own more than one car—do not buy a large number of cars at a time. Instead, they buy a single car. The decision about whether or not to purchase a car thus involves comparing the valuation a household places on the car with the price of the car. One way to illustrate this is to look at the household’s budget line when it does or does not purchase a car.
Toolkit: Section 31.1 "Individual Demand"
You can review unit demand, valuation, and budget lines in the toolkit.
The household’s choice is shown in Figure 17.1 "The Household’s Budget Line When It Does or Does Not Buy a Car". (This draws on our presentation of unit demand in Chapter 4 "Everyday Decisions".) The household can spend income on three items: chocolate bars, downloads, and a new car. If the household chooses not to buy a car, then it consumes the combination of downloads and chocolate bars indicated by point A in the graph. This is the household’s most preferred point in the budget line, given that it does not buy a car. If the household buys a car, then the combination of downloads and chocolate bars it consumes is given by point B. The budget line is shifted inward by the amount of income the household spends on the car—that is, by an amount equal to the cost of the car. The household’s decision about whether to purchase the car involves comparing bundle A to (bundle B plus a car).
Figure 17.1 The Household’s Budget Line When It Does or Does Not Buy a Car
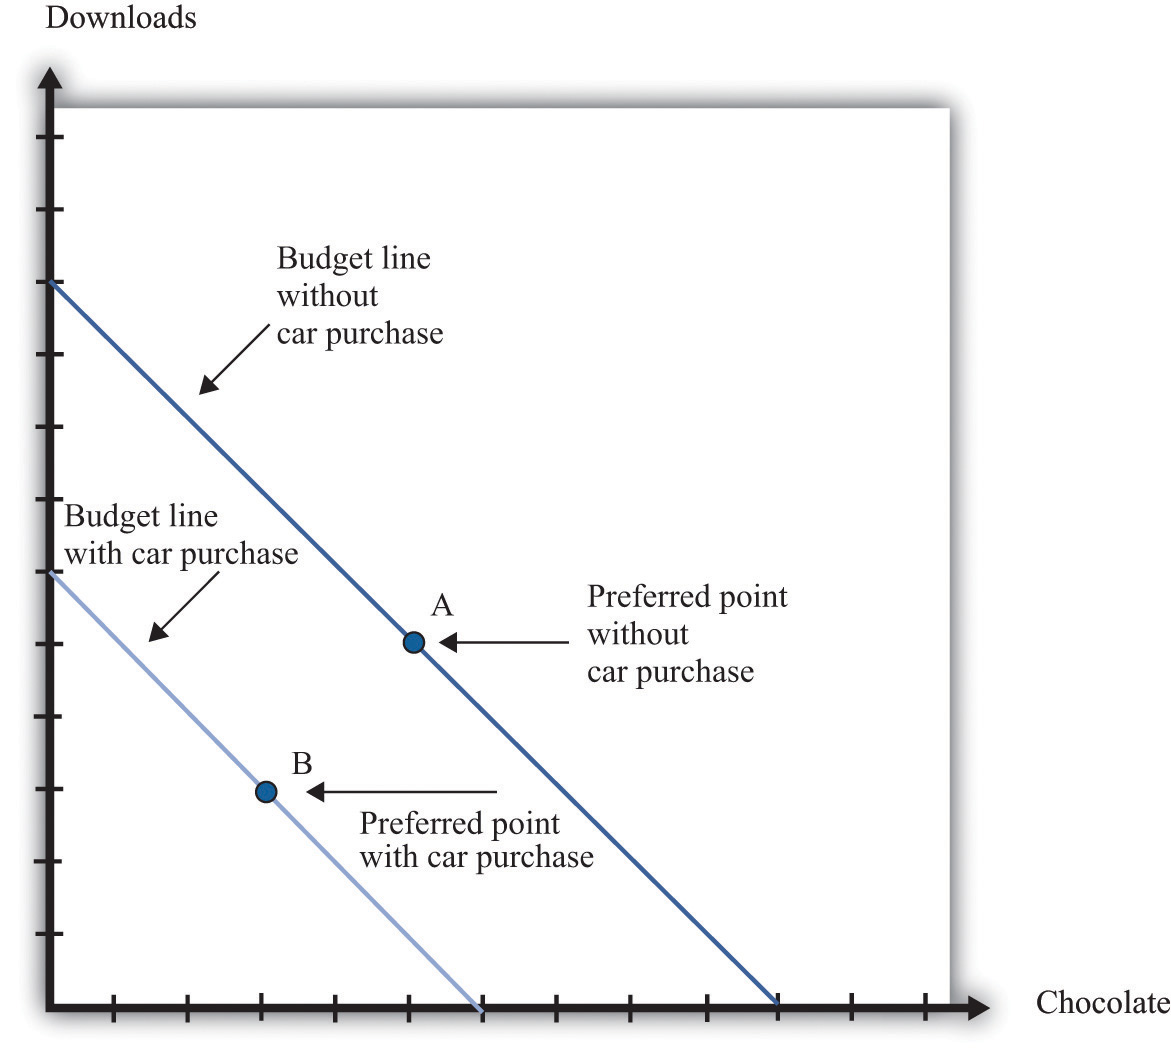
Here we illustrate a household’s choice about whether or not to purchase a car.
Remembering the idea of buyer surplus, this is the same as saying that the household would buy the car if the purchase gave it some surplus. In other words, the household’s decision rule is
purchase car if valuation of car − price of car = buyer surplus > 0.If the price of the car is greater than the household’s valuation, the household prefers point A to point B and does not buy the car. If the price of the car is less than the household’s valuation, it prefers point B to point A and buys the car.
Toolkit: Section 31.10 "Buyer Surplus and Seller Surplus"
Buyer surplus was introduced in Chapter 6 "eBay and craigslist". You can also review the various kinds of surplus in the toolkit.
There is another way of looking at the same decision that gives us a way to measure the household’s valuation of the car. Remember that the household’s valuation of the car is the maximum amount that it would be willing to pay for it. Look again at Figure 17.1 "The Household’s Budget Line When It Does or Does Not Buy a Car" and begin at point A. Now move the budget line inward until we find that the household is just as happy at point A or point B. We have now found the point where the household is indifferent between the combination of chocolate bars and downloads it buys without a car and the bundle it buys along with the car. The amount by which we have moved the budget line is the household’s valuation of the car.
If there were only a single model of car for the household to choose from, we could stop here. The household would compare the valuation of the car against the price and buy the car as long as the valuation is greater than the price. Today, however, cars differ in numerous ways. Like many goods, a car consists of many different features all bundled together. These include the car’s performance features, styling, color, and sound system; whether it has leather seats, a sunroof, and air conditioning; and hundreds of other attributes that we could list. The household’s valuation of a car embodies a valuation of each attribute of a car.
This complexity makes the decision to buy a car a challenge. How can this decision be made? For every car available on the market, the household can calculate the buyer surplus attainable from that car. After considering all these alternatives, the household should then buy the car that gives the most surplus. Of course, households do not literally sit down with a list of cars and try to calculate the exact surplus from each one. But this is a useful, if stylized, representation of how such choices are made. In effect, the household is making a unit demand decision—buy or not buy—about every single car. For almost all cars, the household chooses to purchase zero.
(There is a subtlety you may be wondering about here. Hundreds of different cars might yield positive surplus, but obviously the household does not buy hundreds of cars. The trick is that, once the household has bought the car that gives the highest surplus, the valuation of all other cars it might consider buying decreases substantially. If you don’t own a car, then a Ford Focus might be very valuable to you. If you already own a Mazda 5, then the value of a Ford Focus would be much smaller.)
Deciding what car to buy is only one part of the household’s decision. As we already noted, the household must decide when it wants to buy a car. A car is a durable goodGoods that last over many uses.; it lasts for several years. If a household already has a car, it can decide to defer purchase of a new car until later. A household is likely to do this if (1) there is substantial uncertainty about future income (perhaps members of the household fear losing their jobs) or (2) cars are likely to be relatively cheaper in the future. To understand this choice, we turn to some of the tools introduced in Chapter 5 "Life Decisions", and Chapter 10 "Making and Losing Money on Wall Street".
A car is an asset: it yields a flow of services. As a consequence, buying a car is both an act of consumption and an act of saving. This means that the decision to buy a car is an example of decision making over time. The household looks at both current and expected future income when deciding about the purchase, and it knows that the car will yield benefits for many years. Furthermore, because a car is an asset, its valuation today depends on its value in the future. You might buy a car this year and then discover your transportation needs have changed. In that event, you can sell your car in the used car market. The more you expect to get for your car whenever you might sell it, the more you are willing to pay for it today.
The demand for a particular car also depends on factors other than the price of the car itself. The prices of other goods—most importantly, other cars and other forms of transportation—also matter. Household income, both now and in future years, is another determinant of demand. Finally, because you often purchase a car with a car loan, the interest rates charged on loans may matter for your car purchase. A decrease in the interest rate for car loans will increase the demand for cars.
In sum, buying a car is a very complex decision. There are rich substitution possibilities involving the choice of different models, the timing of the purchase, and the possibility of using public transportation rather than owning a car at all. The law of demand applies to cars, just as it does to other goods and services. But as we move along the demand curve in response to a change in the price of cars, the substitution possibilities are complex. Understanding these substitution possibilities is critical when firms are choosing the prices to set for the cars that they produce.
Complementary Products
There are several products that are complementary to the purchase of a car. Here we look at three: gasoline, insurance, and infrastructure. A complementary product is one for which the cross-price elasticity of demandMeasures the response of the quantity demanded of a good to a change in the price of another good. is negative. In other words, we expect that if the price of gasoline increases, the quantity of cars purchased will decrease.
Toolkit: Section 31.2 "Elasticity"
The cross-price elasticity of demand measures the response of the quantity demanded of a good to a change in the price of another good. Formally, it is the percentage change in the quantity demanded of one good divided by the percentage change in the price of another good:
- If the cross-price elasticity of demand is a negative number, then the quantity demanded of one good decreases when the price of the other good increases. In this case, we say that the two goods are complements.
- If the cross-price elasticity of demand is a positive number, then the quantity demanded of one good increases when the price of the other good increases. In this case, we say that the two goods are substitutes.
Gasoline
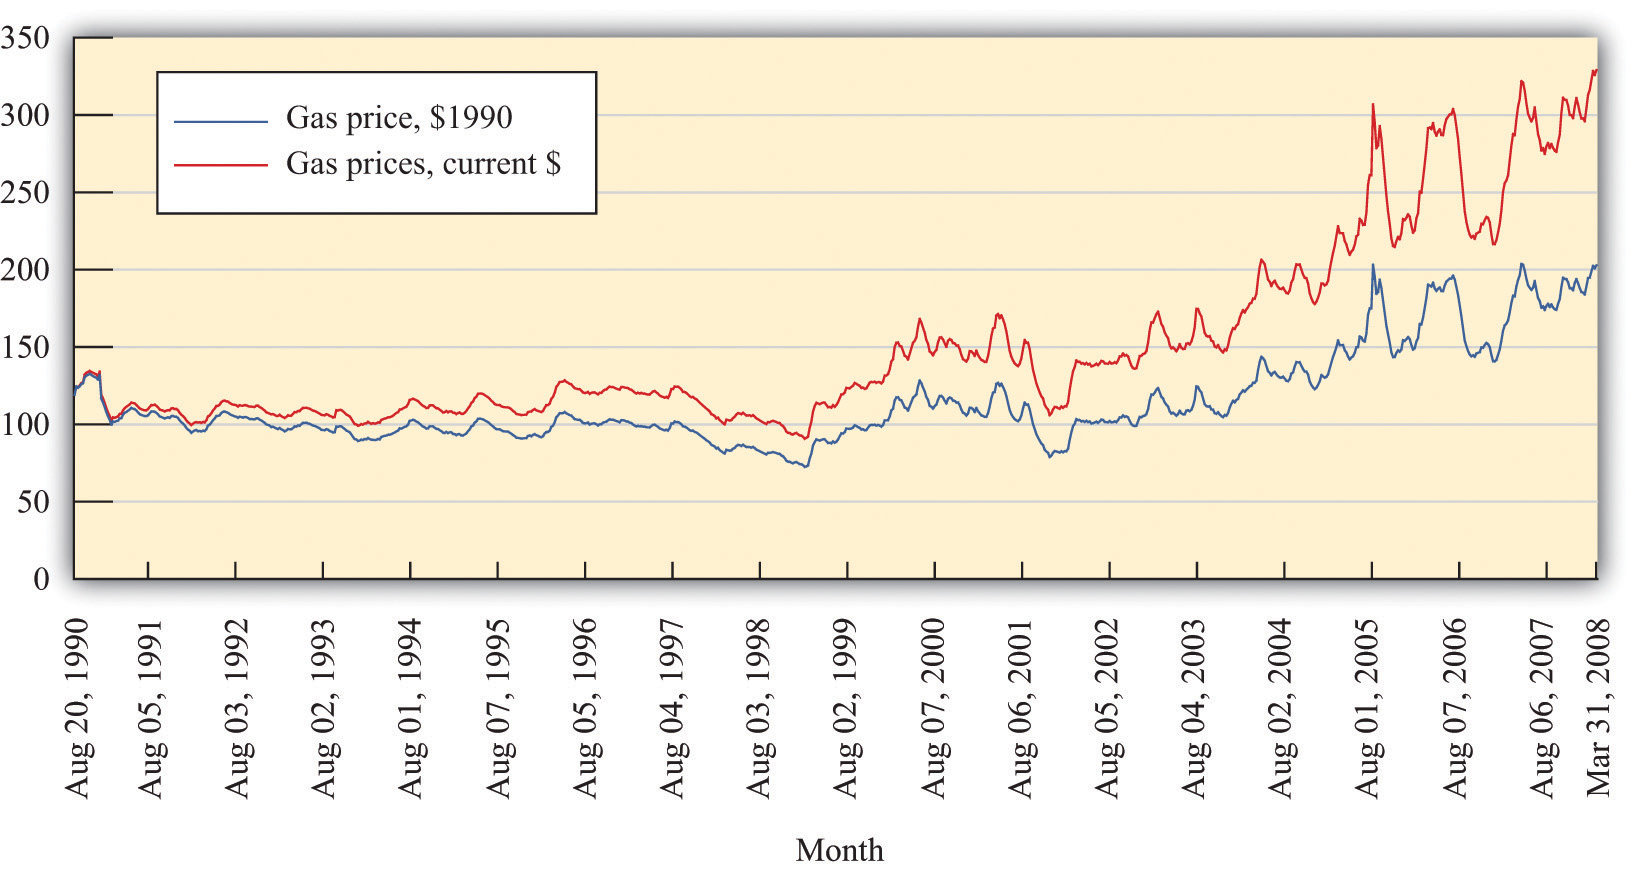
During late spring of 2008, the price of oil and gasoline rose considerably. By the end of May, the price of unleaded gas averaged over $4.00 per gallon in major US cities. Figure 17.2 "Gasoline Prices: Pennies per Gallon" shows the price of regular gasoline in the United States. The first series is just the price of a gallon of gas in pennies. The second shows prices after correcting for inflation; all prices are quoted relative to the price level in the base year of 1990. You can see from this figure that the dollar price of gas has increased steadily since August 1990, but once we correct for changes in the overall price level, the real price of gas was actually decreasing until around 1998. Since then, it has increased to about twice its 1990 level.
Toolkit: Section 31.8 "Correcting for Inflation"
You can review how to correct for inflation in the toolkit.
Figure 17.2 Gasoline Prices: Pennies per Gallon
What is the impact of an increase in the price of gasoline on the demand for cars?
- As the price of gas increases, buying and operating a car becomes more expensive. Thus we expect the demand for cars to decrease.
- An increase in the price of gasoline induces a move away from cars with low mileage per gallon to cars with higher mileage per gallon. This type of substitution is often seen after rapid increases in the price of gasoline.
- As the price of gasoline increases, individuals substitute competing means of transportation for cars. For example, an increase in the price of gasoline might induce commuters to use bicycles, take buses or trains, or walk to work.
All of these channels were in the news in 2008 as consumers responded to higher gasoline prices by driving less and buying more fuel-efficient vehicles.
If we think of cars in general, then the cross-price elasticity of demand with the price of gasoline is negative. But the second channel reminds us that, for fuel-efficient models, the cross-price elasticity of demand might be positive. Higher gas prices mean that fewer cars will be purchased, but households that do purchase favor cars that are more fuel-efficient. Remembering that cars typically last for several years, households think about not only the current price of gas but also what they expect gas prices to do in the next few years. If gas prices increase but consumers think that this increase is likely to be temporary, then people will drive less, but the demand for cars will be little affected. Conversely, if gas prices increase and consumers expect them to stay high for some years, we see a much bigger effect on the demand for automobiles.
The gas price increase in 2008 coincided with an intense battle between Senator Hilary Clinton and Senator Barack Obama for the Democratic presidential nomination. By this time, Senator John McCain had effectively won the Republican nomination. Senator Clinton and Senator McCain proposed a temporary reduction in the tax on gasoline in an effort to shield households from the high price of gasoline during the summer season. To see the effects of such a tax, we can use the tool of tax incidence, which we introduced in Chapter 12 "Barriers to Trade and the Underground Economy".
Toolkit: Section 31.11 "Efficiency and Deadweight Loss"
You can review tax incidence in the toolkit.
Figure 17.3 "The Incidence of a Tax on Gasoline" shows the effect of a tax on the price paid by a buyer and the price received by a seller. In part (a) of Figure 17.3 "The Incidence of a Tax on Gasoline", the demand for the product is very inelastic. As a consequence, when a tax is imposed, the price paid by the buyer increases a lot compared to the price in the absence of a tax. This means that when demand is inelastic, buyers bear the tax burden. Consequently, if a tax is removed, even temporarily, the price buyers pay will decrease considerably. As shown in part (b) of Figure 17.3 "The Incidence of a Tax on Gasoline", we reach the opposite conclusion if supply rather than demand is inelastic. When supply is inelastic, the price received by the seller varies with the tax, while the price paid by the buyer is almost independent of the tax.
Figure 17.3 The Incidence of a Tax on Gasoline
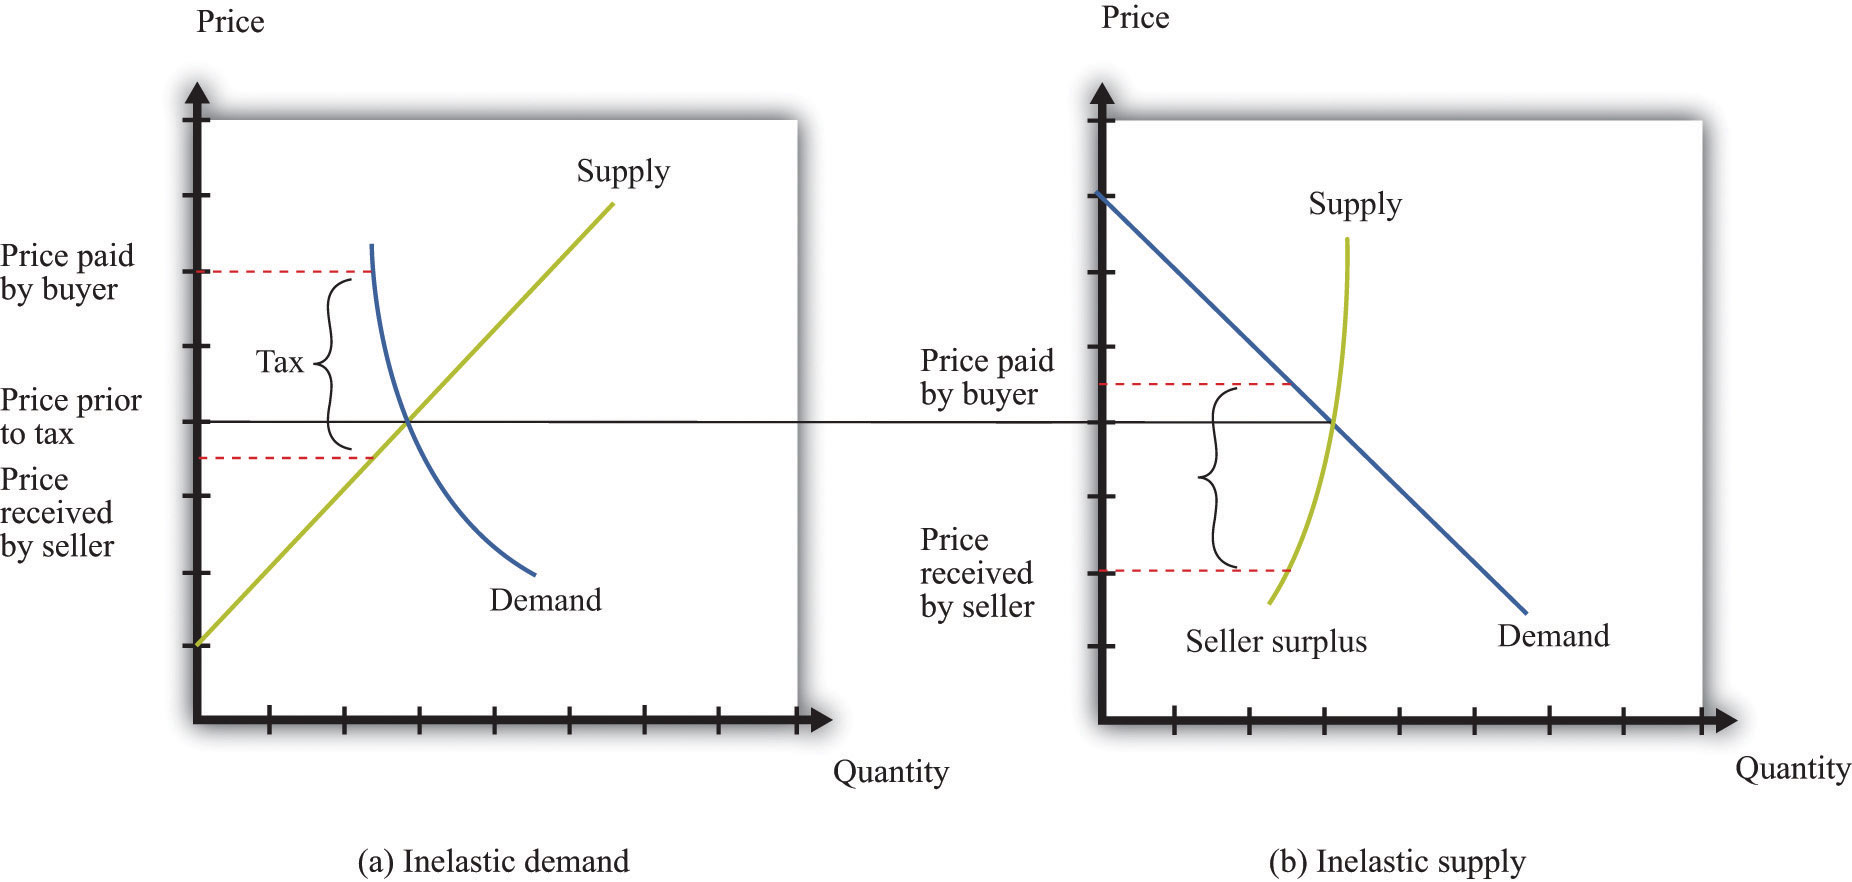
When demand is inelastic (a), the price paid by buyers increases a lot, and the price received by sellers decreases only a little bit, so most of the tax burden is borne by buyers. The opposite is true when supply is inelastic (b).
Whether a temporary repeal of the gas tax would reduce the price of gas depends on the elasticities of supply and demand in this market. The more inelastic demand is relative to supply, the more the tax reduction will lower the price paid by households. In fact, the supply of gas tends to be very inelastic in the short run because refining capacity is limited. Part (a) of Figure 17.3 "The Incidence of a Tax on Gasoline" is the one relevant for a temporary change in the gas tax.
Insurance
A second complementary product is car insurance. In most countries, having car insurance is mandatory. Typically, drivers must at the very least purchase some liability coverage, meaning that your insurance company will pay out if you are responsible for an accident that injures or kills another person or causes damage to a car or property. You may also choose to buy collision coverage to cover damage to your own car. You can also purchase “uninsured motorist coverage,” which protects you in the event you are in an accident with someone who is uninsured. Exactly what type of coverage you are able (or required) to purchase varies from country to country and from state to state in the United States.
You may be aware that your insurance rates depend on your age, gender, and driving record. Insurance companies work very hard to determine the probability you will have an accident and make a claim for funds from them. But they do not know exactly what that probability is for each person individually. Thus they rely on information about us, such as our age and sex, and also look at driving records for indicators of the likelihood that we will file a claim. If you have an accident and file a claim, the insurance company will often revise its assessment of how safe a driver you are and increase your premium. Such adjustments can be so severe that sometimes people prefer to fix their own car after a minor incident than have the insurance company handle a claim. It is even possible to obtain insurance against the costs of obtaining a traffic ticket. Getting a ticket can be expensive, both directly in terms of a fine and then through an increased insurance premium. Recognizing the desire of a household to shed this risk, insurance policies that compensate ticketed drivers for these costs are available.One such program can be found at the TraffiCare International home page, accessed March 14, 2011, http://trafficare.net.
Government restrictions on trades often lead people to avoid these restrictions. This was one of our themes in Chapter 12 "Barriers to Trade and the Underground Economy". In many states, insurance is required by law, yet drivers sometimes flout this law, choosing to drive without insurance instead. The law of demand tells us that the higher the cost of insurance, the more likely people are to drive without insurance.
If high insurance rates lead to a large number of uninsured motorists, then it is more likely that, if you have an accident, the other driver will be uninsured. In this case, your insurance company will be obliged to cover your damages, even if the other driver was at fault. Think for a moment about what this means from the perspective of an individual insurance company. If there are more uninsured motorists, then the insurance company expects to make higher payouts per accident, on average. This means that when there are more uninsured motorists, insurance premiums will be higher.
Economists Eric Smith and Randy Wright noticed that insurance premiums are very different in different places. In a paper titled “Why Is Automobile Insurance in Philadelphia So Damn Expensive?” they speculated that this was because of a coordination game. They argued that the decision to purchase insurance could lead to payoffs like those in Table 17.1 "A Coordination Game for Automobile Insurance". The rows show your decision about whether to buy insurance or not. The columns show other people’s decisions. The numbers in the table refer to your payoff from every combination of what you choose to do and what everyone else chooses. (To keep things simple, we state what your payoffs are when everyone else does the same thing. We also suppose that everyone else faces the same payoffs you do.)
Toolkit: Section 31.18 "Nash Equilibrium"
You can review the coordination game in the toolkit.
Table 17.1 A Coordination Game for Automobile Insurance
| Everyone Else Buys Insurance | Everyone Else Does Not Buy Insurance | |
|---|---|---|
| You Buy Insurance | 10 | 2 |
| You Do Not Buy Insurance | 4 | 8 |
Look at the first column. This says that if everyone else purchases insurance, then you have an incentive to do so as well. We see this in the table because 10 is greater than 4. Because everyone else buys insurance, the price of insurance will be relatively low, and you will be induced to buy insurance as well. Thus one Nash equilibrium of this game is for everyone to buy insurance. Now look at the second column. Here, everyone else is an uninsured motorist. If no one else buys insurance, your insurance will be very costly. This will induce you not to buy insurance either (8 is greater than 2). Thus there is a second Nash equilibrium of this game in which no one buys insurance.
If, as Smith and Wright suggested, Philadelphia was an example of a city in which no one bought insurance, you can see from Table 17.1 "A Coordination Game for Automobile Insurance" that everyone there wished that other people bought insurance. Everybody is better off in the Nash equilibrium where everyone buys insurance. But starting from the equilibrium in which no one buys insurance, no single individual, acting alone, can coordinate everyone else’s choices to reach the preferred outcome.
Infrastructure
Gasoline and insurance are products that are complementary to automobiles. There is another significant complementary product—the roads on which you can drive your car. Without roads, cars have limited value. The same argument applies to bridges and highways and even to the police who enforce the laws of the road. These various kinds of infrastructure serve to increase the value of a car.
Figure 17.4 Idealized Effect of Good Roads on the American Rural Landscape
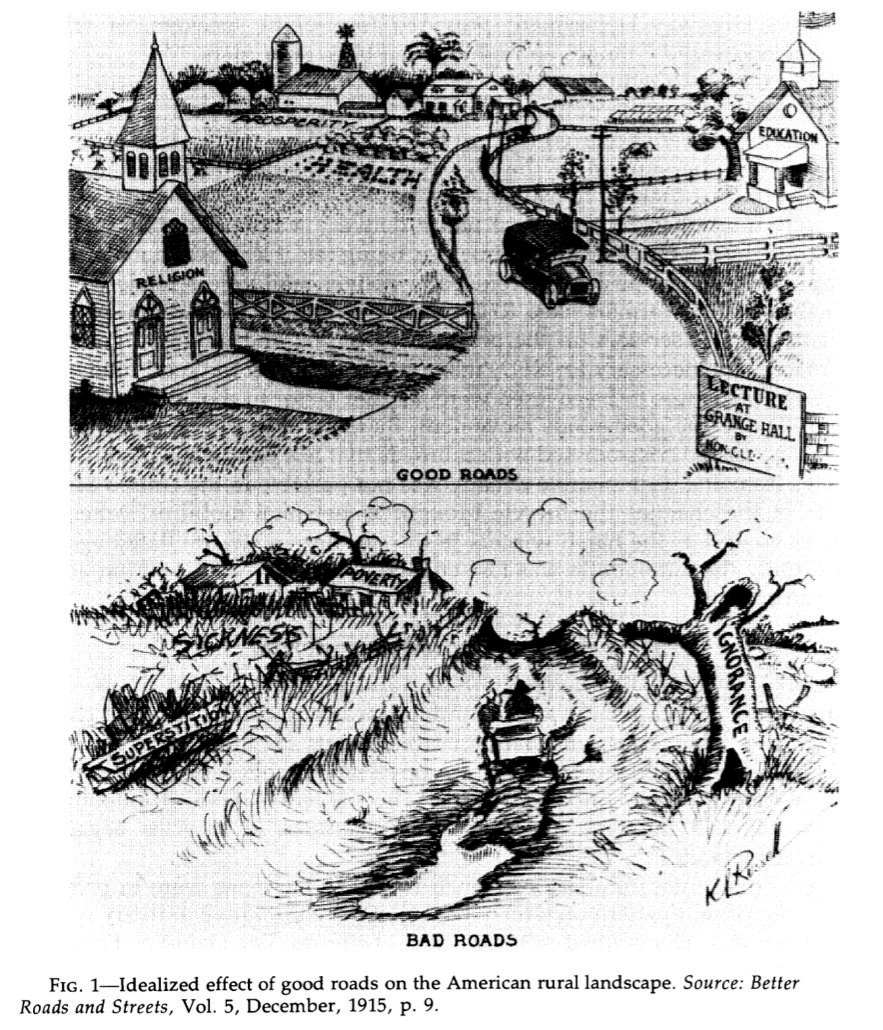
Source: Better Roads and Streets, Vol. 5, December 1915, p. 9.
This cartoon, which is taken from an article on the history of automobiles in the early 20th century, illustrates the link between car demand and roads.The cartoon comes from Peter Hugill, “Good Roads and the Automobile in the United States 1880–1929,” Geographical Review, July 1982, 327–49. The value of a car is much higher in the setting labeled “good roads” compared to that labeled “bad roads.” In the developed countries of the world, we now take good roads as a given, but that was not the case at the start of the automobile industry. The evolution of roads was directly linked to the spread of automobiles as a form of transportation. There was a seasonal aspect to this as well. After a long hard winter, the roads were not ready for use, and additional maintenance was needed to put them back into shape for drivers.
The infrastructure of an economy is a special type of good, called a public goodA good that can be provided to many users without excluding anyone.. A public good has two characteristics:
- Nonrivalry. Public goods are nonrivalA good in which one person’s consumption of that good does not prevent others from also consuming it.. A good is nonrival if one person’s consumption of that good does not prevent others from consuming the good as well. In other words, if you supply a nonrival good to one person, you can supply it to everyone.
- Nonexcludability. Public goods are nonexcludable. We discussed this idea in Chapter 14 "Cleaning Up the Air and Using Up the Oil". A good is nonexcludable if it is not possible to selectively exclude people from access to the good. In other words, if you supply a nonexcludable good to one person, you must supply it to everyone.
There are many examples of public goods, such as roads, bridges, highways, police services, national defense, and lighthouses. Because public goods are nonexcludable, it is difficult for a private firm to produce them. After all, it is hard to expect someone to pay a positive price for a good if she can always get it for free. Instead, governments generally provide these goods. In the United States, local or state governments may provide roads and bridges, while the federal government is the provider of the highway system. Because these goods are not privately produced and traded in the economy, we cannot rely on supply and demand to determine the quantity of these goods produced in an economy. The quantity of public goods produced is an outcome of a political process.
Suppose the government is thinking about building a bridge. The cost of building the bridge depends on the design and the cost of materials and labor. We take this cost as given. Because everyone in the community can use the bridge, the benefits flow to everyone, not to any particular individual. Suppose the government knows how much each citizen in the community values the bridge: call these the individual valuations. Consider then the following procedure.
- The government adds together the individual valuations of the bridge. Call the total the social benefit from the bridge.
- The government builds the bridge if the social benefit of the bridge exceeds the cost of the bridge and does not build it otherwise.
- The government uses its power of taxation to raise revenues to build the bridge.
This is a rule that determines which public goods should be provided. It is a rule that leads to the efficient provision of public goods: those with a large enough social benefit are provided, those with a lower benefit are not. More precisely, by following this rule, it is possible for the government to make sure that public goods are provided only when their provision makes everybody better off. Whenever the rule justifies the building of the bridge, the government can tax each individual an amount that is less than that person’s individual valuation of the bridge and still raise enough money to finance the building of it.
There are two major problems with this scenario. First, we supposed the government knew everybody’s valuation. Obviously, this will not be true in practice. The government could ask people to provide their valuations, but the problem here is that people have no incentive to tell the truth. In particular, if people thought that the amount they would be taxed was related to their valuation, then they would have an incentive to understate their valuations. Second, even if people truthfully revealed their valuations, the tax scheme might be perceived as very unfair because different people would be taxed different amounts.
To see in more detail how this incentive problem arises, imagine a different rule. Individuals in the community individually decide how much to contribute to the construction of the bridge.Marco Haan and Peter Kooreman, “Free Riding and the Provision of Candy Bars,” Journal of Public Economics, February 2002, 277–92. The bridge is built if the sum of everyone’s contributions exceeds the cost. Because the bridge is a public good, each resident enjoys the benefit of the total bridge, not only the segment built by their individual contribution. You benefit from the contributions of others, and they benefit from your contribution. If everyone independently decided how much to contribute to the construction of the road, they would be unlikely to contribute at all. If others are not contributing, then there is no reason to contribute because the bridge will not be built anyway. And if others are contributing enough to finance the bridge, then you can benefit without having to pay.To be more precise, you would contribute only in the unlikely event that the amount you are willing to pay would make the difference between the bridge being built or not. We expect that the contributions will, from a social perspective, be small or zero because each member of the community ignores the benefit of his or her contribution to others.
More generally, there will be underprovision of public goods because individuals do not take into account the effects of their contributions on others’ well-being. This is sometimes called a “free-rider problem.” The term comes from the fact that if everyone else pays for the good, you can travel for free.
Key Takeaways
- The demand for cars is an example of unit demand.
- A car is an asset because it is a durable good that can be resold.
- Gasoline and insurance are two important complementary products to cars. Infrastructure, such as roads and bridges, is also a complementary product to cars. Because such infrastructure often has the characteristics of a public good, the government often provides it.
Checking Your Understanding
- Suppose there is a temporary shortfall in refining capacity, so the supply of gasoline decreases for a three-month period. Use a supply-and-demand diagram to show what happens to the price of gasoline and to the quantity traded. What implications will this have for (a) how much people drive and (b) the demand for automobiles?
- If everyone is required by law to have car insurance, what will happen to the demand for cars?