This is “The Science of Sustainability”, chapter 2 from the book Sustainable Business Cases (v. 1.0). For details on it (including licensing), click here.
For more information on the source of this book, or why it is available for free, please see the project's home page. You can browse or download additional books there. To download a .zip file containing this book to use offline, simply click here.


Chapter 2 The Science of Sustainability
Introduction
Learning Objectives
- Discuss the key interrelationships among human, earth, and natural systems and why these are important for sustainable businesses.
- Explain the main ways that businesses and individuals affect ecosystems and the environment.
- Understand the energy use by businesses in modern society and why this is relevant for sustainable businesses.
Sustainability involves having an understanding of the relationship between business, humanity, and nature. Clean air, drinkable water, food, clean environment, and shelter are fundamental to human survival and to business existence. Natural resources are often taken as a given and not appreciated for how essential they are to human well-being and survival and to business operations. Think for a moment, what life would be like if we did not have clean air to breathe, clean drinking water, or food to eat. And what would businesses do without all these resources and without healthy and productive people and workers. These are all resources originating from natural systems.
Sustainable businesses are concerned about the impact of their organizations on the environment, society, and future generations. To ascertain how humans and business operations impact the natural environment, it is important to understand basic concepts of earth, atmospheric, and ecological systems as well as social and political systems.
Sustainability has evolved into a broad science integrating earth system (e.g., air, water, agriculture) disciplines with social sciences, including economics and sociology, to understand the complex cultural, environmental, and economic interrelationships that exist among humans, human organizations, and natural systems. Intergenerational equity, or the concept of fairness and justice between different societal groups and future generations, is a key area of concern in the societal component of sustainability.
This chapter integrates discussion of the environment, society, and economics. It begins by discussing two contrasting perspectives of human economic interaction with the environment. One view highlights the ecological limits to growth, and the other highlights how human invention and ingenuity seeks to remove limits to growth. We suggest that these two views are not mutually exclusive—that there are limits to growth but that some of these limits can be addressed and overcome through human and business innovation and adaptation.
The chapter then gives an overview of how earth and natural systems work. This will include descriptions of earth system components and then a focus on threats to well-functioning earth systems. The chapter concludes with a discussion of sustainability science areas that are particularly relevant to business, including how sustainability concepts are being integrated into the economy.
2.1 Sustainability Economics
Learning Objectives
- Discuss two common views of growth and be able to describe the key features of both views.
- Understand how both views of growth are relevant for sustainable businesses.
Limits to Growth Concept
Figure 2.1 Earth
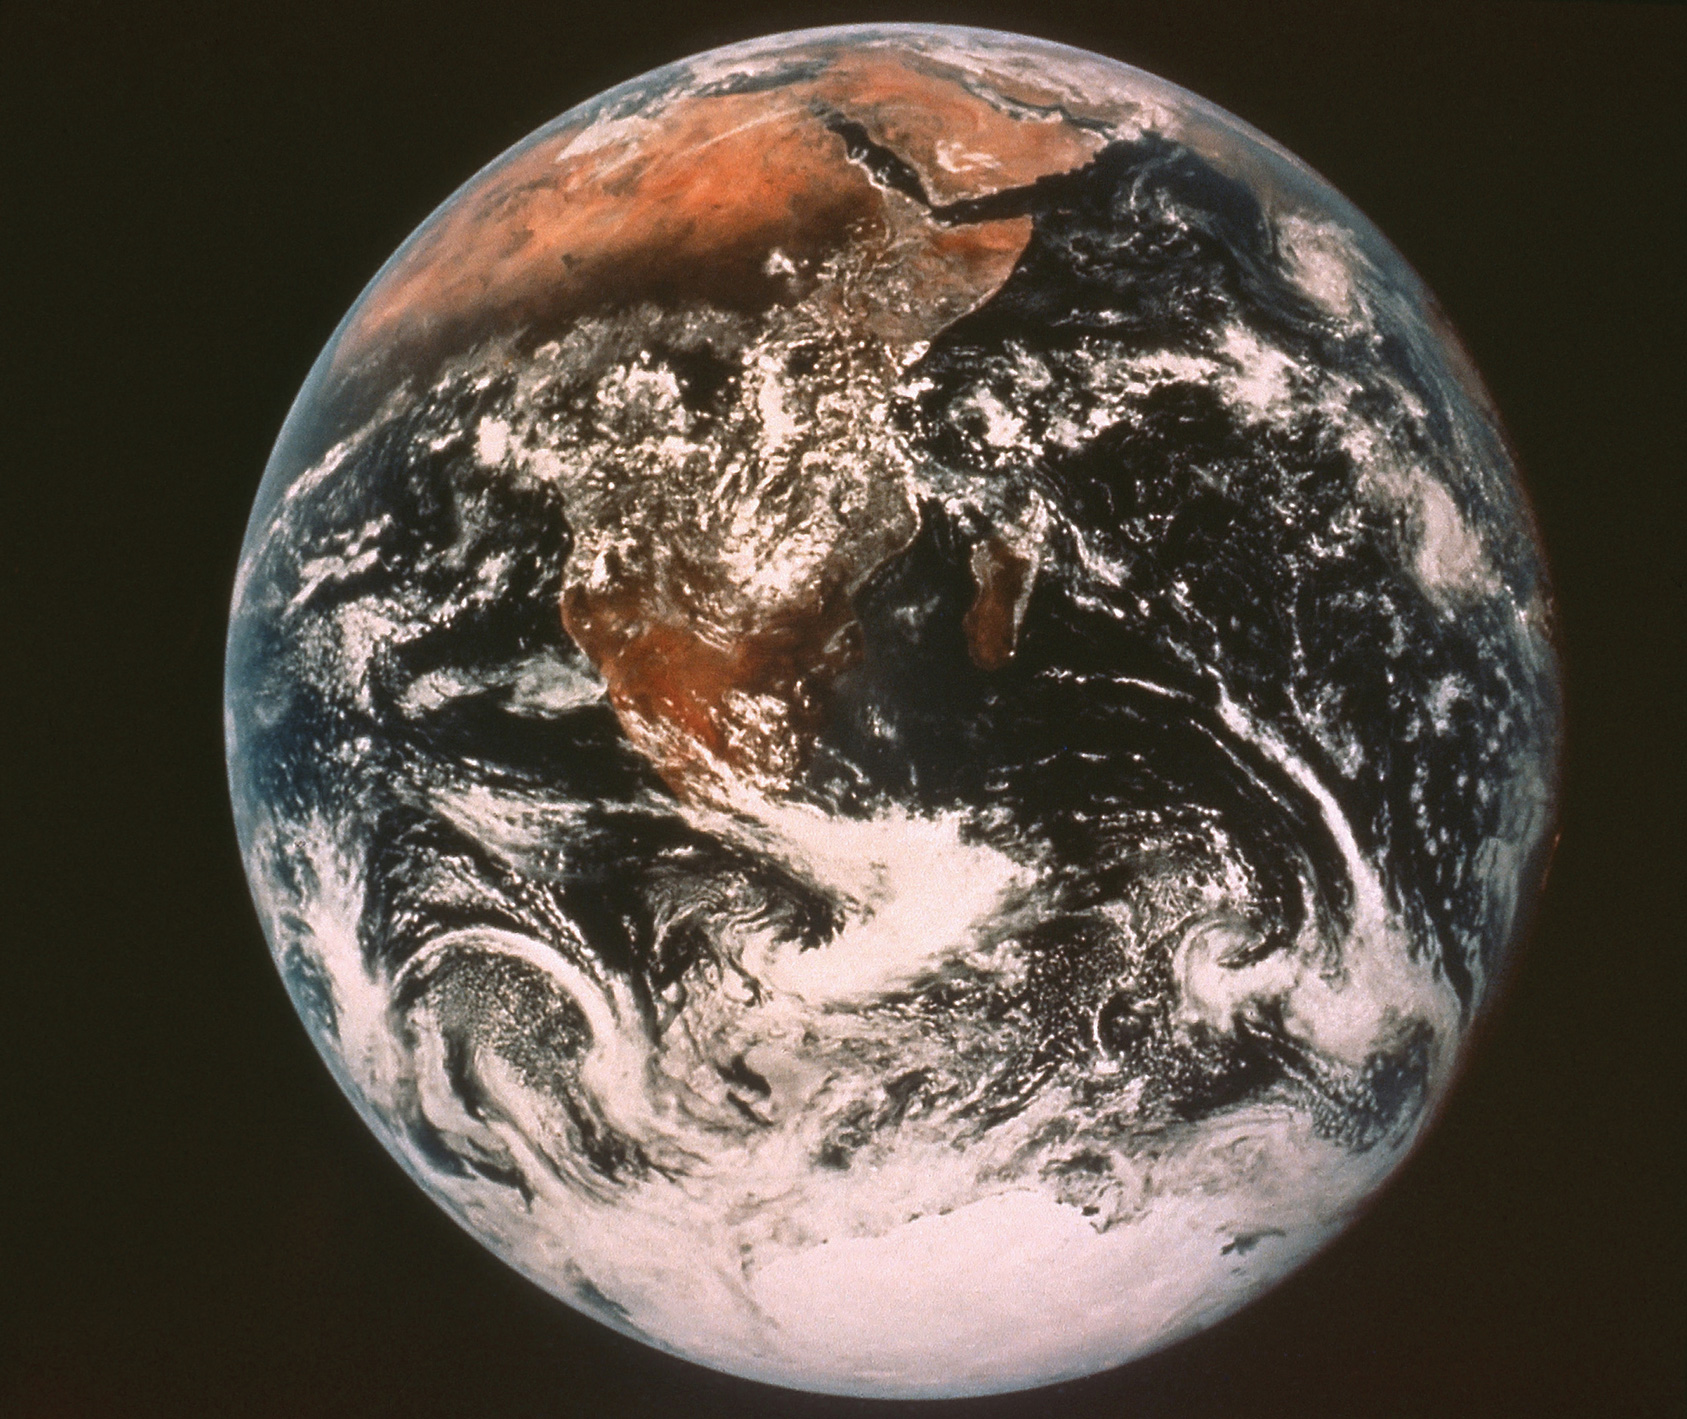
© Thinkstock
The limits to growthA view of the interaction of human economic systems with global natural resources that under a business-as-usual scenario, the human population will outstrip the ability of Earth to sustain it. concept posits that unlimited economic growth is not possible—that at some point the world’s growing population will consume too great a quantity of natural resources (such as clean water and fossil fuels) for human society to exist. Reverend Thomas Robert Malthus (1766–1834) raised the issue of the growing population in the context of limited food resources in his “An Essay on the Principle of Population.” He postulated that “population, when unchecked, increases in a geometric ratio. Subsistence increases only in an arithmetical ratio.”Thomas Robert Malthus, An Essay on the Principle of Population (London: J. Johnson in St. Paul’s churchyard, 1798). In other words, that human growth would outpace the ability of natural resources to keep up. This was in contrast to the overall positive sentiment of the era of continued human progress and improvement, and he viewed humans to “be condemned to a perpetual oscillation between happiness and misery, and after every effort remain still at an immeasurable distance from the wished-for goal.” As a reverend, Malthus sought to explain why there was poverty and misery, and he believed the reason to be directly attributable to shortages of resources (means of sustenance, such as food).
The limits to growth perspective reached the global public with the 1972 publication of Limits to Growth, a research study by the Massachusetts Institute of Technology (MIT) Systems Lab, released by the Club of Rome. Since its publication, the book has sold millions of copies in thirty different languages.
MIT scientists ran a computer simulation of an integrated global model (called World3) that linked the world economy with the environment. The five main variables in the model were world population, industrial production, food production, resource consumption, and pollution. The authors explored interrelationships and feedback patterns by altering growth trends among the five variables.
The model predicted that continued growth in the global economy would lead to global population and economic collapse in the mid-twenty-first century as a result of increased ecological damage and decreased resources. They also found that collapse could be avoided with changes in policy, behavior, and technology.
The study presented, what was for many at the time, a novel finding that the demands of the human population could exceed the carrying capacityThe population of a species that the environment can sustain indefinitely. This is also known as sustainable harvest or sustainable catch. of the earth. The MIT group identified the need to stabilize growth so that humans could live within the ability of the earth’s natural system to provide a sustainable yield of resources essential to human life. They found that technology alone could prolong but not prevent a system collapse. In an increased technology scenario in which 75 percent of materials were recycled, pollution reduced to 70 percent of 1970 levels, and agricultural land yields increase 100 percent, world collapse was pushed off to the end of the twenty-first century.The Limits to Growth: A Report for the Club of Rome’s Project on the Predicament of Mankind (New York: Universe Books, 1972).
Here is an illustrative example of the concept of limits to growth. Assume that five acres of grassland is required to sustainably feed one cow annually. This means that five acres is able to regenerate itself and support the grazing of one cow and that this same cycle of growth and consumption can occur year after year. In other words, the carrying capacity of five acres of grassland is one cow. If you were a farmer with one hundred acres of grassland and you had one cow, there would be more than enough grass available to feed that one cow and have the grass regenerate itself for perpetuity. The farmer could add up to twenty cows on the one hundred acres and every year the grassland would produce enough grass to feed all twenty cows.
Now suppose the farmer wants to increase his annual profits, and he adds another ten cows to the one hundred acres. There probably is enough grass to feed those cows for that year, but now the overgrazing is compromising the ability of the grass to replenish itself. The resource base degrades because the demands on the grassland are greater than its capacity. Perhaps the next year only 90 percent of the grass grows back, and it is not as healthy as before. Continuous overgrazing further degrades the grassland until it is no longer capable of supporting any cattle.
What would happen instead if the farmer believing that he can push profits even further decided to increase the herd size each year by another ten cows? Then the degradation of grassland will proceed at an even faster rate. Even if the farmer does achieve some short-term profitability increase by exploiting the grassland, it is at the expense of productive grassland in the future. Once damaged, it may take years or decades for the grassland to recover or it may never return to its former productive capacity.
This example illustrates the basic concept of limits to growth—that at some point rising resource demand runs into some very hard resource limitations.
No Limits to Growth Concept
It can be argued that throughout most of the nineteenth and twentieth centuries the dominating paradigm in the United States and Europe and most of the developed world has been that there were few limits to economic growth and that economic growth is always desired.
“No limits to growthA view of modern economic society that maintains that man will be able to maintain constant growth and overcome resource limitations.” is not an articulated theory per se, but it is, to a significant degree, implicit in modern economic thinking. “No limits” thinking highlights the efficacy of the private market. Underpinning “no limits” is the idea that resource scarcity—a major factor in “limits to growth” thinking—can be effectively addressed by economic laws of supply and demand. Laws of supply and demand do work; as resources become scarce, the market will reduce use by increasing the price of those resources.
The market and laws of supply and demand can serve to reduce demand for scarce resources and guide resource allocation to technology and innovation investments that can help address scarce resource concerns. Technology can help reduce resource demand through more efficient use of those resources. For example, a programmable thermostat can more efficiently heat and cool homes than a traditional thermostat. Increased prices will also favor substitution where another resource may be used in place of the scarce resource. An example of this would be building materials or furniture that no longer are produced using 100 percent real wood, as wood has become more scarce and expensive, but instead use wood-laminate and alternative composite materials.
Julian Simon (1932–98), a professor of business administration at the University of Maryland, is often cited in relation the cornucopia theoryAn ideology that human economic systems can overcome “and thrive” in the face of resource constraints and that there are no limits to economic or population growth.—that there are no physical limitations on economic growth or human population. In Simon’s book The Ultimate Resource (published in 1983), he states, “The supply of natural resources is infinite. Almost all trends in environmental quality are positive…There is only one scarcity: Human brain power ‘the Ultimate Resource.’”Julian Simon, The Ultimate Resource (Princeton University Press, 1983). He argued that human ingenuity combined with the correct market signals (pricing) would allow for humans to continually grow economically and the overall human condition would continue to improve, not worsen. He believed that increased consumption would heighten scarcity, which would translate into higher prices, in the short term. This would in turn stimulate entrepreneurship to seek new ways to satisfy shortages. Society eventually ends up better off than if the original shortage had not occurred.
NeoliberalismAn economic view that the private sector, not government, should determine economic and political priorities. This view emphasizes the private sector, open global trading markets, and tax reform. is a view of the global economic system that holds to the overall tenets of no limits to growth and cornucopian theory. In this view, the private sector, not government, should determine economic and policy priorities. Consistent with a cornucopian viewpoint, neoliberalism views business entrepreneurship (unfettered from government regulations and trade restrictions) as being able to make society better off by letting the marketplace determine the use of resources.
Related to this view of unlimited economic growth are consumerism and the underlying assumption that more consumption is always better for the economy. ConsumerismEconomic growth based on continuous and significant consumption of goods and services. is the belief that our economic systems should favor consumption and that the consumption should be for goods and services that are in excess of basic material needs for survival. Consumerism not only attempts to meet material needs and wants but allows for continuous economic growth. Christine Frederick (1883–1970), a home economist, discussed the need for planned obsolescenceDesigning products so that they will have a limited useful life so that consumers will need to dispose of those products and purchase new ones. This was believed to help stimulate economic activity. in an industrial economy stating, “The way to break the vicious deadlock of a low standard of living is to spend freely, and even waste creatively.”Christine Frederick, The New Housekeeping: Efficiency Studies in Home Management (Doubleday, Page & Company, 1913). In 1955, economist Victor Lebow observed, “Our enormously productive economy…demands that we make consumption our way of life…we need things consumed, burned up, replaced and discarded at an ever-accelerating rate.”Victor Lebow, “Price Competition in 1955,” Journal of Retailing, Spring 1955.
Currently, 70 percent of the $14 trillion US economy is driven by consumer spending. A focus on consumption, however, puts tremendous demand on natural resource systems. Natural resources are required to extract, produce, and transport the goods that we purchase, and the extraction, production, and transportation of these goods often release pollution and toxic chemicals in the process. Consumerism is not just limited to the United States, but as globalization of the economy continues, it is becoming universal across the world. Emerging economies such as China, India, Brazil, and Russia have experienced significantly increased demand for goods and services by consumers.
In the chapter on entrepreneurship, innovation, and sustainability, the market opportunities created by scarce resources are highlighted. The chapter will discuss how market signals regarding scarce resources can provide business opportunities for sustainable businesses.
Reconciling Limits and No Limits to Growth
The two views of limits to growth are both important for the business context of sustainability. Both views, at a fundamental level, influence sustainability discussions at a personal, business, and societal level. The earth does have limited resources and human activity can negatively impact the environment. Market forces are often effective in providing signals to society of resource scarcity and the need to change, innovate, and adapt. But even with the overall efficacy of markets, there are limits to the efficacy of the market perspective. Markets often fail to properly price natural resources that are treated as free goods, and this makes limits to growth a reality. Both arguments make important points that frame discussions of sustainability.
Tragedy of the Commons
An important concept relevant for sustainability is the “tragedy of the commonsA situation where different parties share a common good (such as open public land), and acting independently in their own self-interest, they will ultimately overexploit and deplete or destroy the shared resource..” This phrase was coined by the ecologist Garrett Hardin in a 1968 article in Science.Garrett Hardin, “The Tragedy of the Commons,” Science 162, no. 3859 (1968): 1243–48. The tragedy of the commons describes a situation where different parties share a common good (such as open public land), and acting independently in their own self-interest, they will ultimately overexploit and deplete or destroy the shared resource. The tragedy is that the individuals acting in a way that they believe is in their own best interest end up acting in a way that is detrimental to their collective and individual long-term best interests.
There are numerous examples of tragedy of the commons in modern life and the environment, including polluting the atmosphere, overharvesting fish stocks (see “What Happened to All the Fish” as follows), and polluting waterways. Related to our cattle example in the limits to growth discussion mentioned previously, tragedy of the commons can be illustrated in a simplified example involving cattle. If several cattle herders share a common (publicly shared) area of land and all herders are entitled to let their cattle graze on that land without restriction, there is the potential for tragedy of the commons to occur.
For each individual herder, it is in their self-interest to maximize their profitability by placing as many cattle as possible on the land. There is no direct incremental resource cost to the herder for each cow they add to the shared land, and the herder has increased revenue through greater cattle sales. If each herder acted in this manner, the quality of the common resource can be either temporarily or permanently damaged as a result of overgrazing if the total cattle population exceeds the carrying capacity of the shared land. Once carrying capacity is exceeded, all are negatively impacted, including, ironically, the herders who added to their cattle stock.
In this system, each herder receives all the benefits from adding additional cattle, while the resource damage to the common land is shared by all herders. What should also be noted is there is no economic incentive in this example for a herder to withhold cattle from the land because even if one herder chose not to add additional cattle over concern about damaging the shared land, there is nothing to prevent another herder from adding more cattle resulting in the same end result of a depleted resource.
Key Takeaways
- There are two main views of economics as pertains to sustainability: limits to growth and no limits to growth. Both views have merits in terms of explaining the interaction of society and environment.
- The limits to growth concept argues that our current society is living beyond what Earth is capable of providing and that we must change to live within the context of what Earth can provide.
- The no limits to growth concept argues that market signals and technological innovation can overcome limits to growth in natural systems.
- Tragedy of the commons occurs often in shared environmental resources, and understanding the system dynamics is essential to sustainability of shared natural resources.
- Consumerism is a factor in driving economic growth in modern economies and, as a result, resource depletion.
Exercises
- Discuss the merits of both limits to growth perspectives.
- In an online journal, find an article that illustrates an example of tragedy of the commons. Identify the “commons,” the individual actors, and the consequence of the situation.
2.2 Life and Climate System of Earth
Learning Objectives
- Understand basic concepts of Earth’s history and ecology.
- Identify key natural resources.
- Understand the interaction between ecosystem services and human well-being.
Brief History
The earth has sustained a wide and abundant variety of life for millions and millions of years, with the origin of life on Earth estimated to have begun 3.5 billion years ago. Humans only arrived in the last 500,000 years, or 0.01 percent of the total history of life on the planet. The forms of life and the climate have changed continuously and sometimes drastically over that time. The earth’s history is divided into three geological eras, but the most recent and the one that we currently live in is the Cenozoic, which began 65.5 million years ago. The most significant features of the Cenozoic era are a long-term cooling of the earth, the rise and diversification of mammals, and the evolution of humans. Previous eras featured a much warmer planet, a different atmospheric system, and a wide variety of life.
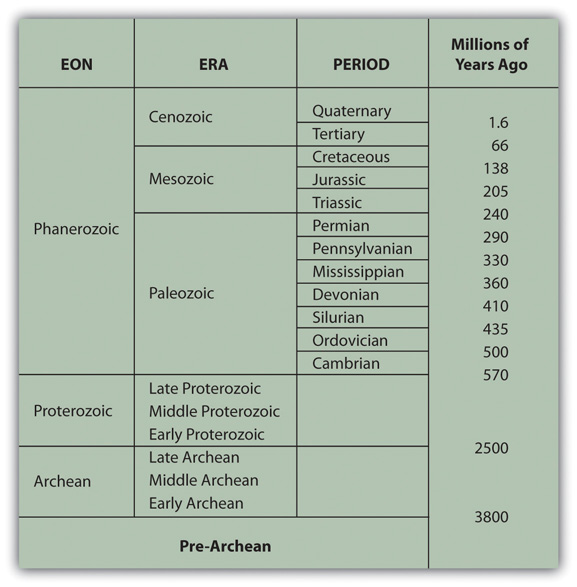
Source: Wikimedia, http://commons.wikimedia.org/wiki/File:Geologic_time_scale.gif.
A significant feature of the climate over the last 2.6 million years has been “ice ages,Describes the climate system over the last 2.6 million years, featuring, in general, a cooling trend with variations between cold and warm periods.” which are a continuous fluctuation between relatively cold (glacial) and warm (interglacial) periods. Glaciations are periods of extremely cold climate where a greater portion of the earth is covered with ice and snow. Interglacials are intermittent warming periods between glaciations, which feature a melting and retreat of ice from large portions of Earth. In the last 800,000 years there have seen eight glacial cycles—one occurring about every 100,000 years—with the last glaciation ending about 12,500 years ago. Currently we are in an interglacial time period. This last interglacial period is known as the Holocene and features the rise of modern human civilization and the current climate and earth system.
The glacial cycles are the result of a complex interaction of factors, including atmospheric composition (such as the concentration of carbon dioxide and methane), variations in the earth’s orbit, movement of tectonic plates, and changes in solar output. Of the different factors, periodic changes in the earth’s orbit, tilt, and precession (wobbling around its axis) are believed to be a major driver for ice ages when they occur in a specific combination that reduce the amount of sunlight reaching the earth. These changes are also known as Milankovitch cycles, named after the Serbian mathematician who theorized that these orbital changes were the cause of the ice ages. It is important to understand natural past climate change in the context of man’s impact on global climate changeA warming trend in the last 150 years that is above normal patterns and attributed to man-made causes, including deforestation and combustion of fossil fuels., which will be discussed later on in this chapter.
Ecology
Ecology is the study of life forms and their interaction and their relationship with the environment with a focus on how biological systems remain diverse, healthy, and productive. EcosystemsThe “web” or network of the interaction of living and nonliving factors in a specific geographic area. are the “webs” or complex patterns of interactions among a network of life in a specific place on Earth. Wetlands, forests, grasslands, coral reefs, and coastal estuaries are all examples of ecosystems. They are an interaction of living (biotic) and nonliving (abiotic) elements in a specific geographic area.
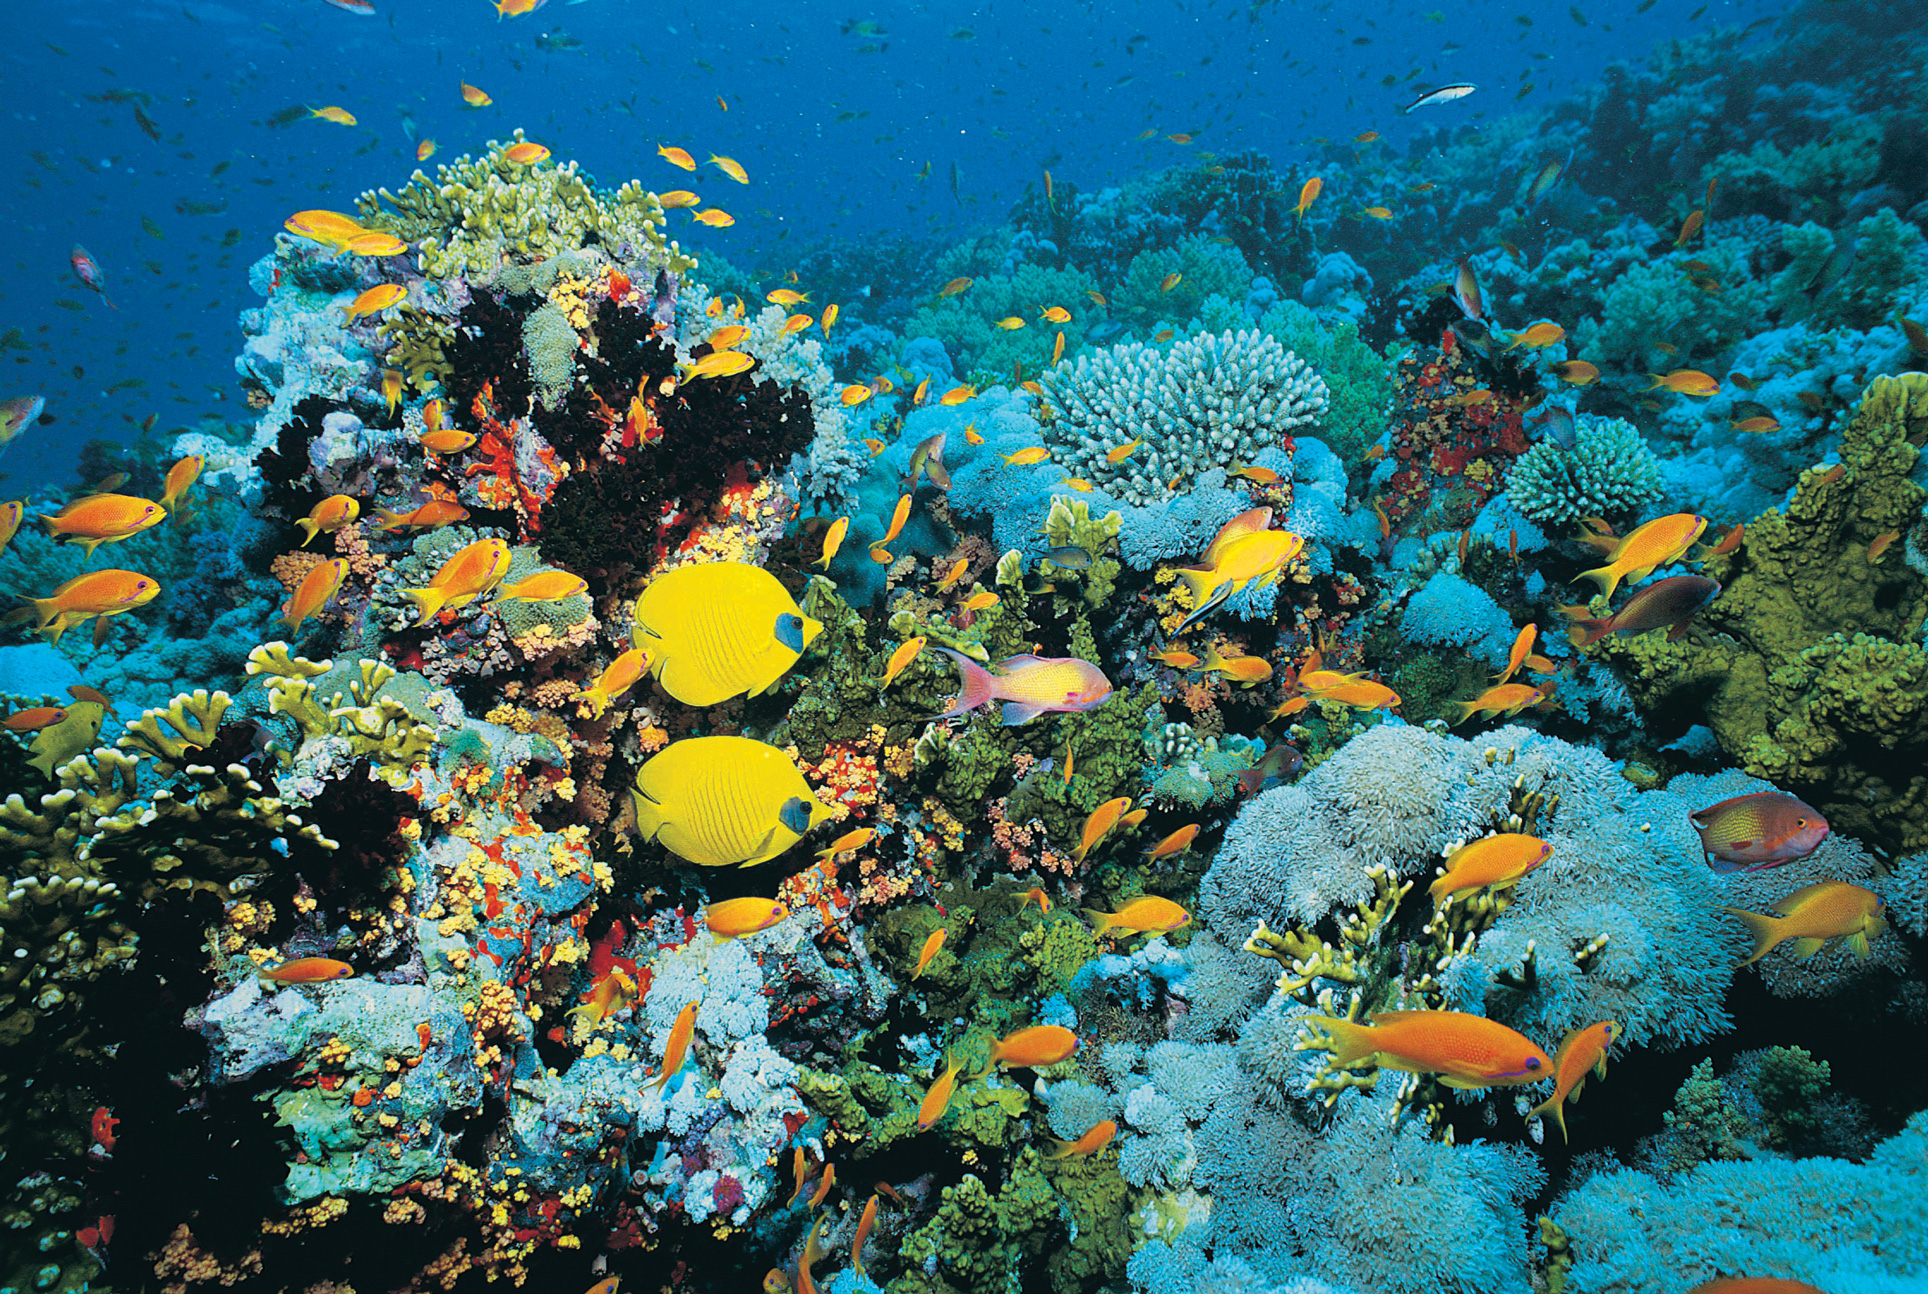
© Thinkstock
Healthy ecosystems are important to human society as they provide life-sustaining goods and services, including clean air to breathe, clean water to drink, plants and animals as food sources, and raw materials for clothing and shelter. The goods and services produced by natural systems that benefit humans are called ecosystem servicesThe suite of goods and services provided by natural systems that are vital to human livelihood.. These goods and services lack a formal market and are not included in traditional economic measures like GDP. They are often viewed as “public goods” or societal benefits.
Environmental changes can impact the life that an ecosystem can sustain. Severe or rapid changes can reduce the carrying capacity of an ecosystem and result in the loss of living organisms. Severe and permanent loss of animal species is called extinctionPermanent loss of a plant or animal species.. In the history of Earth there have been five major mass extinction events—meaning large number of species have died off dramatically: Ordovician (450 million years ago), Devonian (375 million years ago), Permian (251 million years ago), Triassic (205 million years ago), and Cretaceous (66 million years ago). The worst mass extinction is believed to be the Triassic extinction when over 90 percent of species on Earth died off. Evidence suggests that it can take millions of years for new species to recover after a mass extinction event.
In addition to these more well-defined mass extinction periods, there are many other extinction events that have occurred over the course of Earth’s history. Causes of past mass extinction have included dramatic changes in climate (warming or cooling), atmospheric changes, dramatic changes in sea level, changes in oxygen levels in the sea, and changes in land structure.
Currently, the Holocene extinctionWidespread extinction of animal species in the last ten thousand years due to human activities. is occurring. This is a widespread extinction that has been ongoing for approximately the last ten thousand years. It is estimated that currently up to 140,000 species are lost every year. The Holocene extinction is characterized by human-driven activities, including habitat loss, overpredation,Hunting of a species to an extent that it drives down its population putting it in danger of extinction. and, most recently, human-induced climate change. During the last century the rate of decrease in biodiversity has been increasing.“Biodiversity Loss Accelerating, UN Target Will Be Missed,” Environmental News Service, October 13, 2009, http://www.ens-newswire.com/ens/oct2009/2009-10-13-01.html.
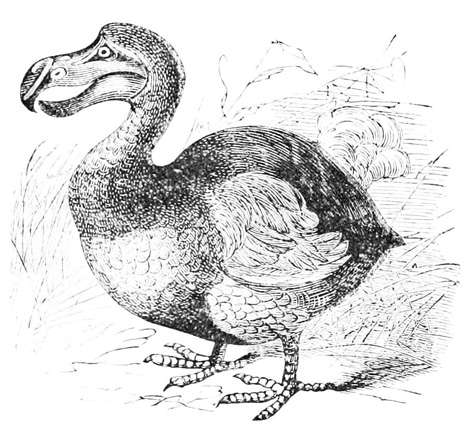
Ross MacPhee and Clare Flemming of the department of mammalogy at the American Museum of Natural History researched mammal extinctions since 1500 AD. They identified ninety species of mammals that have become extinct during the modern era of European expansion. This is 2 percent of all mammal species on Earth. The natural rate of mammal species extinction is estimated to be one mammal species every 400 years, the loss of 90 species in 500 years is a 7,100 percent increase over the natural rate.Ross D. E. MacPhee and Clare Flemming, “Brown-Eyed, Milk-Giving…and Extinct: Losing Mammals Since A.D. 1500,” Natural History, April 1997. Example of animal species that have become extinct due to human activity include the dodo bird, Falkland Islands wolf, Atlas bear, eastern cougar, passenger pigeon, and the western black rhinoceros.
Earth’s Resources
A basic understanding of the key resources that support the earth is essential for businesses that are concerned with sustainability. These resources support a healthy planet with rich and diverse plant and animal life. Sustainable businesses consider the impacts of their actions on these key resources.
Energy
The earth system has three primary sources that affect the flow of energy on Earth. They are solar, geothermal, and tidal. The sun (solar) is a powerful source of energy on Earth and life on Earth could not exist without it. Geothermal is the energy from within the earth and includes volcanoes and earthquakes. Tidal movement of the oceans is caused by the orbiting of the moon around the earth.
EnergyThe ability to do work. It flows from many different sources and is used by man to power modern society. is defined as the ability to do work. Work is defined as the application of a force over a distance. Energy can be divided into two broad categories: potential and kinetic. Potential energy is stored energy that has the potential to do work, such as the energy stored in a battery or fuel, while kinetic energy is energy in motion, such as waves crashing against a beach. Energy can be transferred from one form to another. Within the broad categories of potential and kinetic energy, energy can come in many different forms, including chemical, nuclear, mechanical, thermal, electrical, solar, and others.
The earth’s resources, which man uses to power modern society, are classified as either renewable or nonrenewable. Renewable energyEnergy produced by natural resources that are replaced relatively quickly. Renewable energy resources include biomass, hydro, geothermal, solar, wind, ocean thermal, wave action, and tidal action. In 2009, approximately 8 percent of all energy consumed in the United States was from renewable resources. refers to energy, including electricity, generated from sources that will not be depleted if used in a sustainable manner. Although the specific technologies that are considered renewable vary, they are generally considered to include solar, wind, geothermal, biomass, and hydro.
Table 2.1 Types of Renewable Energy
| Technology | Image | Description |
|---|---|---|
| Solar | http://en.wikipedia.org/wiki/File:Giant_photovoltaic_array.jpg | Electricity or thermal energy generated from the energy of the sun. |
| Wind | http://en.wikipedia.org/wiki/File:GreenMountainWindFarm_Fluvanna_2004.jpg | Energy generated from wind turning the blades of a wind turbine. |
| Geothermal | http://en.wikipedia.org/wiki/File:NesjavellirPowerPlant_edit2.jpg | Energy generated from thermal energy stored within the earth. |
| Biomass | http://commons.wikimedia.org/wiki/File:Biomass-fired_power_plant_(Guarda_Veneta).jpg | Energy generated from the combustion of biological sources, such as wood, landfill gas, or biomass fuels (e.g., ethanol). |
| Hydroelectric | http://en.wikipedia.org/wiki/File:ThreeGorgesDam-China2009.jpg | Energy generated from the gravitational force of water flowing. This is the most prevalent form of renewable energy in the world. |
Renewable energy resources provide an alternative to more prevalent means of electrical power generation, including coal, nuclear, natural gas, and oil. These sources of energy are nonrenewable and will be depleted at some point in the future.
Nuclear Energy Promise and Problems
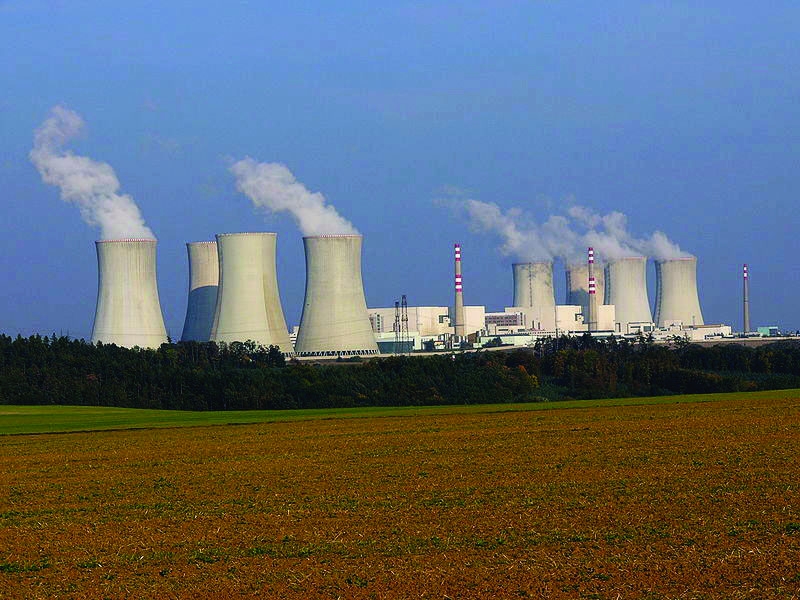
Source: Wikimedia, http://commons.wikimedia.org/wiki/File:Nuclear.power.plant.Dukovany.jpg.
Nuclear energy is an energy source that has tremendous potential for increased global power generation as its fuel source is not fossil fuel based and does not involve combustion. This serves to provide a hedge against volatile fossil fuel prices and has the benefit of no air pollution emissions from power generation (including greenhouse gas emissions). It also is a technology that is capable of generating large amounts of energy. This has led some to claim that nuclear power is a viable clean energy technology for the future. However, this power source is not without issues.
Nuclear power involves hazardous, radioactive materials that can cause cancer and death with exposure. A history of infrequent, but damaging, power plant accidents has historically hampered investment in this technology in the United States. A nuclear meltdown occurred in 1979 at the Three Mile Island power plant in Pennsylvania, which resulted in the release of radioactive gases. In 1986, an explosion at the Chernobyl Nuclear Power Plant in Ukraine released large quantities of nuclear contamination into the atmosphere. And most recently, in 2011, a tidal wave damaged the Fukushima I Nuclear Power Plant resulting in the full meltdown of three nuclear reactors. All of these accidents have come with high economic costs for the damage and subsequent environmental remediation.
An example of how energy is transformed from one form to another can be seen in the operation of a car. It takes work to move a car down a road. The chemical potential energy stored in gasoline is transferred into thermal energy when the gasoline combusts in the car’s engine. The thermal energy released in the engine moves pistons in the engine transforming the thermal energy into mechanical energy. Through gears and other mechanical parts on the cars, the mechanical energy in the engine is transferred through the car resulting in the rotation of the tires, which move the car. The potential energy stored in the fuel is transformed into kinetic energy of the moving car.
A common measurement unit of energy is the British thermal unit (BTU)A commonly used measurement of energy. It is the amount of heat energy required to raise one pound of water by one degree Fahrenheit.. A BTU is the amount of heat energy required to increase the temperature of a pound of water by one degree Fahrenheit. A BTU is approximately equal to the amount of heat given off by burning a kitchen match. As a BTU is a relatively small unit, BTUs are often stated in larger units, therms or MMBTU. Therms or thermal units are equal to one hundred thousand BTUs. MMBTU is equal to one million BTUs. To help provide some context, a typical residential water heater has a heat output rating of about forty thousand BTU per hour. The average commercial boiler in the United States has an output ability of 9.6 MMBTU per hour.“Characterization of the U.S. Industrial Commercial Boiler Population,” Oak Ridge National Laboratory, http://www.cibo.org/pubs/industrialboilerpopulationanalysis.pdf.
In terms of electricity, the common unit of energy is the kilowatt hour or kWh. However, as the kilowatt hour is a unit of energy, electricity usage can also be expressed in terms of BTUs, with 1 kWh equal to 3412 BTUs. The units for energy used vary by country. For example, in the United States, engine power is related in terms of horsepower (HP) while in other countries it is rated in terms of kilowatts (kW). The 2012 Honda Civic’s engine is advertised as 140 HP in the United States and 103 kW in European countries. Both measures indicate the same amount of power.
Biodiversity
Biodiversity is the result of 3.5 billion years of evolution. BiodiversityThe amount of variation of life within an ecosystem. is an indicator of the health of an ecosystem. Higher degrees of biodiversity imply greater ecosystem health. Biodiversity not only strengthens the overall health of the planet but also provides vital benefits to humans. Biodiversity is important in agriculture as it provides different varieties of plants and animals for human consumption. Biodiversity helps protect other natural resources, including water and soil. A significant portion of medicine is derived directly or indirectly from organic sources. Industry relies on biological inputs, such as timber, paper, and fiber. Biodiversity also provides leisure, cultural, and aesthetic value.
Sidebar
Why Is Biodiversity Important?
“At least 40 percent of the world’s economy and 80 percent of the needs of the poor are derived from biological resources. In addition, the richer the diversity of life, the greater the opportunity for medical discoveries, economic development, and adaptive responses to such new challenges as climate change.”“The DAC Guidelines: Integrating the Rio Conventions into Development Co-Operation,” OECD, Annex 2, 2002.
Source: Convention on Biological Diversity.
Goods and Services Provided by Ecosystems with High Biodiversity
- Food, fuel, and fiber
- Shelter and building materials
- Purification of air and water
- Detoxification and decomposition of wastes
- Stabilization and moderation of the earth’s climate
- Moderation of floods, droughts, temperature extremes, and the forces of wind
- Generation and renewal of soil fertility, including nutrient cycling
- Pollination of plants, including many crops
- Control of pests and diseases
- Maintenance of genetic resources as key inputs to crop varieties and livestock breeds, medicines, and other products
- Cultural and aesthetic benefits
Plant and animal species have been disappearing at a rate at least fifty times greater than the natural rate, and this rate is predicted to rise as human activities continue to put demands on ecosystems. Based on current trends, an estimated 34,000 plant and 5,200 animal species face extinction. Agriculture biodiversity is under extreme pressure due to modern commercial agriculture, which has focused on a few specific species of plant and many farm animal breeds are at risk of extinction.“Sustaining Life on Earth,” Convention on Biological Diversity, http://www.cbd.int/convention/guide/?id=changing.
While the loss of individual species is of great concern, of even greater concern is the continued degradation and loss of some of the world’s richest ecosystems, including forests, wetlands, and coral reefs. These ecosystems are host to some of the greatest biodiversity on Earth and the loss of these ecosystems is the greatest threat to biodiversity.
The loss of biodiversity reduces the productivity of ecosystems. It weakens ecosystems and reduces their ability to be resilient to extreme natural events, such as floods, droughts, and human activity stresses. While the loss of species has always occurred as a natural phenomenon, the pace of extinction has accelerated dramatically as a result of human activity. This loss of life not only reduces the ecosystems goods and services available to the current generation of humans but also harms future generations as well.
Water
Water covers more than 70 percent of the earth’s surface and is vital to all forms of life. Oceans hold 97 percent of surface waters, glaciers and the ice caps hold 2.4 percent, with lakes, rivers, and other land surface waters making up the remaining 0.6 percent. Water is a vital resource to humans as it is required as drinking water; it is an essential input for agriculture; and it provides for sanitation, transportation, energy generation, food processing, and power generation (through hydroelectric plants or dams). Increases in population and current water use practices are expected to increase water consumption in food production by up to 90 percent.“Agriculture at a Cross Roads: International Assessment of Agricultural Science and Technology for Development Global Report,” UNEP, http://www.agassessment.org/reports/IAASTD/EN/Agriculture%20at%20a%20Crossroads_Global%20Report%20(English).pdf.
Figure 2.3 Water Scarcity Map
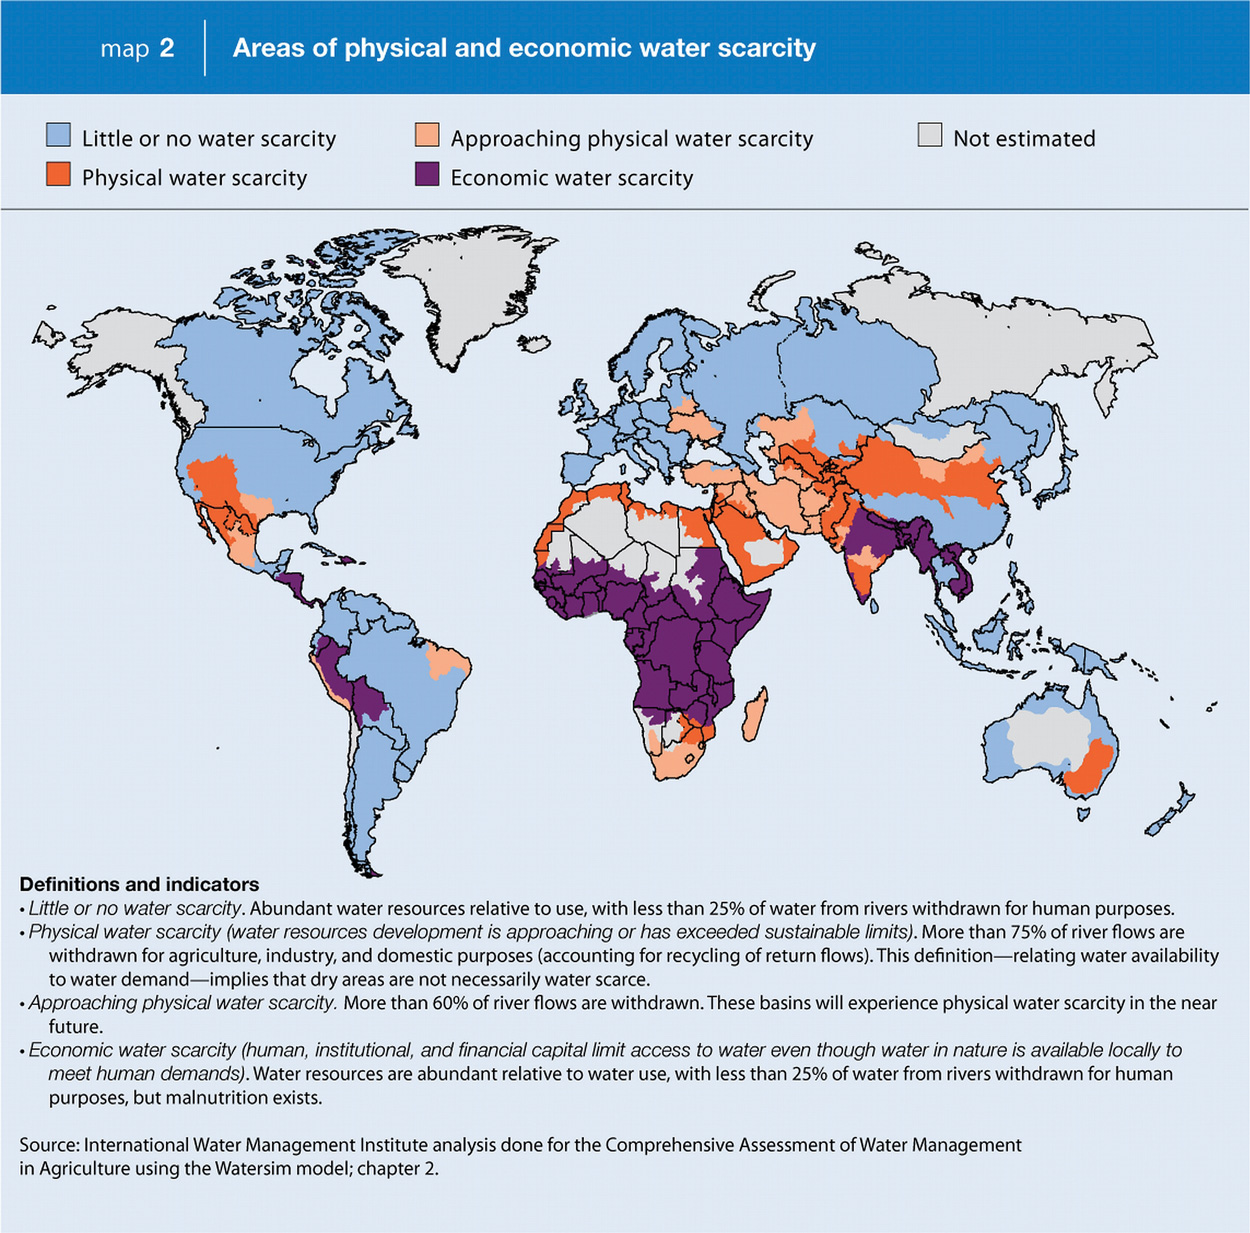
Source: “Areas of Physical and Economic Water Scarcity,” UNEP, http://www.grida.no/graphicslib/detail/areas-of-physical-and-economic-water-scarcity_1570.
Currently, one in six people in the world lack safe drinking water, and water-related illness is the leading cause of human sickness and death. In 1989, there were 9,000 cubic meters of freshwater per capita available for human use. By 2000, this had dropped to 7,800 cubic meters, and it is expected to continue to decrease as human population increases.United Nations Educational, Scientific, and Cultural Organization (UNESCO), “The Makings of a Water Crisis: Can Supply Keep Up with Demand?” UNESCO Sources, no. 84 (1996): 12–13. Global per capita figures on water availability are somewhat misleading as the world’s available freshwater supply is not distributed evenly geographically, seasonally, or annually. Water distribution is dependent on Earth’s hydrological cycle. The movement of water is part of a natural cycle of evaporation into the atmosphere, precipitation, and then runoff across the land and into streams, rivers, and lakes. This cycle is powered by the sun, which serves to move clean water about the planet.
Figure 2.4 The Water Cyclehttp://ga.water.usgs.gov/edu/watercycle.html.
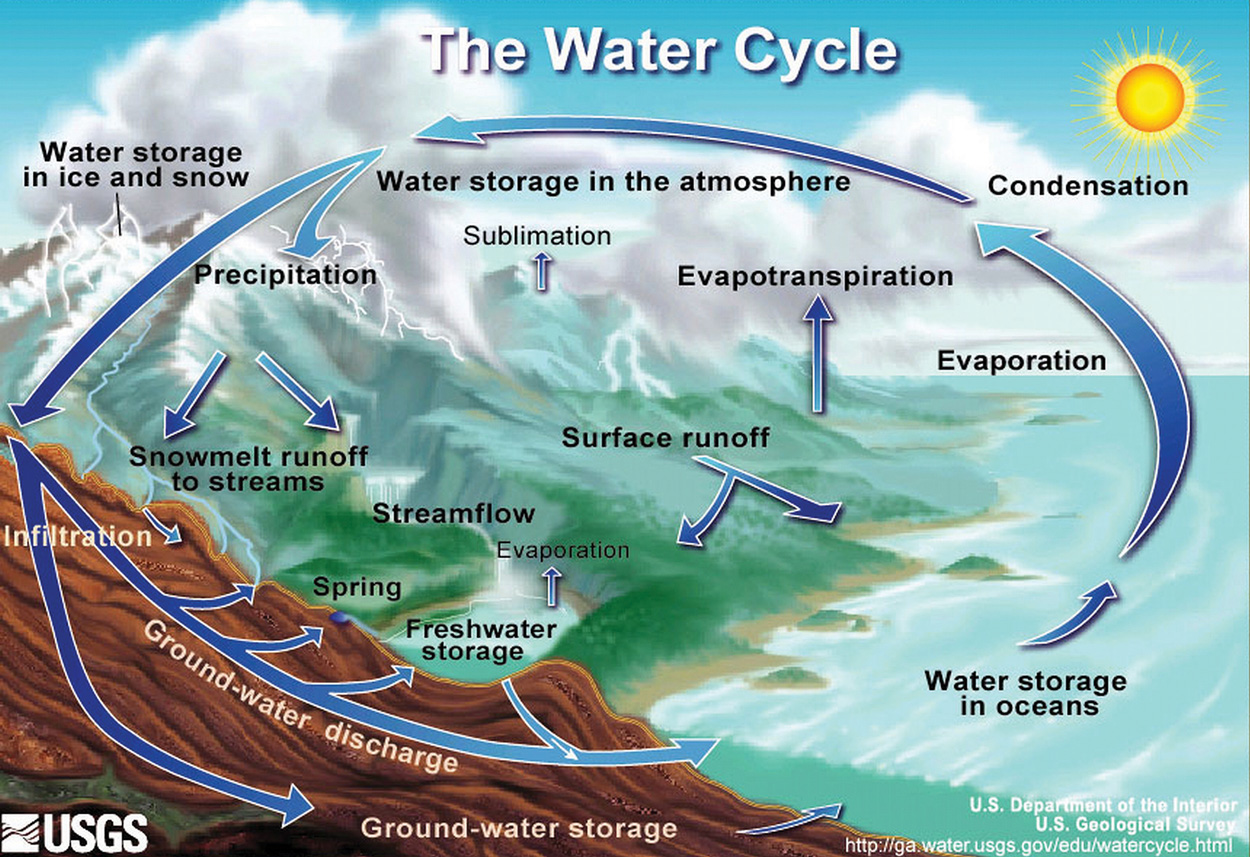
Source: The Water Cycle, US Geological Service.
Soil
Soil consists of layers of minerals that vary in characteristics across different geographic regions and ecosystems. Soil consists of both organic and inorganic components. Soil is a primary nutrient base for plants and therefore is important to humans for agriculture. Without soil, the earth would not support a rich base of plant and animal life, and it is an essential resource to consider in human interactions with the environment.
Key Takeaways
- Sustainable businesses must have a basic understanding of key resources on Earth and the impact their business activities have on these resources.
- In the earth system, there are many critical resources to consider, including energy, biodiversity, water, and soil.
Exercises
- Find an article from a business publication or website that talks about how a business considered its impact on a natural resource and included its impact on that resource as well as profitability in the action it took on a specific business operation. Describe the operation, the resource involved, and the environmental and economic outcome of the transaction. If you were CEO of that company, would you have made the same decision?
- Go to the United Nations Environment Programme’s website, and read the report “21 Issues for the 21st Century.” The report is available at http://www.unep.org/publications/ebooks/foresightreport/Portals/24175/pdfs/Foresight_Report-21_Issues_for_the_21st_Century.pdf. Identify an issue highlighted in the report and discuss a potential business idea that could address that issue. Discuss how the company could generate profits while at the same time addressing a contemporary sustainability issue.
2.3 Human Activity Impacts on Ecosystems
Learning Objectives
- Identify five threats to ecosystems from human activities.
- Understand what factors affect climate change and what the current trajectory and implications of climate change are for the next century.
- Discuss the role of population, affluence, and technology in driving human impacts.
Business and human activities can be direct threats to ecosystems. They can cause destruction, degradation, and the impairment of biodiversity and other natural resources. Ecosystem threats include (1) climate changeChanges in the climate system outside of historical norms. In the last 150 years, it refers to the deviation from historical climate patterns as a result of human activity., (2) pollutionContamination of the environment with harmful sources typically from man-made sources but can also occur from naturally occurring sources., (3) habitat destructionHuman activity that damages ecosystems., (4) overexploitationThe taking of a natural renewable resource (typically a biological species but can also apply to nonliving renewable resources) at a greater rate than it can replenish and sustain itself. This diminishes and can destroy the resource., and (5) introduction of invasive speciesThe accidental or intentional introduction of a species to a new ecosystem that results in damage to the ecosystem when the introduced species outcompetes or attacks indigenous species.. Business and human activities can stress the ecosystem they operate in reducing its overall health and at some point the accumulation of all negative impact from human activities can exceed the ecological thresholdA tipping point where the stresses on an ecosystem exceed its capacity to absorb them and feature a major loss of biodiversity and natural resource health and quality. of the planet. Driving these human activities are population, affluence, and technology.
Climate Change
Climate change is one of the greatest threats to sustainability. It is a controversial and contested topic. As highlighted in the previous section, the earth’s climateLong-term temperature, humidity, wind, and rainfall of a region of Earth, and it is impacted by its latitude, geography, and proximity to water. Climate differs from weather, in that weather consists of the same factors observed over a very short period of time. does fluctuate over time due to a variety of factors. However, there is a significant body of scientific research that indicates that global temperatures are rising and that rising global temperatures are directly linked to human activities involving the emissions of greenhouse gases (GHG).“IPCC Fourth Assessment Report, Working Group III, Mitigation of Climate Change,” IPCC, http://www.ipcc.ch. GHG traps heat in the atmosphere allowing the planet to be a habitable place. The primary GHG of interest is carbon dioxide (CO2), which is a vital gas in our earth system and is released from various sources, including the combustion of fossil fuels. Over the last two centuries, rapid industrialization and the corresponding increased burning of fossil fuels and deforestation of large tracts of land globally has caused the concentrations of greenhouse gases to increase significantly in our atmosphere. Current atmospheric carbon dioxide levels exceed the natural range observed over at least the last 800,000 years and are rapidly rising.
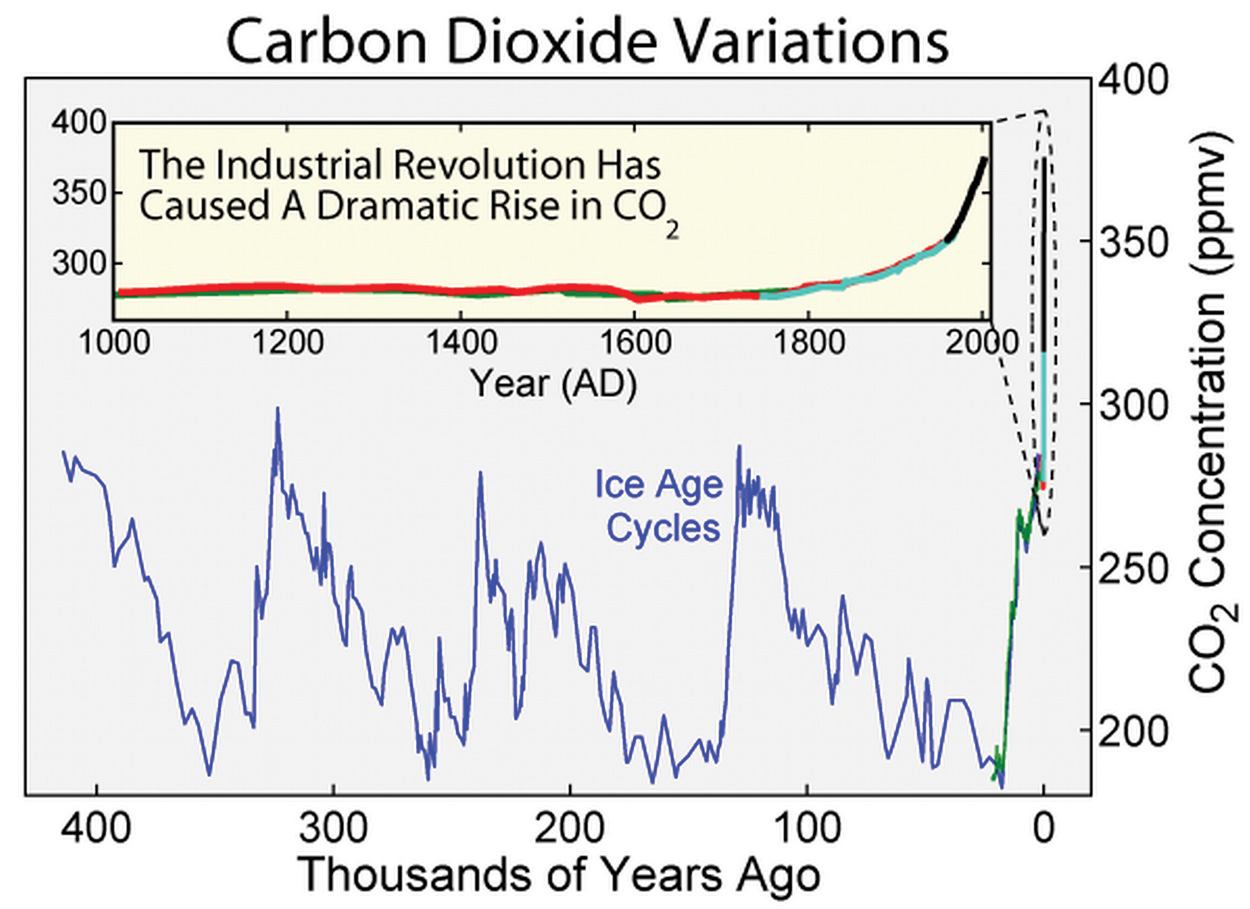
Source: Robert A. Rohde, http://en.wikipedia.org/wiki/File:Carbon_Dioxide_400kyr.png.
In January 2012, global carbon dioxide levels reached a high of 393 parts per million (ppm) at the Mauna Loa Observatory in Hawaii. This was up from 391 ppm from January 2011 and continues a long-term trend of rising levels of carbon dioxide in the atmosphere."Trends in Atmospheric Carbon Dioxide,” National Oceanic & Atmospheric Administration, http://www.esrl.noaa.gov/gmd/ccgg/trends. The Mauna Loa Observatory has been performing continuous monitoring of atmospheric carbon dioxide since 1956.
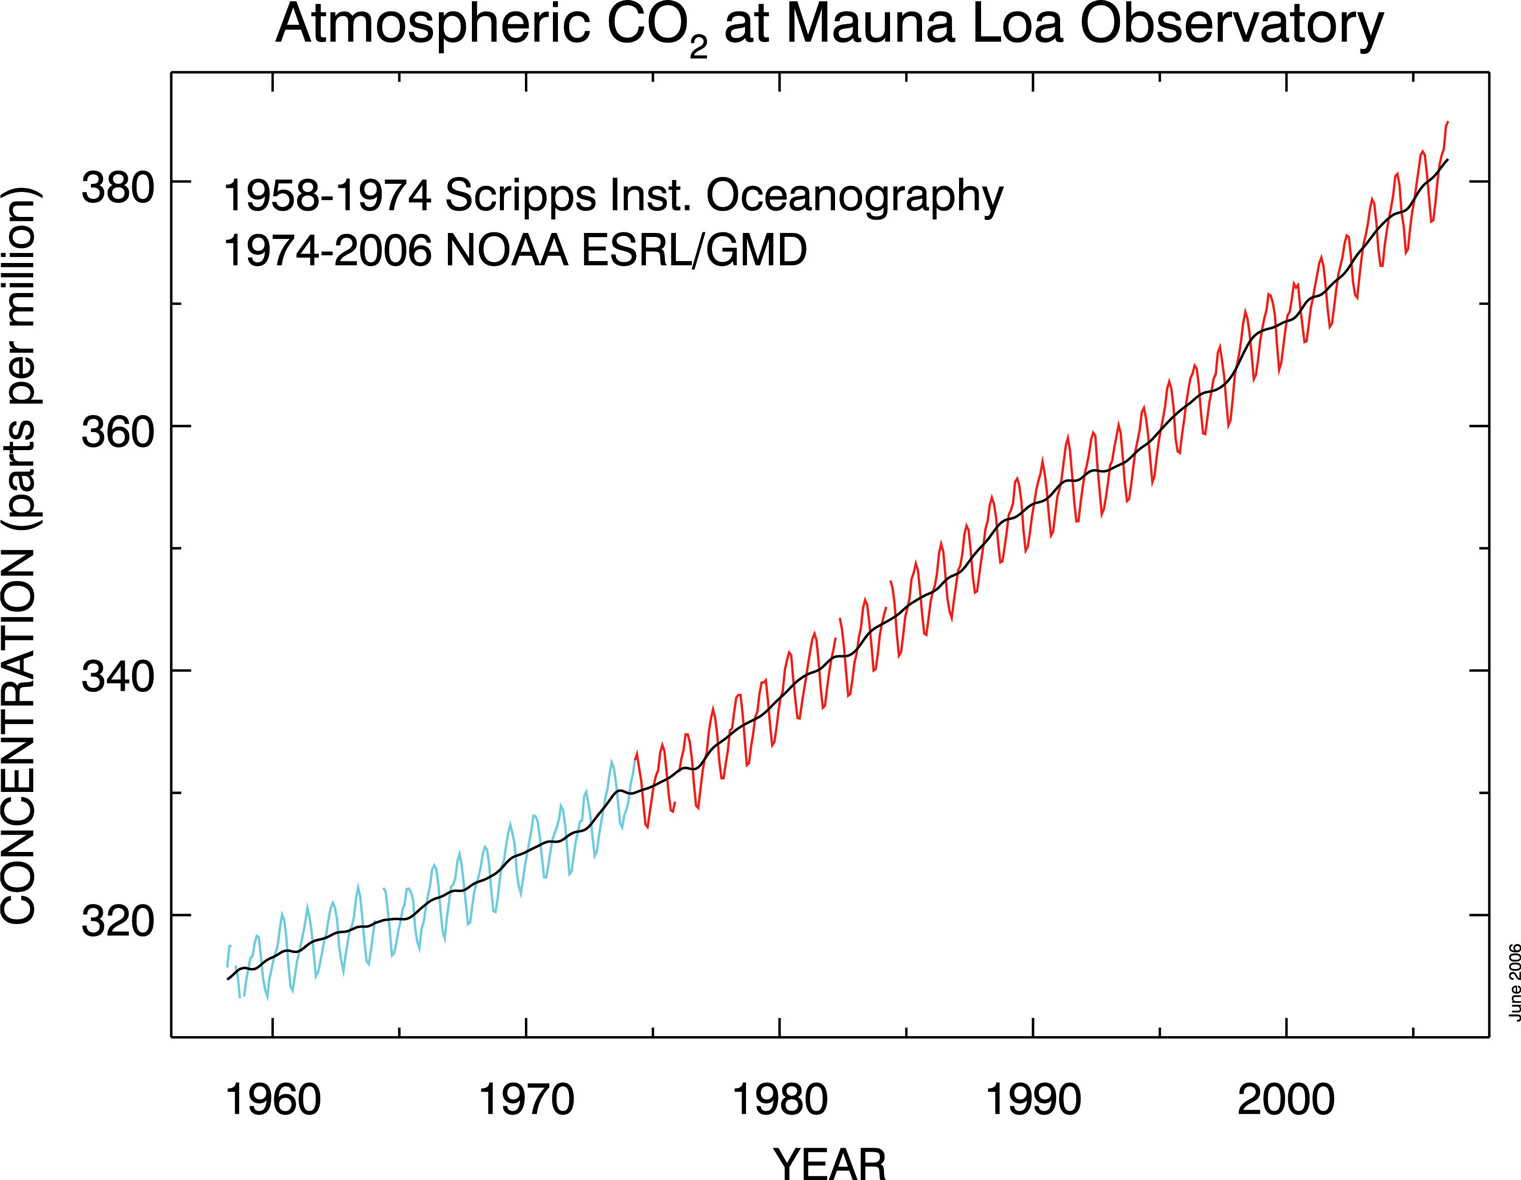
Source: Wikipedia, http://en.wikipedia.org/wiki/File:CO2_data_mlo.svg.
Some greenhouse gases, such as carbon dioxide, occur naturally and are emitted to the atmosphere through natural processes and human activities. Other greenhouse gases (e.g., fluorinated gases) are created and emitted solely through human activities. Not all greenhouse gases have the same impact. Global warming potential (GWP) is a relative measure of how much heat a greenhouse gas traps in the atmosphere. GWP is standardized to carbon dioxide, which has a GWP of one.
The principal greenhouse gases that enter the atmosphere because of human activities—also called anthropogenic—are as follows:
- Carbon dioxide (CO2; 72 percent of anthropogenic emissions; GWP of one)—emitted through the burning of fossil fuels (oil, natural gas, and coal), solid waste, trees and wood products, and chemical processes.
- Methane (CH4; 18 percent of anthropogenic emissions; GWP of twenty-five)—emitted during the production of coal, natural gas, and oil; from livestock and other agricultural practices; and by the rotting of organic waste in municipal solid waste landfills.
- Nitrous oxide (NxO; 9 percent of anthropogenic emissions; GWP of 298)—emitted during agricultural and industrial activities as well as during combustion of fossil fuels and solid waste.
- Fluorinated gases (< 1 percent of anthropogenic emissions; HFC-23 has a GWP of 14,800)—emitted from a variety of industrial processes and sometimes used as substitutes for ozone-depleting substances (i.e., CFCs, HCFCs, and halons). Although fluorinated gases are typically emitted in smaller quantities, they are potent greenhouse gases sometimes referred to as high global warming potential gases (“high GWP gases”).
Average global temperatures have increased 1.3 degrees Fahrenheit since 1850, with the trend in warming in the last fifty years being almost double that of the prior one hundred years. The twentieth century’s last two decades were the warmest in four hundred years. Current projections have global temperature further increasing by a significant two degrees to twelve degrees Fahrenheit by 2100.“IPCC Fourth Assessment Report, Working Group III, Mitigation of Climate Change,” IPCC, http://www.ipcc.ch. Temperature increases of this magnitude will adversely affect the planet through rising sea levels, shrinking glaciers, changing of the range and distribution of plants and animals, lengthening of growing seasons, changing of weather patterns, and human health effects. People are affected by climate change through extreme periods of heat and cold, storms, climate sensitive diseases, prolonged and increased levels of smog, and economics (e.g., volatility in retail prices; resource scarcity; and changing work patterns, conditions, and incomes).“Climate Change—Health and Environmental Effects,” US Environmental Protection Agency, http://www.epa.gov/climatechange/effects/index.html#ref.
Changes in global temperature are impacting the global climate in significant ways, including the following:
- Mountain glaciers and snow cover have declined significantly, contributing to rises in sea level. For example, Montana’s Glacier National Park now has only 27 glaciers, versus 150 in 1910. In the Northern Hemisphere, thaws also come a week earlier in spring and freezes begin a week later.
- Sea levels will rise dramatically. Thermal expansion has already raised the oceans four to eight inches (ten to twenty centimeters). There is a possibility for a three-foot sea rise by the end of the century, which would flood many cities along the US seaboard.“Warming to Cause Catastrophic Rise in Sea Level,” National Geographic, April 26, 2004, http://news.nationalgeographic.com/news/2004/04/0420_040420_earthday.html.
- Average Arctic temperatures have increased at almost twice the global rate in the past one hundred years. Arctic ice is rapidly disappearing, and the region may have its first completely ice-free summer by 2040 or earlier. Polar bears and indigenous cultures are already suffering from the sea’s ice loss.
- Increased precipitation has been observed in the eastern parts of North and South America, northern Europe, and northern and central Asia.
- An upsurge in the amount of extreme weather events, such as wildfires, heat waves, and strong tropical storms, is also attributed in part to climate change by some experts. Examples of these types of extreme events are already occurring with greater frequency, including recent flooding in Nashville and extreme droughts in Russia.
- Coral reefs, which are highly sensitive to small changes in water temperature, suffered the worst bleaching—or die-off in response to stress—ever recorded in 1998, with some areas seeing bleach rates of 70 percent. Experts expect these sorts of events to increase in frequency and intensity in the next fifty years as sea temperatures rise. Coral systems are rich ecosystems providing breeding grounds for sea life and are major recreational draws. The loss of these vital resources has a devastating economic impact on local economies.
Current science suggests that to significantly reduce the threats of global climate change, worldwide reductions of carbon dioxide emissions by 80 percent below current levels will be required by 2050.“World Needs to Axe Greenhouse Gases by 80 pct: Report,” Reuters, April 19, 2007, http://www.reuters.com/article/2007/04/19/us-globalwarming-idUSL194440620070419.
Figure 2.5 Historic and Projected Global Temperatureshttp://www.grida.no/publications/other/ipcc_tar/?src=/climate/ipcc_tar/vol4/english/figspm-10b.htm.
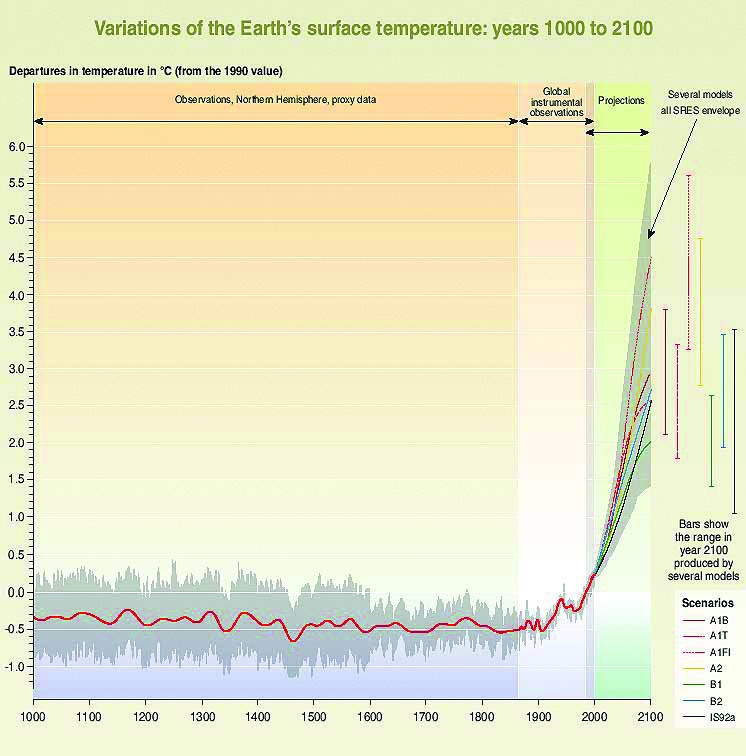
Source: Intergovernmental Panel on Climate Change (IPCC).
Table 2.2 Global Emissions of CO2 (2009)
| Rank | Country | Emissions (Millions of Metric Tons) | Global Total (%) |
|---|---|---|---|
| 1 | People’s Rep. of China | 6,831.6 | 22 |
| 2 | United States | 5,195.0 | 16 |
| 3 | European Union—27 | 3,576.8 | 11 |
| 4 | India | 1,585.8 | 5 |
| 5 | Russian Federation | 1,532.6 | 5 |
| 6 | Japan | 1,092.9 | 3 |
| 7 | Germany | 750.2 | 2 |
| 8 | Islamic Rep. of Iran | 533.2 | 2 |
| 9 | Canada | 520.7 | 2 |
| 10 | Korea | 515.5 | 2 |
| 131 Remaining Countries | 9,426.2 | 30 | |
| Total | 31,560.5 | 100 |
Source: “CO2 Emissions from Fuel Combustion—Highlights,” International Energy Agency, http://www.iea.org/co2highlights.
In 2008, global carbon dioxide emissions were 4.8 metric tons per capita. The highest per capita emission was Qatar with 49 metric tons per capita caused by their high emitting gas production sector and their small populations. The United States was the tenth highest per capita emitter of carbon dioxide emissions at 17.9 metric tons per capita. Even though China had the highest absolute level of emissions, it was ranked seventy-ninth at 5.3 metric tons of CO2 per capita. “CO2 Emissions (Metric Tons per Capita),” World Bank, http://data.worldbank.org/indicator/EN.ATM.CO2E.PC/countries/1W?display=default. Per capita emissions are on average higher in developed economies than emerging economies. Countries that were members of the Organisation for Economic Co-operation and Development (OECD) had average emissions of 10.5 metric tons per capita while countries that were classified by the United Nations as the least developed countries had per capita missions of 0.24 metric tons per capita.
It is important to note that there are those that deny the significance of climate change on the human condition and the impact of human and business activity on climate change. Climate change denial dismisses the scientific consensus on the extent of global warming, its significance, and its connection to human behavior. As will be highlighted in the next chapter, climate change denial has been mostly associated with the energy lobby and free market think tanks, often in the United States.
A 2010 paper in the Proceedings of the National Academy of Sciences of the United States (PNAS) reviewed publication and citation data for 1,372 climate researchers and drew the following two conclusions:William R. L. Anderegg, James W. Prall, Jacob Harold, and Stephen H. Schneider, “Expert Credibility in Climate Change,” Proceedings of the National Academy of Sciences of the United States of America, April 9, 2010, http://www.pnas.org/content/early/2010/06/04/1003187107.full.pdf+html.
- Of the climate researchers most actively publishing in the field, 97 percent to 98 percent support the tenets of ACC (Anthropogenic Climate Change) outlined by the Intergovernmental Panel on Climate Change.
- The relative climate expertise and scientific prominence of the researchers unconvinced of ACC are substantially below that of the convinced researchers.
Pollution
Pollution is the contamination, harm, or disruption of the natural environment through the emissions of harmful substances. Pollution is most typically associated with anthropogenicA scientific term frequently used in discussing climate change and pollution; it means coming from human sources. sources but can also occur from natural activity, such as volcanic eruptions. Pollution can impact air, water, and land. Pollutants include domestic, industrial, and agricultural waste. It comes in many different forms and can be chemical substances or noise, heat, or light.
Pollution can be either point sourcePollution that is emitted from an easily identifiable source, such as a power plant. or nonpoint sourcePollution in aggregate from many small, difficult to individually identify sources.. Point source is a specific and easily identifiable source of pollution, such as a factory or power plant. Nonpoint sources consist of many small, distributed sources of a pollutant that are difficult to individually identify and on their own may not be that harmful but in aggregate are significant sources of pollution. A classic example of nonpoint source would be soap detergents, fertilizers, and other commonly used chemicals and products from many residences and businesses that then contaminate watershedsAn area of land where all water drains into the same water system. with high levels of nitrogen. Nonpoint sources tend to be more complex to regulate for pollution emissions.
Pollution is not just toxic substances; it can be pollutants that are actually part of a healthful ecosystem in the proper quantities, such as nitrogen or carbon dioxide, but that in excessive quantities alter the normal functioning of an ecosystem resulting in harm to the ecosystem. Pollution can range from highly dangerous radioactive materials to airborne dust (a substance that is typically benign) resulting from land erosion.
Air pollution, the contamination of the atmosphere by airborne pollutants, is most often related to combustion of fuel from either stationary or mobile sources. Stationary sources include the smoke stacks of factories, power plants, and furnaces or boilers. Mobile sources refer to motor vehicles, aircraft, and other forms of fossil-fuel-based transportation. Paints, chemicals, and aerosol sprays also can pollute the air. Natural sources of air pollution include dust, methane from livestock, volcanic activity, wildfires, and even vegetation.
Concerns over air pollution are not just a modern occurrence but date back many centuries. In 1272, King Edward I banned the burning of sea-coal in England after the smoke was having deleterious effects on the city of London. In fact, the punishment was pretty steep—death by hanging. And it was a punishment that was enforced. Nowadays, fines are a more typical punishment for any type of pollution.
In the United States, California has led the nation in regulating the emissions of air pollution, primarily because it was one of the first states in the nation to locally observe the detrimental impacts of air pollution. Los Angeles has been the focus point for air pollution in California with severe bouts of smog for at least the past one hundred years. The first “officially” recognized episode of smog occurred in Los Angeles during the summer of 1943. Visibility was reduced to three blocks and people suffered from stinging eyes, difficulty breathing, nausea, and vomiting.“The Southland’s War on Smog: Fifty Years of Progress toward Clean Air,” South Coast Air Quality Management District, http://www.aqmd.gov/news1/Archives/History/marchcov.html.
Figure 2.6 Photo Recording of Smog in Los Angeles
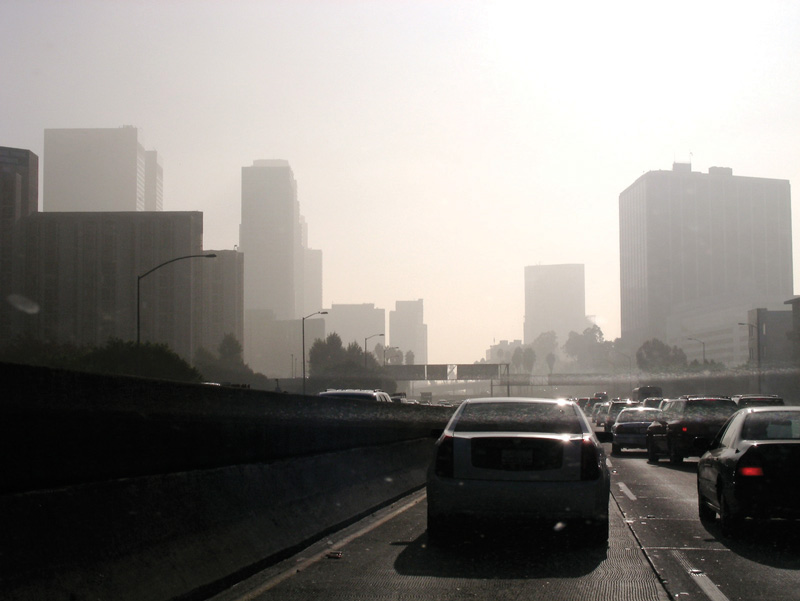
Source: Wikimedia, http://commons.wikimedia.org/wiki/File:Aab_Pasadena_Highway_Los_Angeles.jpg.
Growing concern over the harmful environmental impacts of industry motivated the US environmental movement in the 1960s and 1970s. The movement resulted in the passage of many major environmental laws that impact the business climate of the United States today. See the chapter on government, public policy, and sustainable business for a more detailed discussion.
Pollution continues to be a major focus globally. China, which has become increasingly industrialized, now finds that half of its water can no longer be used for human consumption and over a quarter is so toxic that it is unsafe even for industrial use.“Over Half of China’s Water Polluted Beyond Drinkability,” Natural News, http://www.naturalnews.com/030630_China_pollution.html.
Municipal Solid Waste
Municipal solid waste (MSW)A form of waste commonly called trash, garbage, or refuse. is a waste product that becomes a form of pollution if not properly managed. MSW is more commonly thought of as garbage, refuse, or trash. Solid waste is not necessarily toxic but includes discarded materials that need to be properly processed and disposed. Examples of solid waste include household trash, used tires, discarded appliances, furniture, paints, and construction and demolition debris.
In 2008, the United States generated 389.5 million tons of solid waste. Only 24 percent of the waste was recycledReclaiming a material that has outlived its useful life and remanufacturing the material into a new product., 6 percent was burned to produce energy, and the remaining 69 percent was landfilled.“State of Garbage,” BioCycle, October 2010. With 70 percent of waste being sent to landfills, there is still considerable opportunity for waste recovery for recycling or as an energy source.
Energy can be recovered from landfill sites through different forms, such as methane gas. Methane gas can be used to generate electricity or be burned as a heat source. However, the vast majority of waste is being disposed of, even though it contains resources (metals, plastics, and paper) that could be reused or recycled to reduce the demand on new resources. For example, cardboard that is recycled helps reduce the demand for trees to be cut down to make new cardboard.
The EPA encourages MSW to be managed through source reductionAlso known as waste prevention; taking steps to avoid generating waste in the first place., recycling, and compostingCollecting organic waste, such as food scraps, and using natural processes to break the material down into an important soil component.. Source reduction involves taking steps to reduce the waste material produced. This can include using materials more efficiently, reusing materials, or switching to substitutes that generate less waste. The average US recycling rate is 24 percent but has the potential to be considerably higher.“Wastes—Non-Hazardous Waste—Municipal Solid Waste,” US Environmental Protection Agency, http://www.epa.gov/epawaste/nonhaz/municipal/index.htm. There are opportunities for new sustainable businesses to better manage solid waste, including increasing the recycling rate and composting.
Ecomovement Consulting Composts Restaurant Leftovers
Portsmouth, New Hampshire, has one of the highest numbers of restaurants per capita in the country and these restaurants generate a large volume of food waste that is expensive to dispose of. Entrepreneurs Rian Bedard and partner Marcel Miranda saw this waste as an opportunity and formed Ecomovement Consulting and Hauling (http://zerowastenow.com/) in 2009. Bedard stated, “I started to find out that no one was offering zero-waste services and everyone wanted it.”
Customers pay for compostable bags and put the food waste in a recycling tote outside, which are then collected regularly by Ecomovement. The food waste is then brought to a local farm to be converted to compost, a high-value soil component sought after by gardeners and landscapers. In addition to restaurants, other large food waste generators have signed up with Ecomovement, including hospital cafeterias. In North America, only two cities can boast that all of their restaurants compost, but with an entrepreneurial company finding a niche missed by traditional waste management companies, Portsmouth is well on its way to becoming the third.“City Eateries Compost with Eco Movement,” Seacoast Online, http://www.seacoastonline.com/articles/20100614-NEWS-6140331.
Ecomovement Consulting can be followed on Facebook at http://www.facebook.com/pages/EcoMovement-Consulting-Hauling/172316763400.
Habitat Destruction
Habitat destruction brought on by the activity of humans threatens resident species and ecosystems. Two examples of habitat destruction are deforestation and desertification. Deforestation occurs when a forest or stand of trees is removed, converting the land to a nonforest use. This changes the ecosystem drastically and results in a dramatic loss of biodiversity. Deforestation can be the result of timber harvesting or of clearing land for agricultural, commercial, or residential use. The loss of biodiversity and trees alters the ecosystem and can result in aridity and erosion. It also results in climate change and extinction, and it can lead to desertification if on a significant enough scale. The social impacts can include displacement of indigenous peoples.
Desertification is the degradation of land quality and features low biodiversity, dry conditions, and poor soil quality. Deserts are formed through both natural processes and human activity. However, desertification is occurring at a greater rate than past geological time scales due to human activity. The concept of desertification became well known in the United States in the 1930s, when parts of the Great Plains in the United States turned into the “Dust Bowl” as a result of drought and poor agricultural practices.“Desertification,” US Geologic Services, http://pubs.usgs.gov/gip/deserts/desertification.
Overexploitation
Overexploitation is a major threat to ecosystems and therefore sustainability. It is the consumption of a natural resource at a rate greater than that natural resource can maintain itself. Overhunting of species (see “What Happened to All the Fish” as follows) is one of the clearest examples of overexploitation, but there are other forms. Land degradations are human-induced changes that impair the capacity of the land to sustain life. Deforestation and overgrazing exploit the land and result in the exceeding of sustainable yield.
What Happened to All the Fish?
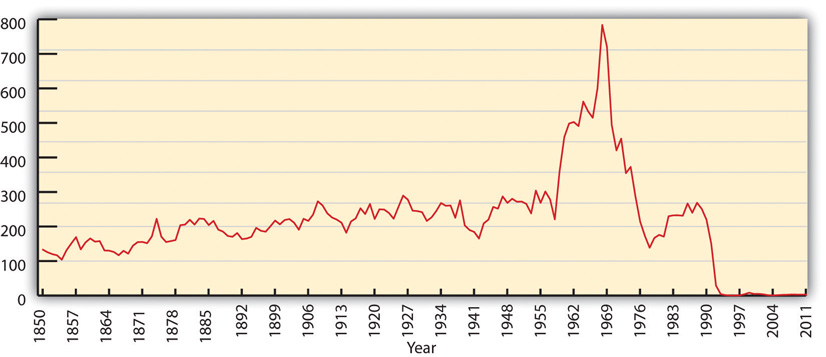
Grand Banks Annual Catch (Metric Tons)
Source: Annual Catch of Cod from 1850 to 2011, Myers et al., 1995; Northwest Atlantic Fisheries Organization.
The Grand Banks along the shores of Newfoundland, Canada, were once so full of cod that explorer John Cabot remarked in 1497 that they appeared so thick that a person “could walk across their backs,” and sailors reported to be able to catch them just by throwing buckets over the side of the ship. From 1850 to 1950, the fishing industry yielded an overall annual catch of about 200,000 tons of cod. With new technology in commercial fishing boats, catches of cod increased in the late 1950s and early 1960s, peaking at 800,000 tons in 1968. Commercial fishing was catching cod faster than their stock could replenish itself, and by 1975, the catch had declined to 300,000 tons. The catch continued at approximately this level through the 1990s but only through the use of more damaging fishing techniques. In 1992, the cod fishery off Newfoundland collapsed. It was estimated that the entire cod population in the Grand Banks at that time was only 1,700 tons. In response, Canada set an indefinite moratorium on fishing in the Grand Banks. This collapse devastated the local economy with the loss of forty thousand jobs in the fishing industry. In response, the federal government put up nearly a $1 billion to assist with social welfare payments and retraining of people employed in the fishery trade.
The case of the cod in Newfoundland illustrates how the unsustainable harvesting of a resource, when the yield reduces the overall base of that resource, is not only bad for the environment but also bad for industry and for the economy. Overfishing and habitat destruction damaged nature’s ability to provide fish in the Grand Banks. This resulted in a loss to a significant portion of the eastern Canadian economy and the members of the fishery communities experienced true hardship due to the overfishing. Prior to the overfishing that occurred during the second half of the twentieth century, the fish had supported seaside communities for hundreds of years.
Invasive Species
Invasive species are brought on by transporting species either intentionally or accidentally from other areas of the world. This can be devastating to existing species as invasive species are introduced on a timescale much more quickly than typically would happen with evolution over longer time periods. This can include outcompeting native species in the ecosystem, leading to the decline or extinction of local species, and overpopulation as these invasive species may not have any predators in this new ecosystem. They also can be a major economic cost.
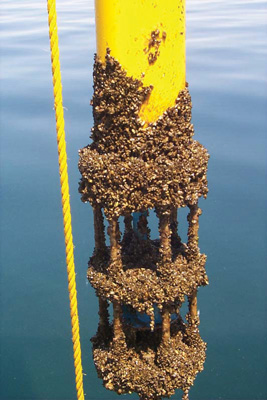
The zebra mussel provides an invasive species that has had significant economic impacts. The zebra mussel is native to lakes in Russia but was accidentally introduced in the United States and Canada through the ballast water of commercial ships that were transporting goods to the Great Lakes region in the 1980s. They have been spreading ever since and have recently been found in lakes in Massachusetts; they attach to recreational boats and are transported wherever the boat may go. They colonize rapidly and have covered the undersides of docks, boats, and other marine structures and can grow so thick that they block municipal water and hydroelectric pipelines. The cost of pest management for zebra mussels at power plants and other water-consuming facilities is approximately $500 million a year in the United States.Center for Invasive Species Research at the University of California, Riverside.
IPAT Relationship
Human population growth is a factor in human ecosystem impact. From 0 AD to the present, global population has increased from three hundred million to seven billion. While population growth was once considered to be one of the leading drivers of human impacts on ecosystems, it does not adequately explain all the impacts that come from human activities. One concept that is useful in understanding the multiple factors that interact to impact environmental quality is the IPAT equation. The equation was developed in the early 1970s by scientists John Holdren and Paul Ehrlich to explain the human factors that create environmental impact.
I = P x A x TImpact (I) was expressed as the product of population (P), affluence (A), and technology (T). This formula doesn’t quantify actual impacts, but is meant to state relationships. Also, P, A, and T are not independent variables but are interdependent. It does not show a simple multiplicative relationship among the main factors; research has shown that a doubling of population, for example, does not necessarily lead to a doubling of impact. Affluence is related to consumption where more affluent societies are able to consume more resources than less affluent societies can. Technology is a more complex factor as it can provide the means to extract greater quantities of resources but also can be used to limit consumption of resources.
The IPAT equation does not identify sustainable limits but does assist in increasing understanding of the general factors that increase or decrease environmental impact. By highlighting the interplay among a variety of factors in creating an impact, the IPAT equation demonstrates that there are multiple ways of reducing undesirable effects.
Key Takeaways
- There are five major ways that business activity can threaten ecosystems: climate change, pollution, habitat destruction, overexploitation, and introduction of invasive species.
- Climate change from human activity has already had an impact on the climate and is projected to cause significant harm to the earth system over the next century if not mitigated.
- Habitat destruction, overexploitation, and introduction of invasive species all negatively impact local ecosystems and should be considered in sustainable business activities.
- The IPAT relationship is defined as impact is the product of population, affluence, and technology.
Exercises
- Find articles that link businesses with each type of the ecosystem-threatening activities discussed in this chapter. Discuss how the business activity either contributed to the threat or helped mitigate the threat.
- In class, role play the following scenario: A mining company has discovered a large deposit of oil in a pristine area of South America that features high biodiversity. A native village currently lives on the site of the discovery. Try to reach consensus on what should be done. Groups in the exercise include (1) the mining company who wants to extract the oil, (2) the native villagers who do not use oil currently, (3) the scientists researching the biodiversity of the area, and (4) the construction company in the closest city that would build the oil infrastructure if the mining company can move forward with the project and who would employ three hundred local workers.
2.4 In-Depth Discussion of Sustainability Topics
Learning Objectives
- Understand the scale of energy use by businesses in modern society.
- Discuss how peak oil impacts businesses.
- Understand how green economy activities relate to business sustainability.
Energy use is one of the fundamental connections between business and sustainability. All businesses require energy to convert inputs into outputs, whether it is a product- or service-based business. This section focuses on modern day use of energy and in particular on oil as one of the most prominent energy sources and a nonrenewable resource.
Modern Energy Use
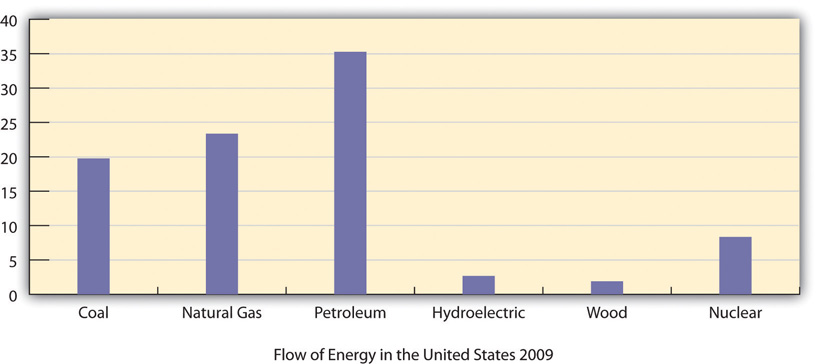
The United States accounts for 25 percent of world energy use, and its economy is a major driver of economic activity (and therefore energy use) throughout the world. In 2009, ninety-five billion MMBTU of energy was consumed in the United States. The main source of energy was from petroleum (oil), accounting for 37 percent of all energy consumed. Natural gas accounted for 25 percent, coal 21 percent, nuclear 9 percent, and renewable energy 8 percent. The United States was a net importer of energy in 2009, it imported 24 percent of the energy used, with about 85 percent of imports being petroleum based.“Annual Energy Review,” US Energy Information Administration, http://www.eia.doe.gov/aer.
The four main demand sectors in the US economy are transportation, industrial, residential and commercial, and electric power generation. In 2009, the largest energy demand sector was electric power generation, consuming 41 percent of the energy supply; the next largest was transportation at 28 percent, then industrial at 20 percent, and finally residential and commercial at 11 percent.
Figure 2.8 Flow of Energy in the United States, 2009Figure 1.0 Energy Flow, Annual Energy Review 2009, ftp://ftp.eia.doe.gov/multifuel/038409.pdf.
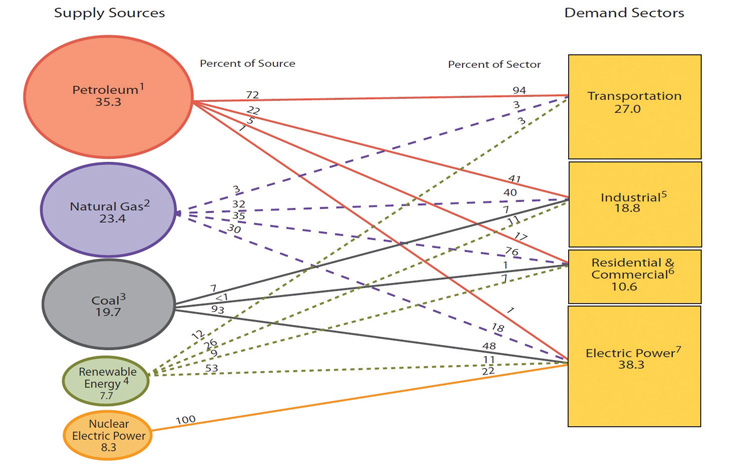
Source: Energy Information Administration.
US annual energy consumption peaked at 101.5 billion MMBTU in 2007, with the subsequent decline being primarily attributable to the 2008–9 recession in the United States. While currently below its peak, energy use has remained at high levels in the United States, 12 percent higher than usage in 1990.
In the early history of the United States, wood was the primary thermal energy source. In the late 1800s, coal overtook wood in terms of energy consumption. In the mid-1900s both natural gas and petroleum overtook coal in terms of overall energy consumption.
Figure 2.9
Source: US Energy Information Administration.
The current energy usage in the United States is heavily dependent on fossil fuels. Fossil fuels are fuels formed from the decomposition of dead organic material over periods of millions of years. Coal, oil, and natural gas are all forms of fossil fuels. In 2009, over 80 percent of US energy came from fossil fuels. The benefits of fossil fuels are that they are a relatively inexpensive source of energy, have historically been available in large supplies, and have a very high energy density (making them economical to use for a variety of sectors of the economy).
However, fossil fuels have drawbacks as well. They are considered nonrenewable, meaning that they can’t replenish themselves—at least on a human time scale. Also in their extraction from the ground, transportation, and use, they can damage the ecosystem. These two drawbacks are the main factors that raise sustainability concerns for fossil fuels.
Dependence on Imported Energy and National Security Concerns
The United States’ current high use of imported energy sources puts the nation at risk for politically motivated restrictions to foreign energy supplies. The risks include threats from repressive regimes in oil-producing Arab and other nations to restrict supply if certain political and economic conditions are not met. Without imported energy, the US economy would suffer. More efficient use of energy and increased production and use of domestically produced renewable and other sources of energy can help to reduce national security risks in the United States.
Peak OilEnergy Perspectives 2011, http://www.eia.gov/totalenergy/data/annual/archive/038410.pdf.
Source: US Energy Information Administration, US Primary Energy Consumption Estimates by Source, 1775–2010, Annual Energy Review.
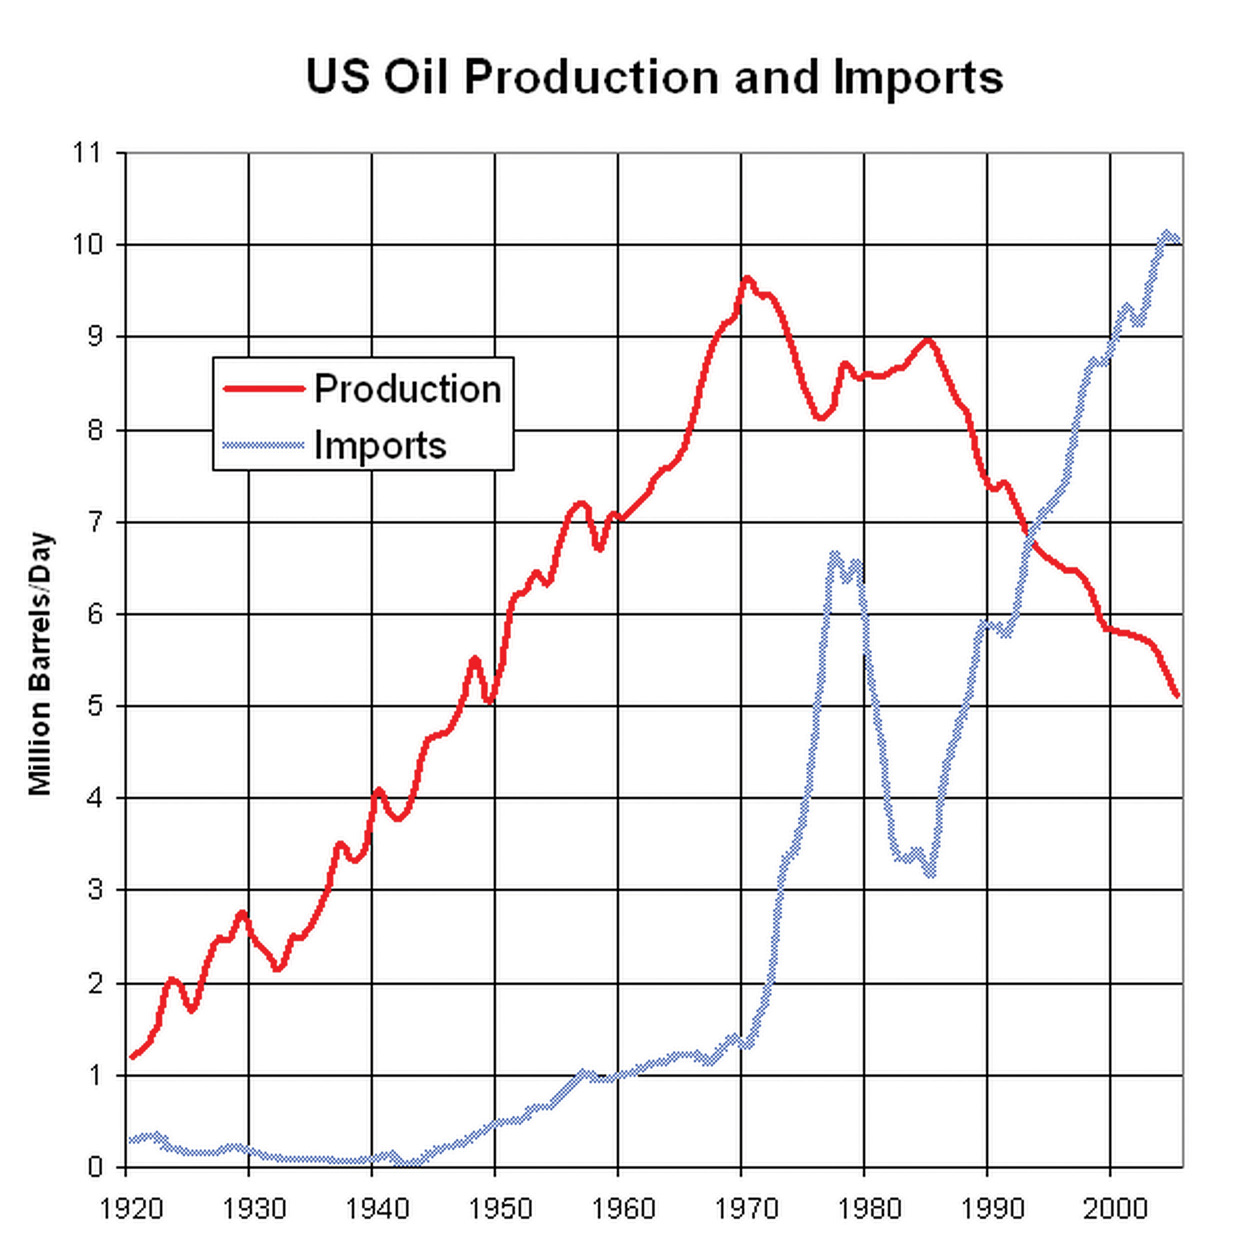
The fact that fossil fuels are nonrenewable means that at some point they will run out. Oil production in the United States peaked in 1970. While it is still uncertain as to when world oil production will peak, many sources are indicating a peak in the very near term.“The Peak Oil Crisis: Protests, Tsunamis & Deficits,” Falls Church News Press, March 16, 2011, http://www.fcnp.com/commentary/national/8762-the-peak-oil-crisis-protests-tsunamis-a-deficits.html. Petrobras CEO José Sergio Gabrielli stated that new capacity from new projects is insufficient to head off the decline in production and that to maintain existing production the world needs new oil volumes equivalent to Saudi Arabia’s contribution every two years; Saudia Arabia has the world’s largest oil-proved reserves at 262.6 billion barrels.“The World Factbook,” U.S. Central Intelligence Agency, https://www.cia.gov/library/publications/the-world-factbook/geos/sa.html.Sadad al-Husseini, former Saudia Arabian oil company Aramco executive, and multinational energy company Total’s CEO, Christophe de Margerie, both don’t see global oil production ever exceeding 89 million barrels per day (mbd). World oil production in the first quarter was 90.6 mbd, up 13 percent from the previous quarter.“Home Page,” International Energy Agency, http://omrpublic.iea.org. Other sources believe that oil production hasn’t peaked yet, but it is close to peaking. Researchers from Kuwait University and from Kuwait Oil Company predicted recently that world oil production will peak in 2014.“Home Page,” Hybrid Car Blog, http://www.hybridcarblog.com/labels/peak%20oil.html.
Figure 2.10 World Crude Output (Million Barrels per Day)http://omrpublic.iea.org/World/Wb_all.pdf.
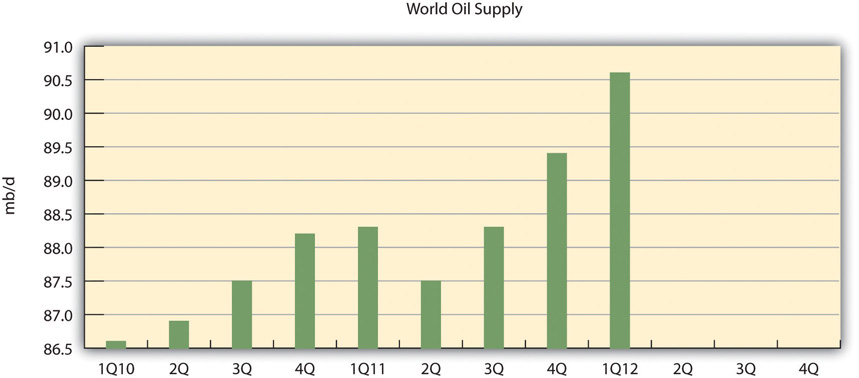
Source: International Energy Agency, World Oil Supply 2010–2012.
While world oil production has not peaked as of yet, what has peaked are discoveries of new oil reserves. The peak of world oilfield discoveries occurred in 1965 at around fifty-five billion barrels per year (Gb/yr). The rate of discovery has been falling steadily since. Less than ten Gb/yr of oil were discovered each year between 2002 and 2007. The annual rate of discovery of new fields has remained remarkably constant at fifteen to twenty Gb/yr.“Oil Exploration Costs Rocket as Risks Rise,” Reuters, http://www.reuters.com/article/idUSTRE61A28X20100211.
Figure 2.11 The Growing Gaphttp://en.wikipedia.org/wiki/File:GrowingGap.jpg.
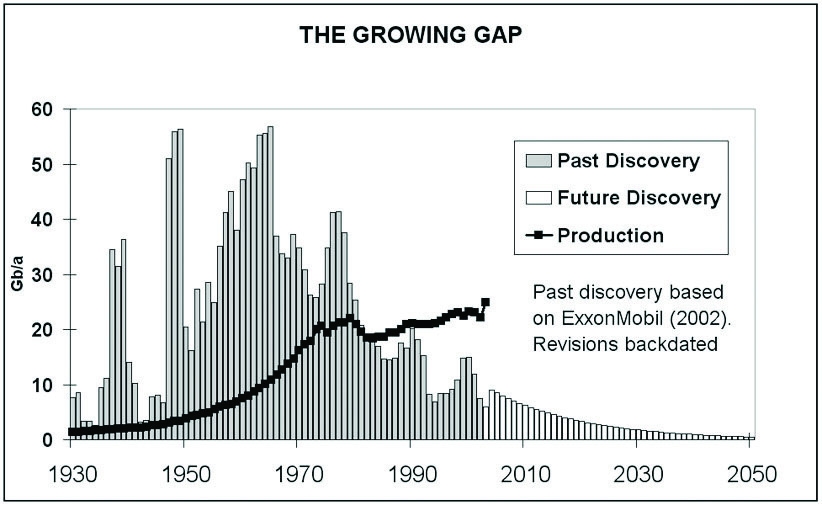
Source: The Oil Drum, http://www.theoildrum.com/uploads/3246/GrowingGap.jpg.
All the relatively easy to find and use oil and gas in the world has pretty much been found. Now comes the hard work in finding and producing oil from more challenging environments and work areas.
William J. Cummings, Exxon-Mobil company spokesman, December 2005
The actual date of the peak is not highly relevant; most relevant is that there is considerable evidence that world oil production will peak in the relatively near future. Given the high dependence of the US and world economy on oil, peak oil will put significant upward pressure on oil prices with the associated volatility as world demand for oil is expected to rise in the future and supplies begin to decline. The impact of reduced oil will demand some response from business to continue to survive and compete.
Green Economy
This section gives a brief discussion of the green economy and is meant to provide a little more detail on this aspect of sustainable business. The green economy can be thought of as private market efforts to address concerns about sustainability. Here the focus is on industries, while the focus of much of the book is at the individual business level. There is no single or standard definition of a “green job” or “the green economy,” but it relates to industries involved in activities that address in some way concerns about sustainability.
The green economy includes a broad number of industry and employment occupational categories. One classification of the green economy divides them into five different major categories of industries: energy efficiency, renewable energy, green transportation, environmental services, and clean or smart technology.
Energy efficiency industries, such as building contractors, insulation installers, and material providers, apply measures or practices to help use energy more efficiently. Environmental service industries, such as waste water treatment facilities, provide services directly or indirectly linked to the sustainability and improvement of the environment. Green transportation industries, such as mass transit operators, provide or produce relatively energy efficient transportation. Renewable energy industries, such as solar panels and wind turbine facilities, produce energy from resources that can be renewed. Clean or smart technology industries provide research, production, or services that directly or indirectly relate to the improvement of technology in the four other green industry categories. They include architectural design and services and energy efficiency control systems design and manufacturing.
Using this definition, in 2007, there were over 3.6 million green jobs in the United States, representing 3.2 percent of total private sector employment. Not only do green jobs represent a significant portion of the US economy, but green jobs also tend to pay well. The average annual wages earned in green employment nationally was $57,000, 40 percent above the national average earnings of $40,400. In the United States, the highest average annual wage green industries were in renewable energy and smart technology ($86,800 and $68,800, respectively) and the lowest average annual pay was in green transportation ($41,600).
Energy efficiency and smart technology were the two leading green industries in the United States, with each accounting for 1.1 million jobs and about 33 percent of overall green industry employment. The third most significant sector was environmental services, accounting for 900,000 jobs and 25 percent of overall green industry employment. Following that was green transportation, accounting for 300,000 jobs and 10 percent of overall green industry employment. The least significant green industry in terms of employment was renewable energy. This industry accounted for 100,000 jobs and about 3 percent of green industry employment.
Two areas of smart technology that deserve specific discussion are biotechnology and “green” chemistry. BiotechnologyThe application of biological techniques and living organisms to manufacture products, such as medicine., also known as “biotech,” involves engineering biological systems to develop commercial products. This includes medicines, agricultural products, biofuels, and packaging (such as biodegradable cups). Green chemistryChemistry that seeks to replace toxic and hazardous substances with less environmentally harmful alternatives. is the design of chemical products or processes that reduce or eliminate the generation of hazardous substances. Many products include toxic substances that are damaging to human health. Computers and other electronic devices contain lead, polychlorinated biphenyls (PCBs), cadmium, and mercury—all of which can cause injury to humans upon exposure. Biotechnology is related to green chemistry as biological processes may provide less environmentally damaging alternatives to conventional chemicals. For example, biodiesel, fuel made from vegetable oils, is nontoxic, while diesel fuel obtained from conventional crude oil is toxic.
Conclusion
This chapter has reviewed a variety of issues related to what we call the science of sustainability. There is little question that humans are putting significant demand on Earth’s resources, with negative impacts; however, there remains a certain amount of uncertainty of the long-term consequences. The market system and sustainable businesses can help address environmental challenges, but collective and governmental actions outside the market are also necessary given the scope and scale of challenges and the limitations of the market system.
Key Takeaways
- Both the global and US economies are heavily dependent on oil and other nonrenewable sources of fuel for energy.
- Nonrenewable resources will at some point run out as their amounts are finite.
- Peak oil has not yet occurred, but there is considerable evidence that a peak in oil supply will occur in the not too distant future.
- Green economy industries include energy efficiency, renewable energy, clean or smart technology, environmental services, and green transportation.
- The green economy sector makes up about 3 percent of the overall US economy in terms of employment.
Exercises
- Discuss the implications of peak oil in the context of the two limits to growth arguments introduced at the beginning of the chapter. What ways can society react based on the views presented? Which outcome, based on these views, do you feel is most likely?
- What role can sustainable businesses play in addressing the environmental challenges presented in the chapter?
- What are the limits of sustainable business in addressing environmental challenges?
Minicase: EnerTrac Saves Businesses Money While Reducing Carbon Emissionshttp://www.enertrac.com/services/heatingoil/.
EnerTrac, Inc., is a company based out of Hudson, New Hampshire, that was formed in 2006. The company manufactures a transmitter that can measure the fuel levels of heating oil or propane tanks and, using wireless technology, can send a signal to fuel dealers to let them know the amount of fuel in each customer’s tank. Traditionally, fuel dealers have had to estimate when to deliver fuel to customers, and this has resulted in unnecessary trips. Now fuel dealers can use their delivery computer systems to know exactly when to deliver fuel to customers. EnerTrac estimates that it can save fuel dealers $52 per year per customer by avoiding unnecessary deliveries. They can also reduce their truck fleet size because they are able to use a fewer number of trucks more efficiently.
EnerTrac is not only saving their customers (fuel dealers) money, but they are also helping them to reduce their GHG emissions. This is because for every unnecessary delivery trip avoided, there is less fuel the company has to use to service their customers. Fuel dealers can be more efficient in their fuel deliveries, reducing the fuel they use to provide service, which results in less carbon dioxide emissions from their delivery trucks. EnerTrac estimates that a fuel delivery company can reduce the carbon dioxide emissions from their trucks up to 40 percent by using their sensor technology.
Watch a video of Pat Mansfield, vice president of business development, explaining how the EnerTrac monitoring system works on YouTube here: http://www.enertrac.com/support/videos/heatingoil.shtml.
Exercise
- Watch the YouTube video of vice president of business development Pat Mansfield explaining the EnerTrac monitoring system. Write a paper discussing how his company’s product and services link business performance with environmental performance. This is described in this textbook as a “win-win” situation for business and the environment. Find an example online of another product that creates this “win-win” situation, and discuss it.