This is “United States: Population and Religion”, section 4.3 from the book Regional Geography of the World: Globalization, People, and Places (v. 1.0). For details on it (including licensing), click here.
For more information on the source of this book, or why it is available for free, please see the project's home page. You can browse or download additional books there. To download a .zip file containing this book to use offline, simply click here.
4.3 United States: Population and Religion
Figure 4.12
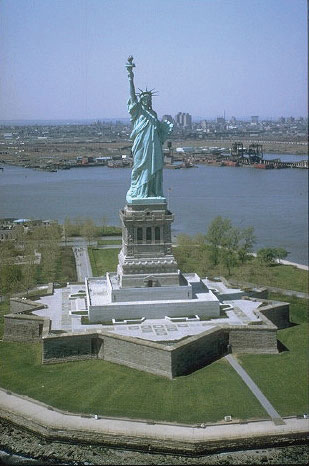
The Statue of Liberty has long been a symbol of the American ideals that welcome immigrants to America.
Source: Photo courtesy of the US Government, http://commons.wikimedia.org/wiki/File:Freiheitsstatue_NYC_full.jpg.
Learning Objectives
- Explain the concepts of the cultural melting pot and the American Dream and how they have contributed to American society and culture.
- Describe the current demographic profile of the United States.
- Identify the size, distribution, and other characteristics of the Hispanic population in the United States.
- Explain the two most significant processes that led to the spatial distribution of African Americans in the United States.
- Describe the distribution of the dominant religious affiliations in the United States.
The American “Melting Pot”
Early immigration to America was dominated by people from the British Isles, resulting in an American population for whom speaking English and practicing Protestant Christianity was the norm. There were some regional exceptions to this, such as Catholicism in Maryland and the widespread speaking of German in Pennsylvania, but by and large English and Protestantism were standard in the American colonies. As migrants arrived in the United States from non-English-speaking countries, within a generation they learned English and assimilated into American society, giving rise to the idea of the United States as a cultural melting potThe coming together a diverse group of immigrants to form one society or to share common ideals.. People were drawn to the United States by the hope of economic opportunities; most immigrants were poor and came to the United States to make a living and improve their financial well-being. They viewed assimilation into mainstream society as a necessity for success. They believed in the American Dream—that through hard work, you could achieve upward mobility and financial success no matter your background. The dream came true for millions of Americans but remains out of reach for many who live in poverty.
As of 2010, the United States was home to approximately 310 million people and was the third-most populated country in the world after China and India. Among developed countries, the US population is one of the fastest growing, at about 1 percent each year. This is thanks to a fertility rate of about 2.1 that is higher than the 1.5 for that of most European countries, as well as a positive net migration rate (more people immigrating to the United States than emigrating from it). In terms of human well-being, life expectancy is more than seventy-eight years for men, and the average woman can expect to live more than eighty years. While this may seem high, especially when compared with a century ago, life expectancy in the United States is lower than in forty-nine other countries.
Although English has remained the dominant language, as a country of immigrants, the United States is home to people from all corners of the world and home to many cultural or ethnic minority groups. According to the 2010 census, the ethnic minority groups in the United States included 16.3 percent Hispanic (who can be of any race); 12.6 percent black or African American; 5.0 percent Asian and Pacific Islander; and 1.0 percent Native American (American Indians, Eskimos, and Aleuts).“2010 Census Data,” US Census Bureau, http://2010.census.gov/2010census/data/. An interesting trend is that Asians are growing faster than any other ethnic group in California, the nation’s largest state. The 2010 census reported that the Asian population in California had increased 31.5 percent since 2000 to a total of five million.
The US Hispanic Population
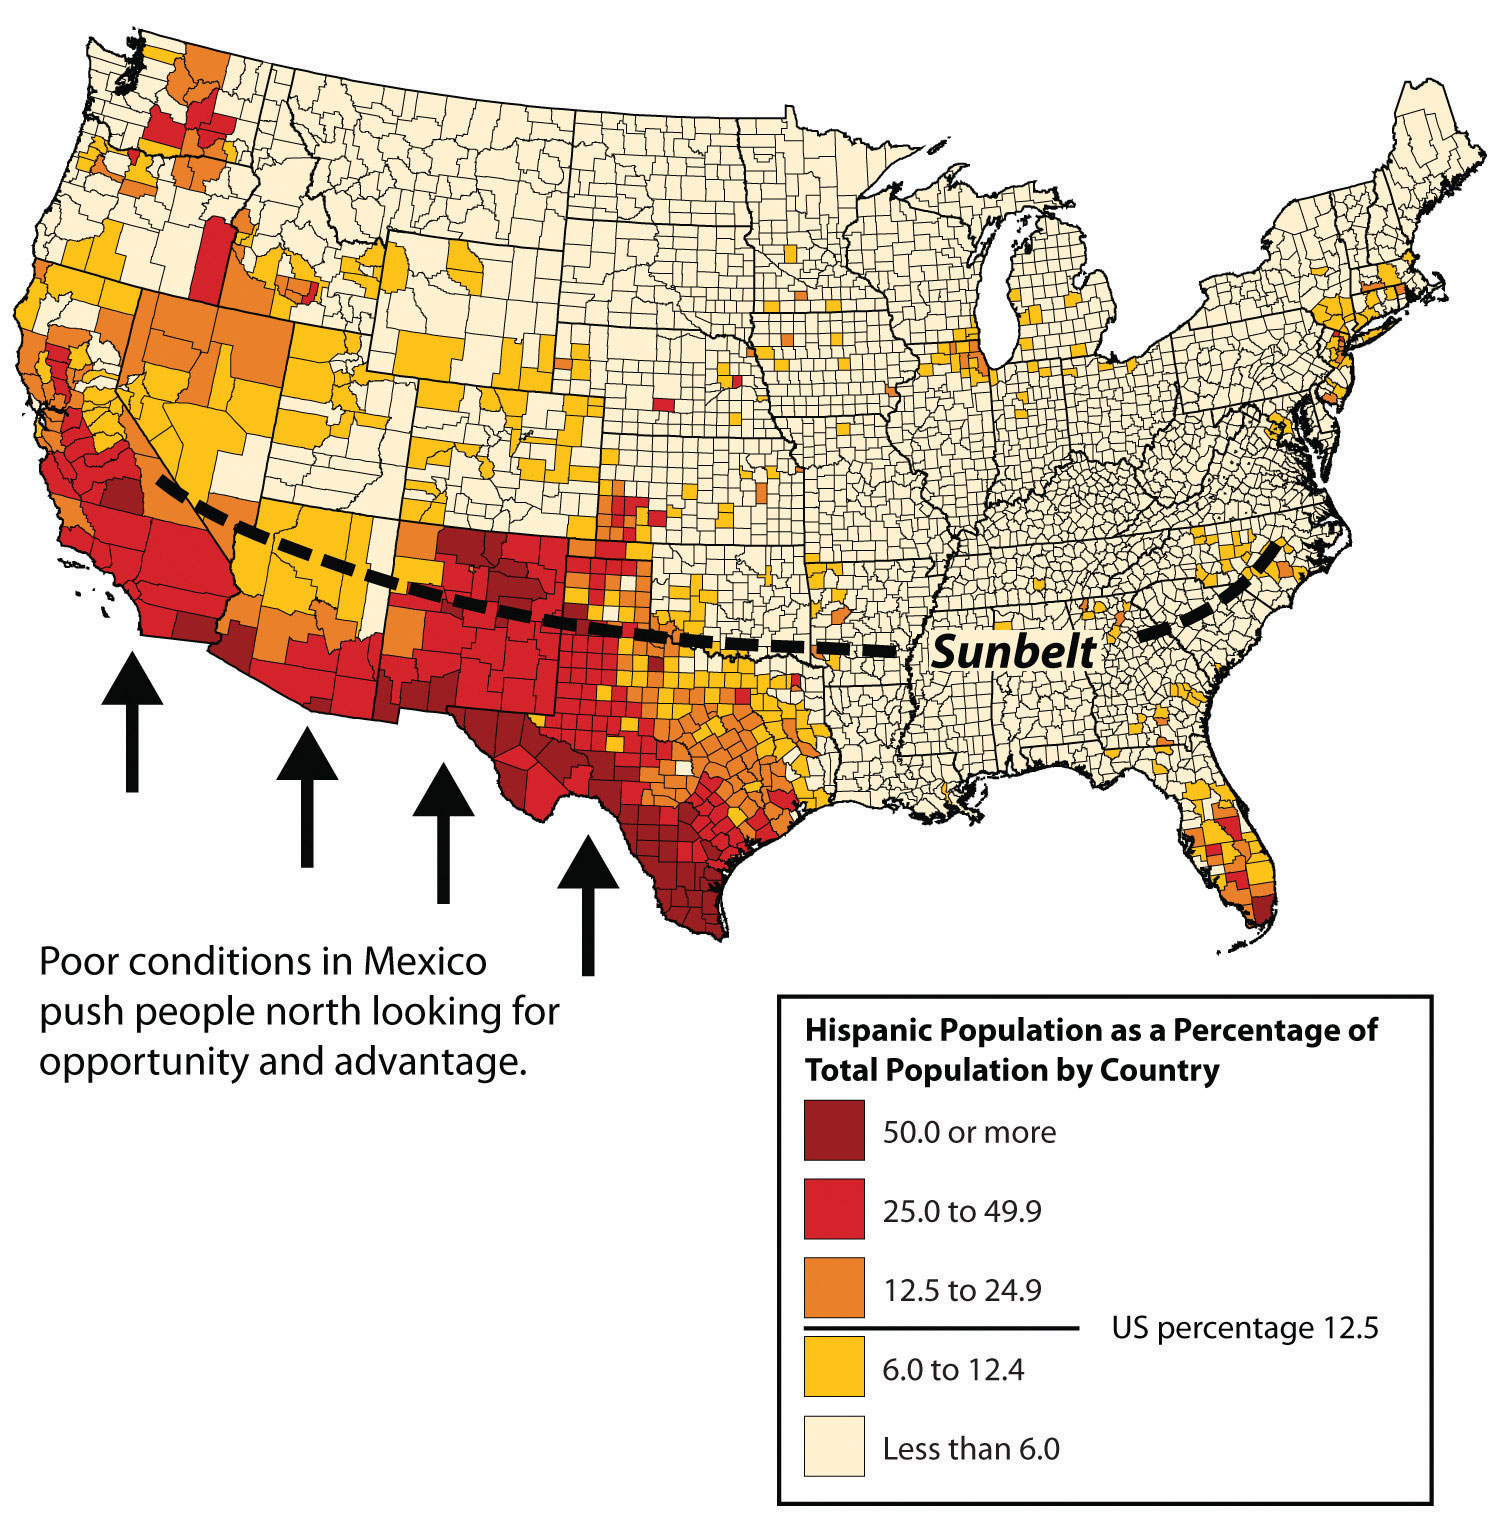
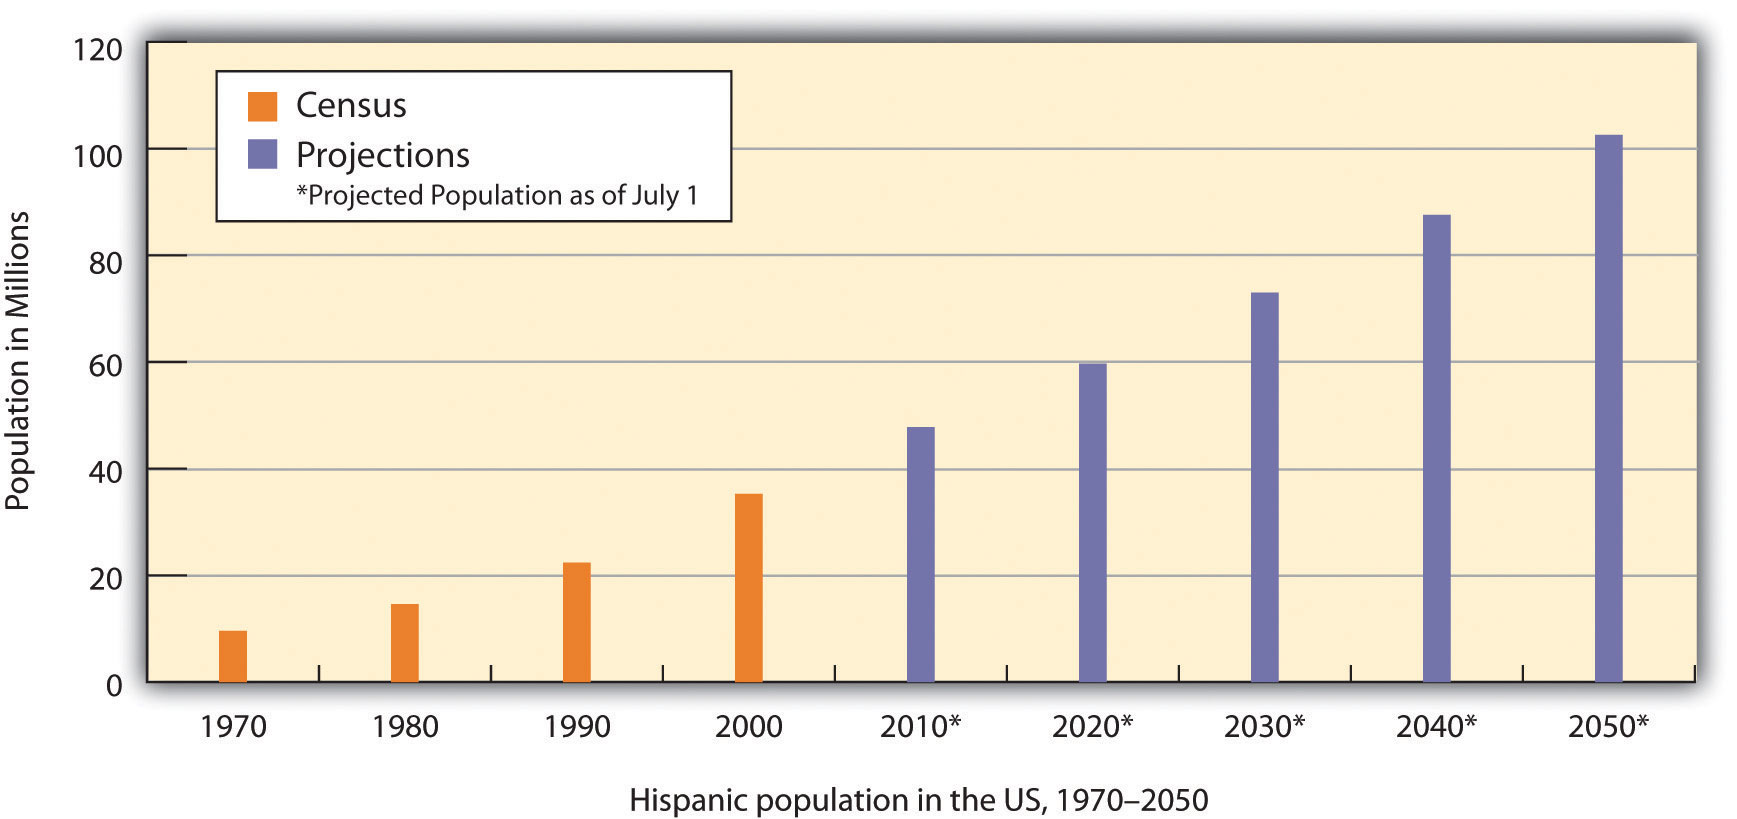
One of the most striking shifts in immigration patterns of the past few decades has been the dramatic increase in Hispanic/Latino immigrants to the United States. While there have long been Spanish speakers living in the United States (recall that Spain colonized Florida, Texas, and the Southwest before those regions became part of the United States), for most of American history the Hispanic minority had little impact outside of a few areas of the country. In 1970, Hispanics made up less than 5 percent of the US population, but by 2010, forty-eight million Hispanics made up about 16 percent of the population (Figure 4.13 "Hispanic Population in the United States and the US Sun Belt"). For the first time, Hispanics were the largest ethnic minority in the United States, surpassing blacks as the largest minority starting with the 2000 US census (12.5 percent Hispanic compared with 12.3 percent black). The US Hispanic population doubled between the 1990 and 2000 censuses. Between 2000 and 2006, Hispanic population growth accounted for about half the nation’s growth and grew about four times faster than the country’s population as a whole.
The growth of the US Hispanic population is a direct result of increased immigration from Latin America to the United States in the late twentieth and early twenty-first centuriesMichael Hoefer, Nancy Rytina, and Bryan C. Baker, “Estimates of the Unauthorized Immigrant Population Residing in the United States: January 2008,” Department of Homeland Security, accessed September 20, 2011, http://www.dhs.gov/xlibrary/assets/statistics/publications/ois_ill_pe_2008.pdf. and the Hispanic population having higher fertility rates than the non-Hispanic US population.Randal C. Archibold, “Arizona Enacts Stringent Law on Immigration,” New York Times, April 23, 2010, accessed September 20, 2011, http://www.nytimes.com/2010/04/24/us/politics/24immig.html.
Figure 4.13 Hispanic Population in the United States and the US Sun Belt
Source: Map courtesy of NationalAtlas, http://www.nationalatlas.gov/.
Nearly half the Hispanics in the United States live in California or Texas, although there has been a large increase in the Hispanic population outside those states in the past decade, especially in the South. For example, Arkansas, Georgia, Tennessee, and North and South Carolina all experienced Hispanic population growth rates between 55 and 61 percent from 2000 to 2006. All regions of the country saw double-digit growth rates of their Hispanic populations during that time. In places such as California, the large Hispanic population has an especially significant impact on the economy, politics, and every aspect of social life: more than one-third of Californians are Hispanic (37 percent), while 42 percent are non-Hispanic white, and a much smaller minority are African American (7 percent).
Who are the Hispanics living in the United States? Most were born in the United States (60 percent), while the rest are immigrants. Two thirds are either from Mexico or of Mexican descent, while others hail from the US territory of Puerto Rico, Cuba, or the Dominican Republic. Note that all Puerto Ricans are US citizens and can move to and from the US mainland without any special documentation requirements. More Hispanics come from Central America than from South America. Hispanics work in all professions but are found in professions such as agriculture, construction, and food service at higher rates than the country’s non-Hispanic population.
Figure 4.14 Hispanic Population in the United States, 1970–2050
Source: Data from the US Census Bureau, 1970, 1980, 1990, and 2000 Decennial Censuses; Population Projections, July 1, 2010, to July 1, 2050.
Figure 4.15
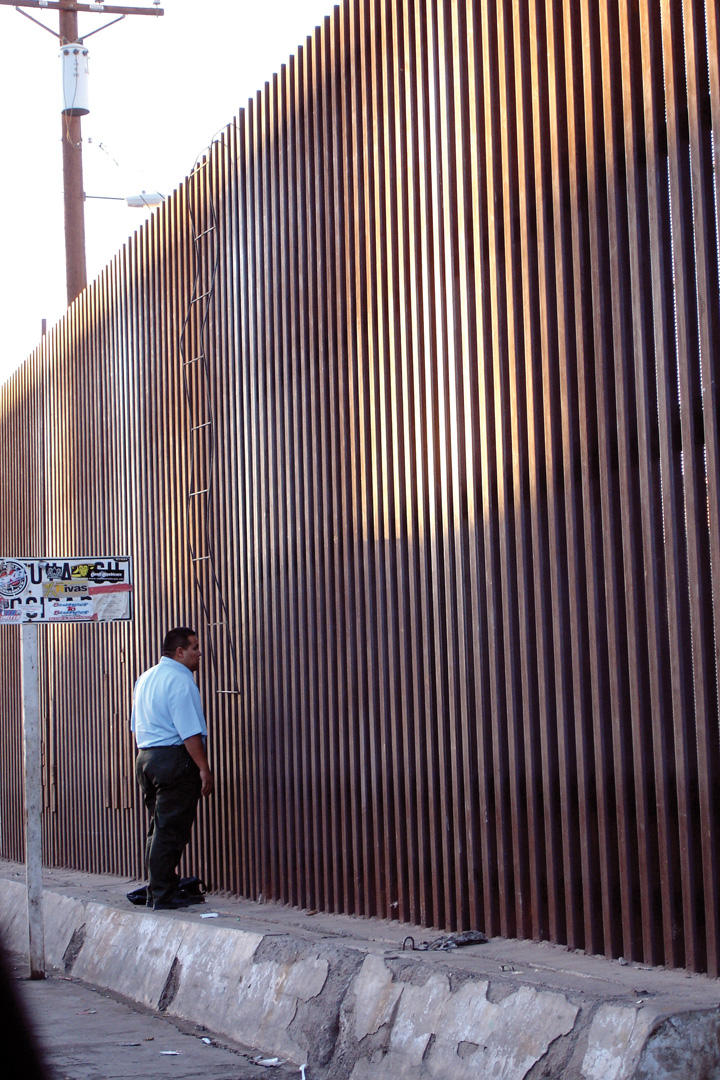
Two men tried to cross the US border from the Mexican side with a homemade ladder built of rebar. They hooked the ladder to the wall. One man climbed over and was arrested by the US Border Patrol; the other man ran away and was arrested by the Mexican border police.
Source: Photo courtesy of Omar Bárcena, http://www.flickr.com/photos/omaromar/316206516.
The draw of opportunities and advantages has always pulled people toward the United States. While many of the Latin American immigrants enter the United States legally, according to the US Department of Homeland Security’s Office of Immigration Statistics, there were about 10.8 million undocumented immigrants residing in the United States as of 2010; 62 percent are from Mexico.“Immigration Statistics,” US Department of Homeland Security, http://www.dhs.gov/files/statistics/immigration.shtm. This number is lower than it was in previous years, possibly because of the economic recession and higher-than-usual rates of unemployment. The US-Mexican border is about 1,970 miles long and runs through an arid and open region between the two countries. It is difficult to control the illegal immigration across this border, as the attraction to American jobs is so compelling that people will risk death to cross the deserts of the Southwest. According to 2010 estimates, undocumented workers make up about 5 percent of the United States’ civilian workforce, including approximately 24 percent of the agricultural workforce.
The amount of remittancesMoney sent home by immigrants. sent from undocumented workers in the United States to Mexico is estimated in the billions of dollars. The remittances from Mexican nationals living outside Mexico and sending money home to their families are Mexico’s second-largest source of foreign income. Without remittances, many Mexican families would have a difficult time making ends meet.
The African American Population
Most African Americans were concentrated in the South before the Civil War, where they worked as slaves in the cotton and tobacco plantations that supported the region. In some counties, blacks made up most of the population, and this did not change when the war was over. Many of the newly freed slaves remained as poor agricultural workers in the South well into the twentieth century. Even as late as 1910, seven out of every eight African Americans lived in the South.
Figure 4.16 Civil War Division in the United States, 1861–1865
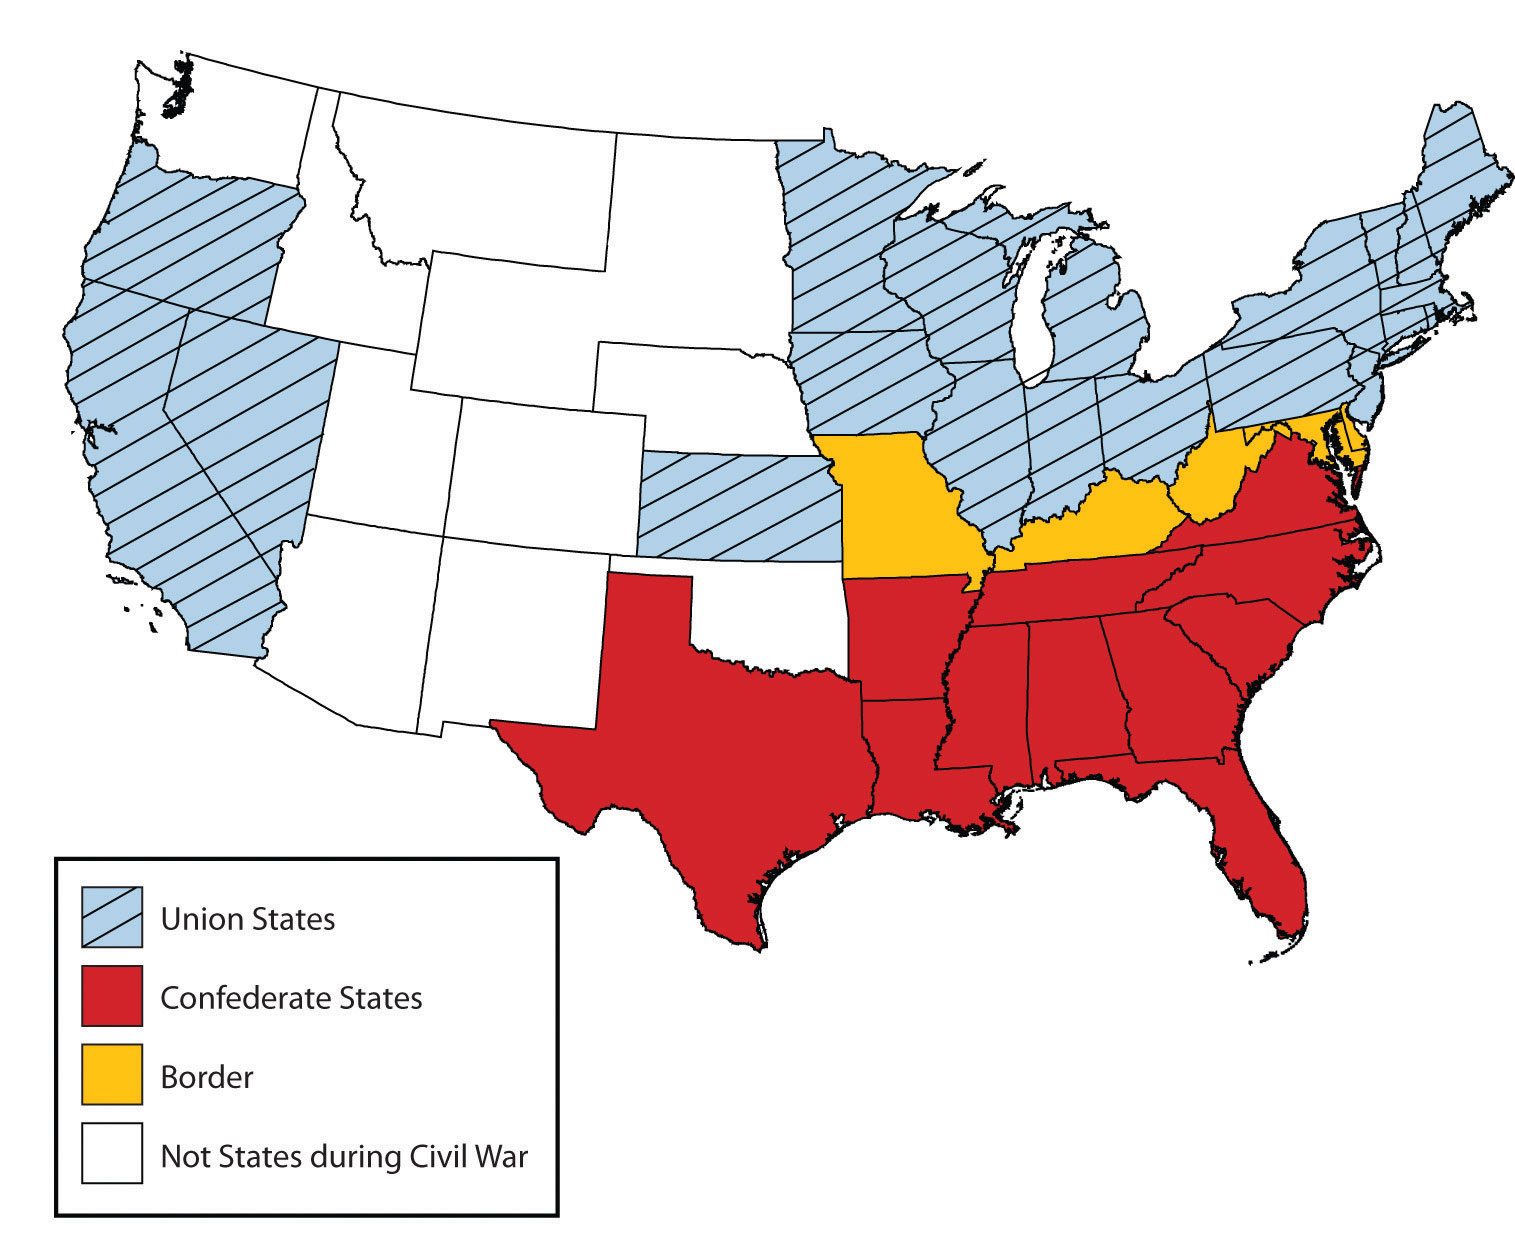
Union States are in the north, Confederate States are in the south, and border states are in the middle.
In the late nineteenth and early twentieth centuries, as the industrialization of northern cities was accelerating, the increased need for factory workers was largely met by immigration from Europe, especially from southern and eastern Europe. However, when the First World War began (1914), European immigration began to slow down. European immigration then nearly ground to a halt in the 1920s as Americans set quotas in place to reduce the number of Eastern European immigrants. At that time, the factories in the Manufacturing Belt continued to need workers, but instead of European workers, they recruited African Americans from the South.
This led to a massive migration of blacks from the South to cities of the North and West. This migration was so significant to African Americans in the United States that it is called the Great MigrationA massive migration of blacks from the South to cities of the North and West. Between 1910 and 1925, more than 10 percent of African Americans made the journey north.. Between 1910 and 1925, more than 10 percent of African Americans made the journey north, and even more followed. Examining a map of the distribution of African Americans today shows the legacy of the Great Migration, as blacks live in many parts of the United States, both in the South and in postindustrial cities of the north and the Midwest. Blacks also now live in Sun Belt cities, as people of all races look for jobs related to the new information technologies and service industries.
Figure 4.17 Black/African American Population by County, 2000
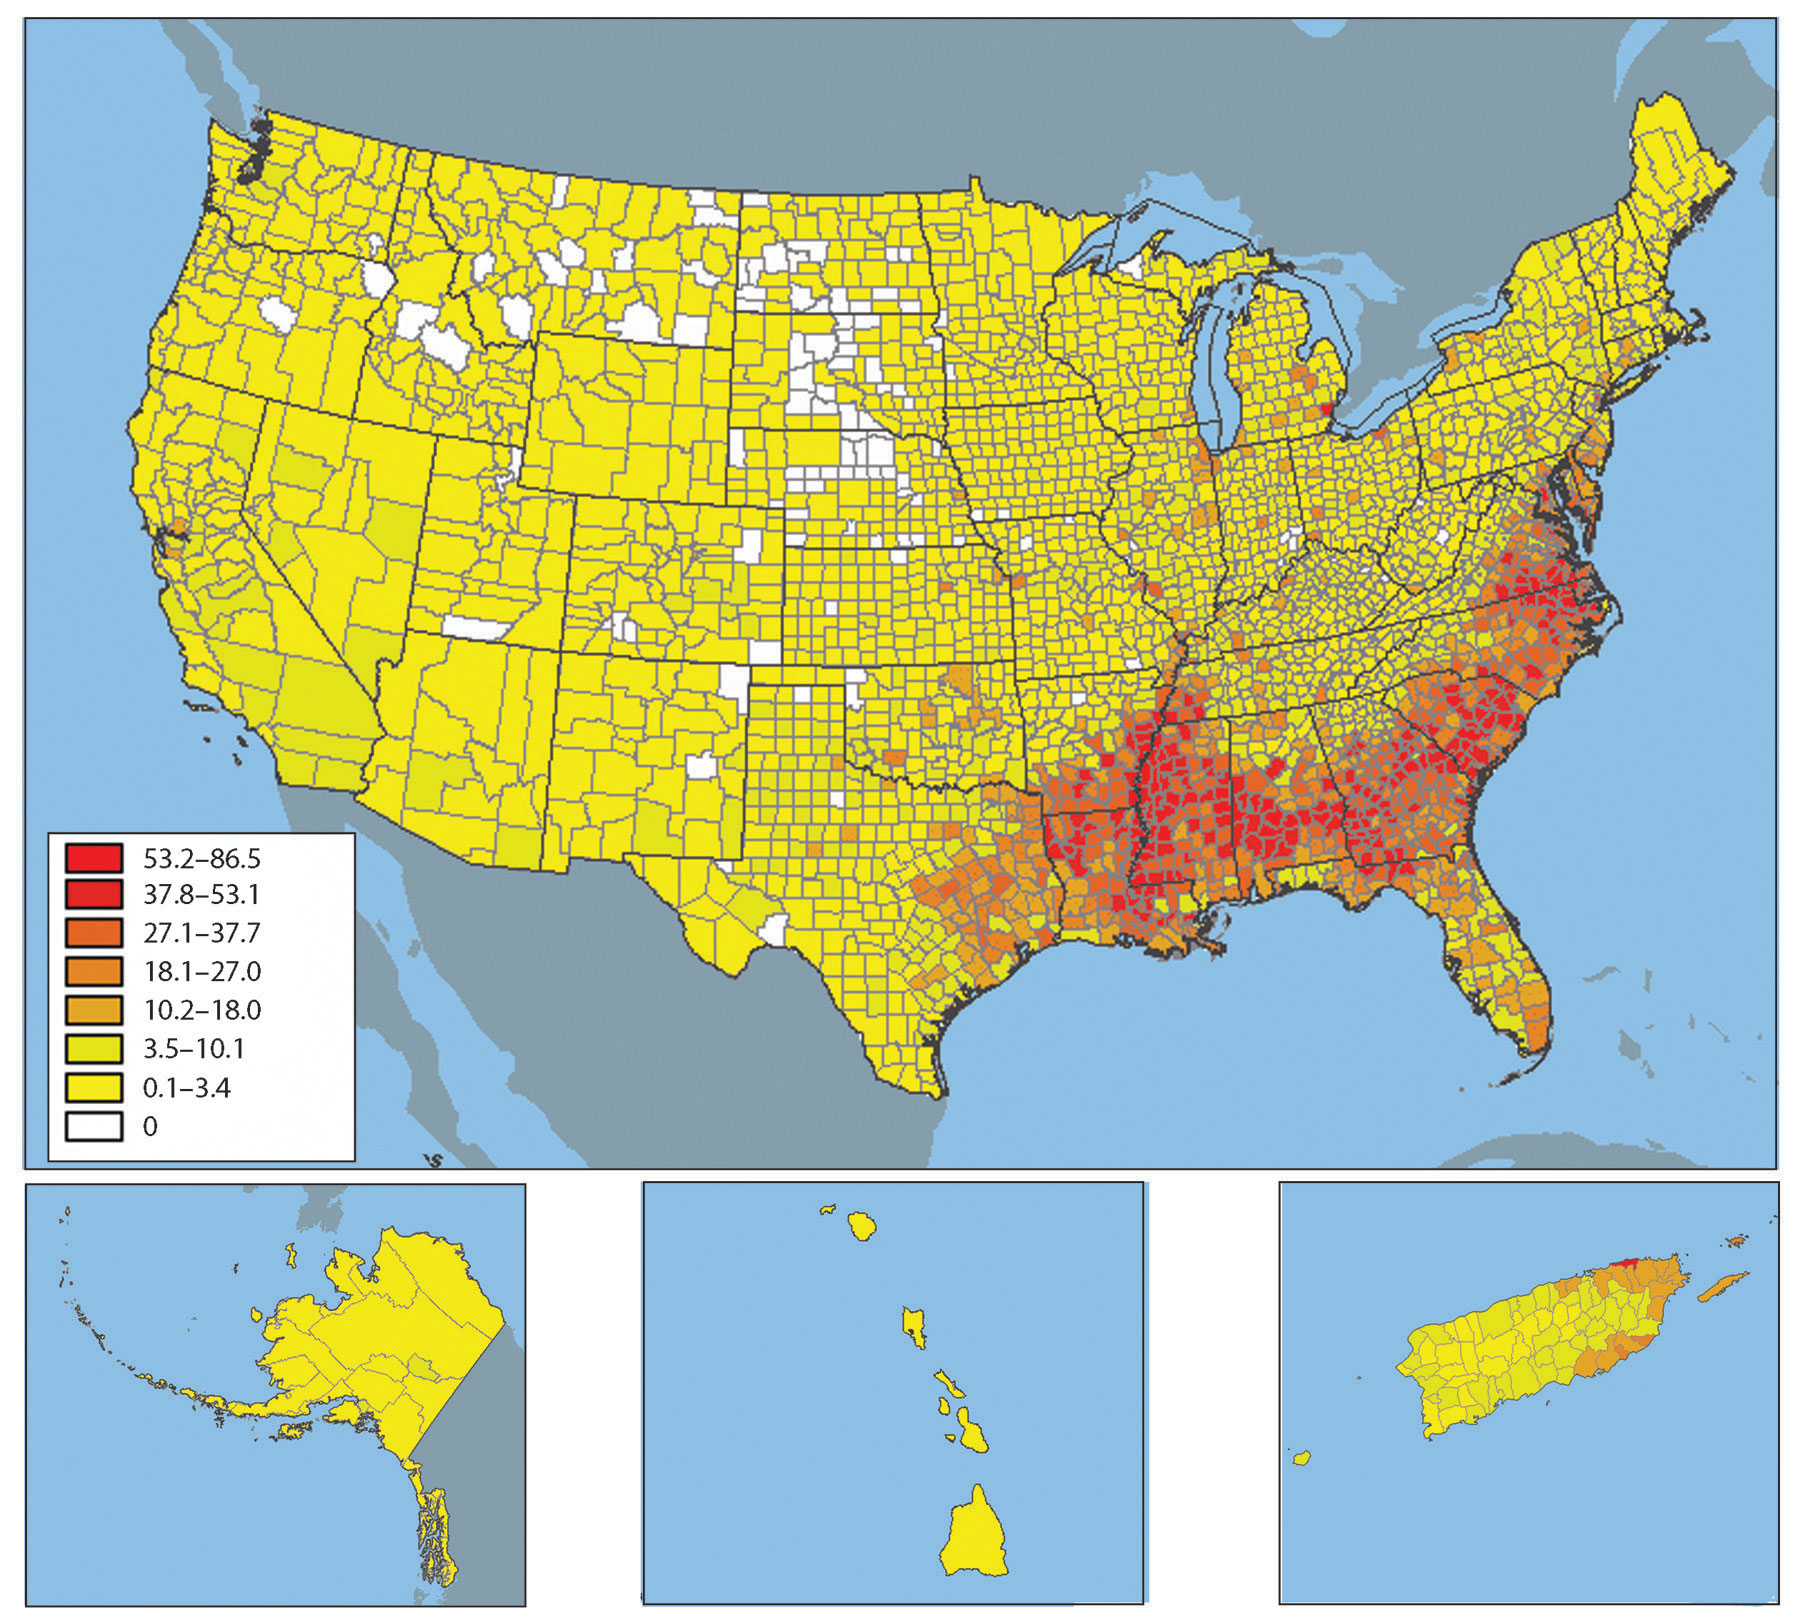
Source: Map courtesy of NationalAtlas, http://www.nationalatlas.gov/.
Geography of Religion in the United States
Most early settlers to the United States were Protestant Christians: Puritans lived in New England and Anglicans (later called Episcopalians) lived in Virginia. Roman Catholic immigrants settled in Maryland, and members of the Society of Friends (Quakers) founded Pennsylvania. Even within that overall picture, there was a great deal of religious diversity in the United States, and that diversity increased as new arrivals came from different countries with different religious backgrounds. The current pattern of religious affiliation in the United States remains quite complex, and one can find observers of nearly every major religion, and many minor ones, in virtually every area of the country. That being said, there are clear patterns to the geography of religion in the United States that tell stories of immigration and migration history, as well as stories about other aspects of American history. The map of leading church bodies (Figure 4.18 "Distribution of Religious Organizations in the United States") shows regions of religious observance that are worth examining.
Figure 4.18 Distribution of Religious Organizations in the United States
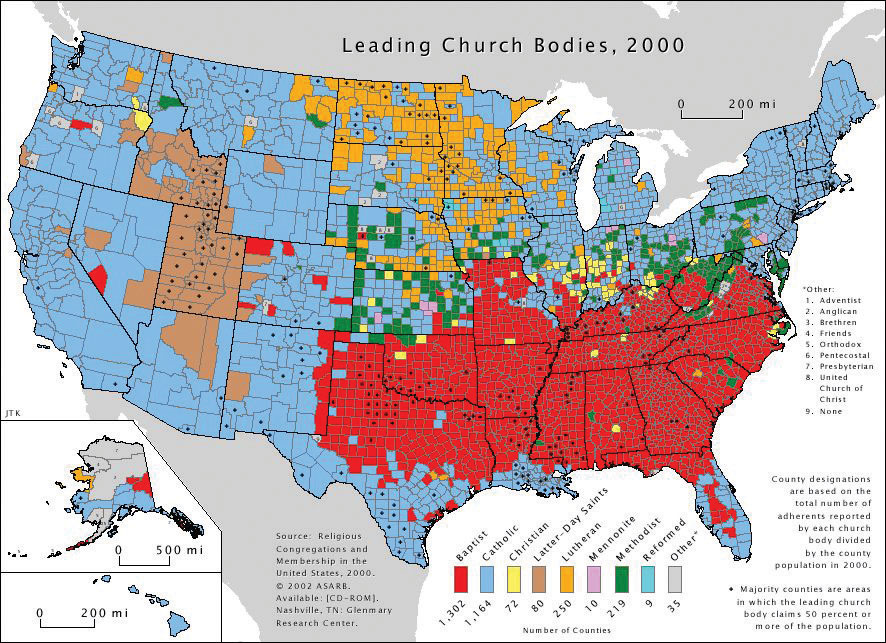
Source: Map courtesy of Verrai, http://commons.wikimedia.org/wiki/File:Religions_of_the_US.PNG.
The most striking feature of the map is the block of red in the Southeast in which Baptist churches are the leading church body. Although Baptist churches are the leading religious body in about 45 percent of all counties in the United States, most of those counties are found in the South. This region is considered the nation’s Bible Belt, and it is a region in which churches are more likely than in other parts of the country to teach a literal interpretation of the Bible. Baptist churches grew in popularity in the South after the Civil War as more liturgical denominations such as Methodists went into decline, and Baptist churches are popular among both African American and white residents.
Figure 4.19
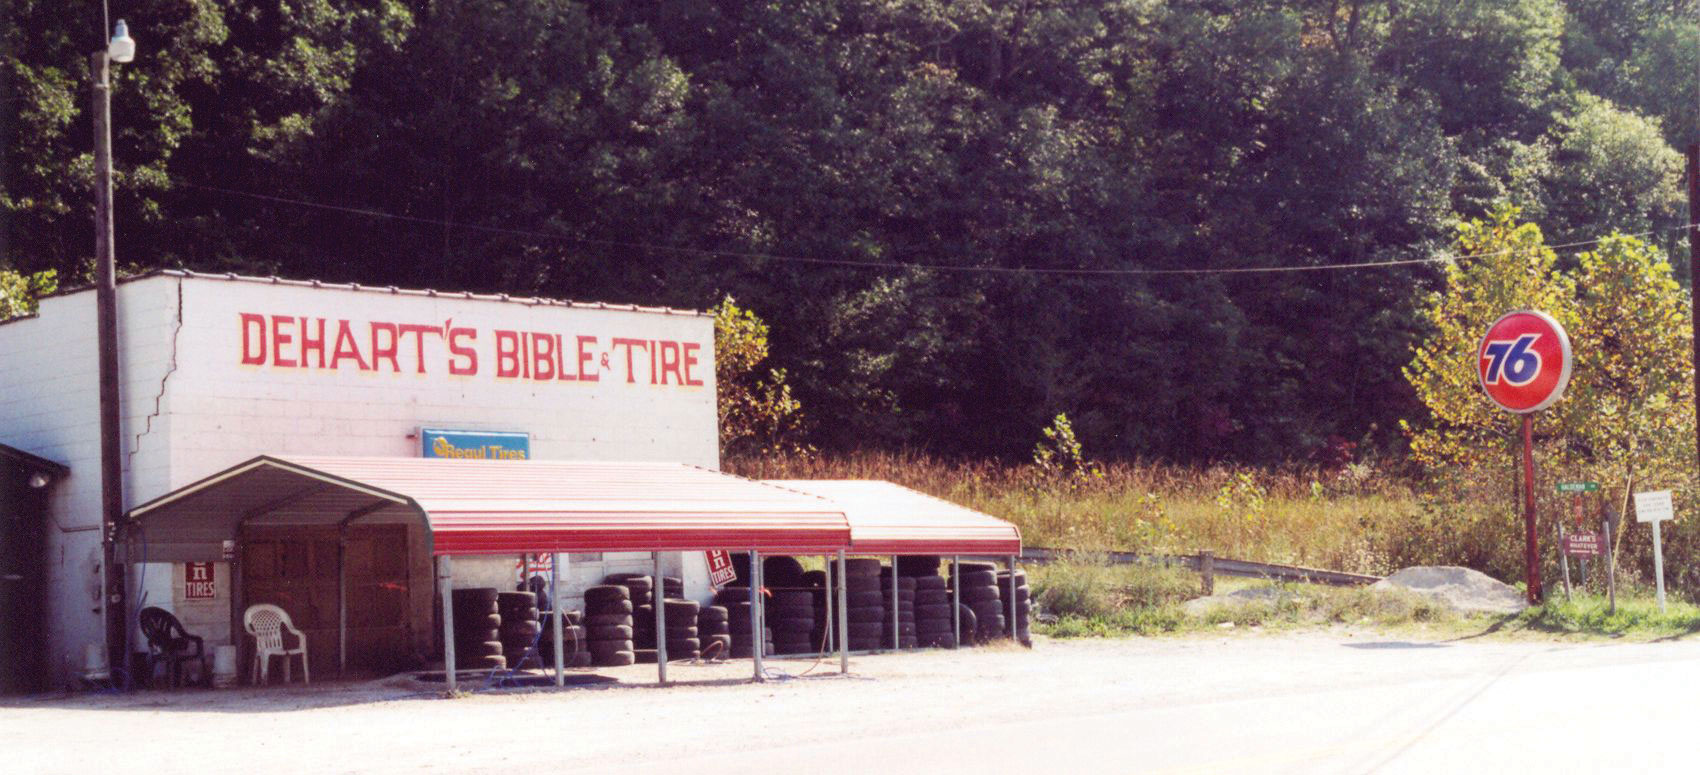
Dehart’s Bible and Tire is located in the peripheral region of eastern Kentucky in the Bible Belt. Customers get a free Bible with every set of new tires.
Source: Photo by R. Berglee.
Another interesting Protestant region is northern Appalachia and the lower Midwest from Ohio to Iowa and Kansas. As seen on the map, some of these counties are Baptist, in some of them the strongest church presence is Methodist, and in others it is Christian churches (Disciples of Christ and historically similar denominations) that prevail. The Methodist and other Christian areas were heavily influenced by the Second Great Awakening of the early nineteenth century, which promoted the theology that every person could be saved through revivals. The movement provided for strong showings of Protestant denominations that arose during that time. The third Protestant region is the northern Midwest and Great Plains: Minnesota, the Dakotas, and surrounding areas. This was the destination of German and Scandinavian Lutheran settlers during the late nineteenth and early twentieth centuries, and the leading denominations today in much of that area remain Lutheran.
The Roman Catholic Church, which is the leading religious body in 40 percent of US counties, is well represented in the Northeast, West, and Southwest. In the Northeast and Midwest, the Catholic dominance points to nineteenth- and early twentieth-century immigration from Roman Catholic countries in Europe such as Italy, Ireland, and Poland. Those earlier Catholics have been joined more recently by large numbers of Hispanic immigrants. The dominance of Roman Catholics in the western United States, the Southwest, and even Florida in the Southeast are a reflection of the strong Hispanic presence in those parts of the country.
In the western United States, the Church of Jesus Christ of Latter-Day Saints (Mormon church or LDS) dominates a region including Utah and surrounding states. Utah was the destination of Mormon members as they migrated westward during the mid-nineteenth century.
Major urban centers are home to people who follow all the major religions of the world. Muslim populations are found in cities as a result of late twentieth century immigrants arriving from countries such as India, Pakistan, and places in the Middle East and moving to urban areas for employment. Detroit and its surrounding counties in southeastern Michigan are one part of the country with a high concentration of Muslim immigrants.
Key Takeaways
- US immigrants learned English and assimilated into American society, giving rise to the idea of the United States as a cultural melting pot.
- Immigrants created the American Dream—the idea that by working hard and following the rules, one could achieve upward mobility and financial success regardless of one’s background or heritage.
- The Hispanic population is the largest minority group in the United States, and its population is growing.
- Hispanics have an especially strong presence in California and Texas but are found all over the South as well as in rural and urban areas around the country.
- One-third of Hispanics are immigrants to the United States, and most undocumented workers to the United States are Hispanic (58 percent are from Mexico).
- Mexican nationals are an important component of the US workforce, and they send home billions of dollars each year in the form of remittances.
- African Americans are heavily represented in former plantation agricultural states of the South, as well as in cities of the Rust Belt and far West.
- Patterns of religious observance in the United States reflect immigration patterns.
Discussion and Study Questions
- Why has the United States been called a melting pot? What are the largest minority groups in the country?
- What parts of the United States have the highest representation of the four largest minority groups?
- How did the US Hispanic population change in size and location from 2000 to 2010? Why is the Hispanic population growing faster than other ethnic groups in the United States?
- What two states have about 50 percent of the Hispanic population?
- What have been the push-pull factors for Hispanic immigration to the United States?
- What is a remittance, and how are remittances significant for immigrants to the United States?
- Describe the spatial pattern of the African American population. Why do so many blacks live in the Southeast?
- What was the Great Migration, and what were some of its long-term impacts on the United States?
- List three of the main Protestant religious denominations in the United States, describe their spatial patterns, and explain what caused these patterns.
- Name the states or provinces that have high percentages of Catholics.


