This is “Depicting a Free Trade Equilibrium in the Heckscher-Ohlin Model”, section 5.10 from the book Policy and Theory of International Trade (v. 1.0). For details on it (including licensing), click here.
For more information on the source of this book, or why it is available for free, please see the project's home page. You can browse or download additional books there. To download a .zip file containing this book to use offline, simply click here.
5.10 Depicting a Free Trade Equilibrium in the Heckscher-Ohlin Model
Learning Objective
- Learn how to depict a free trade equilibrium on a PPF diagram in the Heckscher-Ohlin (H-O) model.
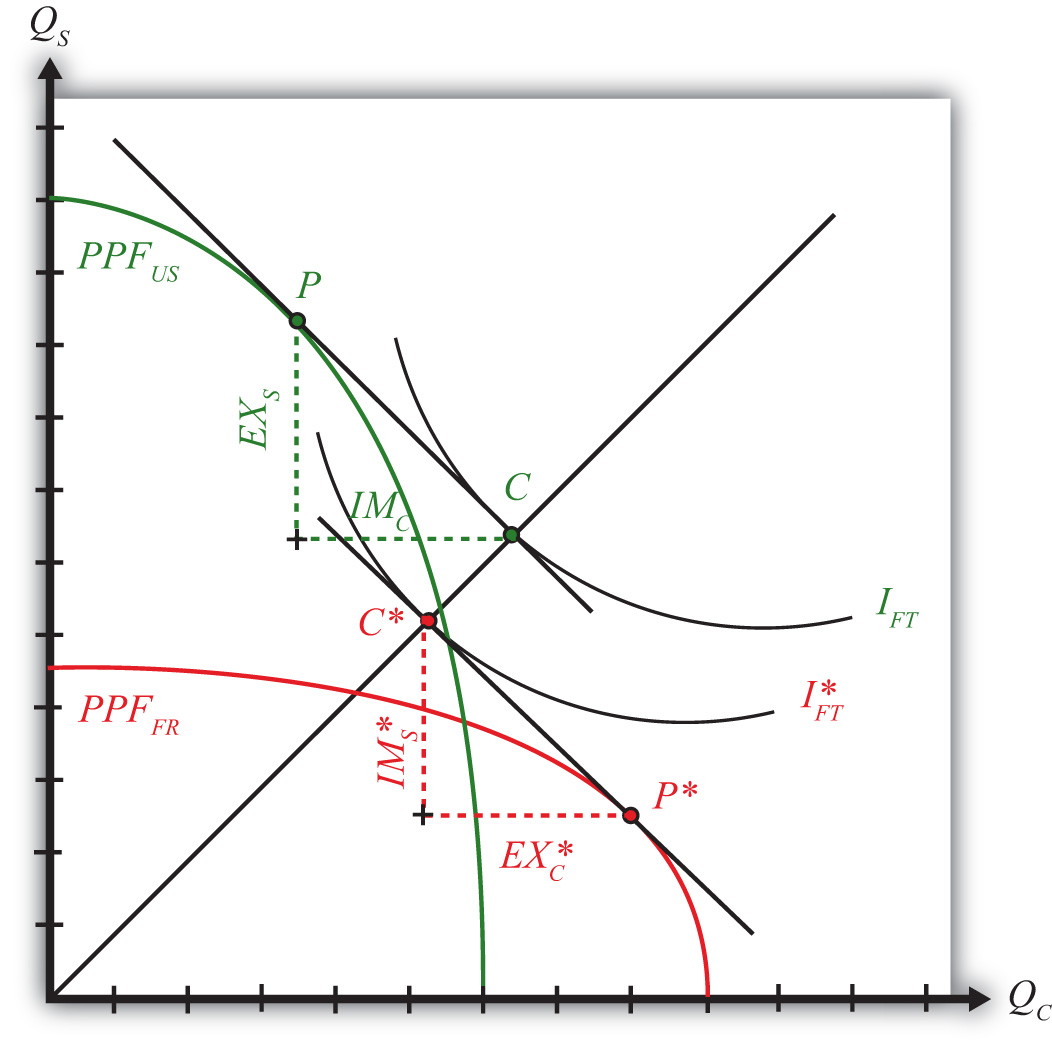
In Figure 5.8 "Free Trade Equilibria in an H-O PPF Diagram", we depict free trade equilibria in a Heckscher-Ohlin (H-O) model. The United States is assumed to be capital abundant, which skews its PPFUS (in green) in the direction of steel production, the capital-intensive good. France is labor abundant, which skews its PPFFR (in red) in the direction of clothing production, the labor-intensive good. In free trade, each country faces the same price ratio.
Figure 5.8 Free Trade Equilibria in an H-O PPF Diagram

The United States produces at point P. The tangent line at P represents the national income line for the U.S. economy. The equation for the income line is PCQC + PSQS = NI, where NI is national income in dollar terms. The slope of the income line is the free trade price ratio (PC/PS)FT. Consumption in the United States occurs where the aggregate indifference curve IFT, representing preferences, is tangent to the national income line at C. To reach the consumption point, the United States exports EXS and imports IMC.
France produces at point P∗. The tangent line at P∗ represents the national income line for the French economy. The slope of the income line is also the free trade price ratio (PC/PS)FT. Consumption in France occurs where the aggregate indifference curve IFT∗, representing preferences, is tangent to the national income line at C∗. Note that since the United States and France are assumed to have the same aggregate homothetic preferences and since they face the same price ratio in free trade, consumption for both countries must lie along the same ray from the origin, 0C. For France to reach its consumption point, it exports EXC∗ and imports IMS∗. In order for this to be a free trade equilibrium in a two-country model, U.S. exports of steel must equal French imports of steel (EXS = IMS∗) and French exports of clothing must equal U.S. imports of clothing (EXC∗ = IMC). In other words, the U.S. trade triangle formed by EXS, IMC, and the U.S. national income line must be equivalent to France’s trade triangle formed by EXC∗, IMS∗, and the French national income line.
Key Takeaways
- The line tangent to the free trade production point on the PPF represents the national income line and has a slope equal to the terms of trade.
- The consumption point in a free trade equilibrium is found as the tangency point of the highest national indifference curve along the national income line tangent to the production point.
- The pattern of trade is shown as the exports and imports needed to move from the production point to the consumption point.
Exercise
-
Jeopardy Questions. As in the popular television game show, you are given an answer to a question and you must respond with the question. For example, if the answer is “a tax on imports,” then the correct question is “What is a tariff?”
- The term used to describe the slope of the national income line in a two-good, variable proportions H-O model.
- In a two-good, variable proportions H-O model, this occurs where the national income line is tangent to the PPF.
- In a two-good, variable proportions H-O model, this occurs where the national income line is tangent to an indifference curve.
- In a two-good, variable proportions H-O model, these form the base and height of the triangle between the production and consumption points on the PPF diagram.


