This is “Shifting the DD Curve”, section 20.3 from the book Policy and Theory of International Economics (v. 1.0). For details on it (including licensing), click here.
For more information on the source of this book, or why it is available for free, please see the project's home page. You can browse or download additional books there. To download a .zip file containing this book to use offline, simply click here.


20.3 Shifting the DD Curve
Learning Objective
- Learn which exogenous variables will shift the DD curve and in which direction.
The DD curve depicts the relationship between changes in one exogenous variable and one endogenous variable within the goods and services (G&S) market model. The exogenous variable assumed to change is the exchange rate. The endogenous variable affected is the gross national product (GNP). At all points along the DD curve, it is assumed that all other exogenous variables remain fixed at their original values.
The DD curve will shift, however, if there is a change in any of the other exogenous variables. We illustrate how this works in Figure 20.3 "DD Curve Effects from a Decrease in Investment Demand". Here, we assume that the level of investment demand in the economy falls from its initial level I1 to a lower level I2.
At the initial investment level (I1) and initial exchange rate (E$/£1) the AD curve is given by AD(…, E$/£1, I1, …). The AD curve intersects the forty-five-degree line at point G, which is transferred to point G on the DD curve below. If the investment level and all other exogenous variables remain fixed while the exchange rate increases to E$/£2, then the AD curve shifts up to AD(…, E$/£2, I1, …), generating the equilibrium points H in both diagrams. This exercise plots out the initial DD curve labeled DD|I1 in the lower diagram connecting points G and H. DD|I1 is read as “the DD curve given that I = I1.”
Figure 20.3 DD Curve Effects from a Decrease in Investment Demand
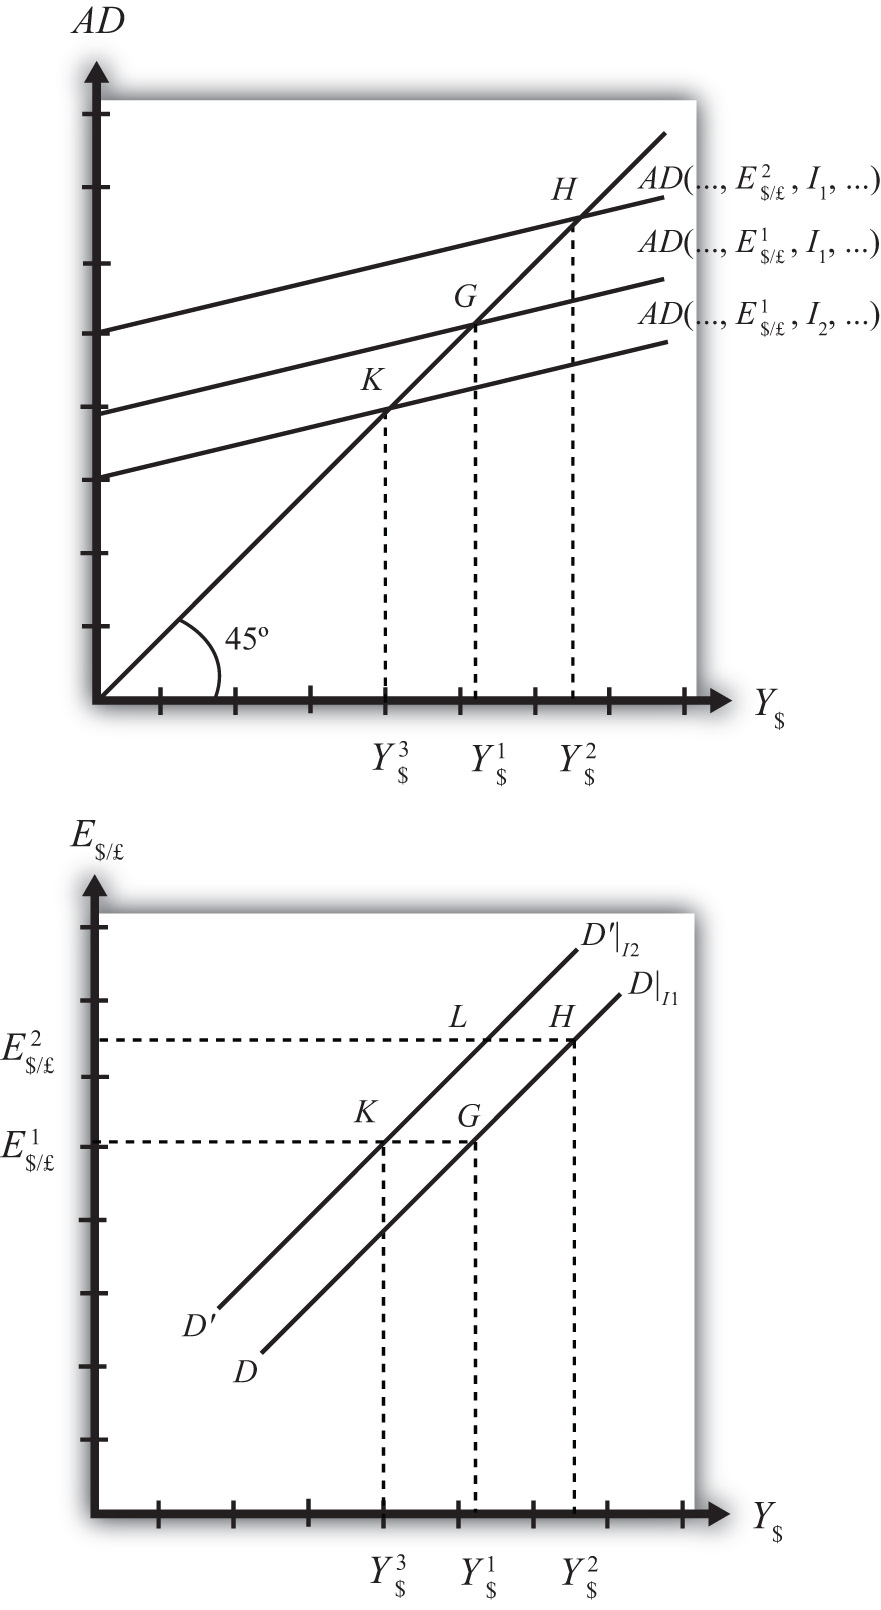
Now, suppose I falls to I2. The reduction in I leads to a reduction in AD, ceteris paribus. At the exchange rate E$/£1, the AD curve will shift down to AD(…, E$/£1, I2, …), intersecting the forty-five-degree line at point K. Point K above, which corresponds to the combination (E$/£1, I2), is transferred to point K on the lower diagram. This point lies on a new DD curve because a second exogenous variable, namely I, has changed. If we maintain the investment level at I2 and change the exchange rate up to E$/£2, the equilibrium will shift to point L (shown only on the lower diagram), plotting out a whole new DD curve. This DD curve is labeled D′D′|I2, which means “the DD curve given is I = I2.”
The effect of a decrease in investment demand is to lower aggregate demand and shift the DD curve to the left. Indeed, a change in any exogenous variable that reduces aggregate demand, except the exchange rate, will cause the DD curve to shift to the left. Likewise, any change in an exogenous variable that causes an increase in aggregate demand will cause the DD curve to shift right. An exchange rate change will not shift DD because its effect is accounted for by the DD curve itself. Note that curves or lines can shift only when a variable that is not plotted on the axis changes.
The following table presents a list of all variables that can shift the DD curve right and left. The up arrow indicates an increase in the variable, and the down arrow indicates a decrease.
| DD right-shifters | ↑G ↑I ↓T ↑TR ↓P$ ↑P£ |
| DD left-shifters | ↓G ↓I ↑T ↓TR ↑P$ ↓P£ |
Refer to Chapter 19 "National Output Determination" for a complete description of how and why each variable affects aggregate demand. For easy reference, recall that G is government demand, I is investment demand, T refers to tax revenues, TR is government transfer payments, P$ is the U.S. price level, and P£ is the foreign British price level.
Key Takeaways
- The effect of an increase in investment demand (an increase in government demand, a decrease in taxes, an increase in transfer payments, a decrease in U.S. prices, or an increase in foreign prices) is to raise aggregate demand and shift the DD curve to the right.
- The effect of a decrease in investment demand (a decrease in government demand, an increase in taxes, a decrease in transfer payments, an increase in U.S. prices, or a decrease in foreign prices) is to lower aggregate demand and shift the DD curve to the left.
Exercise
-
Identify whether the DD curve shifts in response to each of the following changes. Indicate whether the curve shifts up, down, left, or right. Possible answers are DD right, DD left, or neither.
- Decrease in government transfer payments.
- Decrease in the foreign price level.
- Increase in foreign interest rates.
- Decrease in the expected exchange rate E$/£e.
- Decrease in U.S. GNP.
- Decrease in the U.S. money supply.