This is “Gathering and Using Information: Marketing Research and Market Intelligence”, chapter 10 from the book Marketing Principles (v. 2.0). For details on it (including licensing), click here.
For more information on the source of this book, or why it is available for free, please see the project's home page. You can browse or download additional books there. To download a .zip file containing this book to use offline, simply click here.


Chapter 10 Gathering and Using Information: Marketing Research and Market Intelligence
Once you have come up with a great idea for an offering, how will you know if people will want to buy it? If they are willing to buy it, what will they want to pay? Will they be willing to pay enough so that you can earn a profit from the product? Wouldn’t it be great if you had some sort of crystal ball that would give you the answers to these questions? After all, you don’t want to quit your day job to develop a product that’s going to be a flop.
In a sense, you do have such a crystal ball. It’s called marketing research. Marketing researchThe process of collecting, analyzing, and reporting marketing information that can be used to improve a company’s bottom line. is the process of collecting, analyzing, and reporting marketing information that can be used to answer questions or solve problems so as to improve a company’s bottom line. Marketing research includes a wide range of activities. (By contrast, market researchThe process of researching a specific market to determine its size and trends. is a narrower activity. It is the process of researching a specific market to determine its size and trends.)
Although marketing research isn’t foolproof, it can take some of the guesswork out of decision making. Back to your great product idea: what, for example, should you name your product? Naming a product might sound like a minor decision, but it’s not. In some cases it can be a deal breaker. Just ask the bug-spray maker Out! International, Inc. In the 1990s, Out! International came up with what it thought was a really cute name for bug spray that would appeal to children. The product was called “Hey! There’s a Monster in My Room!” The problem was that the name itself scared kids. They wanted nothing to do with it.Seth Stern, “The Museum of Food Failures,” Christian Science Monitor, July 2, 2002, http://www.csmonitor.com/2002/0702/p18s03-hfks.html (accessed December 14, 2009).
Figure 10.1

A little marketing research might have helped: In 1966, Capitol Records released hundreds of thousands of the Beatles’ album Yesterday and Today with the cover shown here. Do you think it was well received? No. The public was appalled. Capitol Records quickly realized it had made a mistake, recalled the albums, and pasted a different cover over what became known as the “butcher cover.” (Note: Some of the albums slipped through the cracks and didn’t get the paste-over. If you can find one, it could be worth thousands of dollars.)
Source: Wikipedia.
Marketing research can help you with many tasks:
- Developing product ideas and designs
- Determining if there is demand for your product so you know whether or not to produce it
- Identifying market segments for your product
- Making pricing decisions
- Evaluating packaging types
- Evaluating in-store promotions
- Measuring the satisfaction of your customers
- Measuring the satisfaction of your channel partners
- Evaluating the effectiveness of your Web site
- Testing the effectiveness of ads and their placement
- Making marketing channel decisions
Closely related to marketing research is market intelligence, which is often referred to as competitive intelligence. Whereas marketing research involves solving a specific marketing problem at a specific point in time, market intelligenceInformation gathered on a regular, ongoing basis to enable a firm’s decision makers to stay in touch with what’s happening in the marketplace. involves gathering information on a regular, ongoing basis to stay in touch with what’s happening in the marketplace. For example, if you own a convenience store, part of your daily market intelligence gathering would include driving around to see what competing stores are charging for gasoline or checking to see what types of products are being sold and advertised by them.
If you’re a small business owner, and you’re talking to your customers and suppliers about new product ideas, you’re engaging in market intelligence. If you go so far as to survey your customers with a questionnaire about a new type of service you’re considering offering, you are engaging in marketing research. In big companies, marketing departments are often responsible for gathering market intelligence. But they are by no means the only group to do so. (We’ll discuss more about who in the organization does which activities in a moment.) Students also gather market intelligence when they question other students about the best professors to take classes from.
10.1 Marketing Information Systems
Learning Objectives
- Describe the components of a marketing information system and each component’s purpose.
- Explain the situations in which marketing research should be used versus market intelligence.
- Describe the limitations of market intelligence and its ethical boundaries.
- Explain when marketing research should and should not be used.
A certain amount of marketing information is being gathered all the time by companies as they engage in their daily operations. When a sale is made and recorded, this is marketing information that’s being gathered. When a sales representative records the shipping preferences of a customer in a firm’s customer relationship management (CRM) system, this is also marketing information that’s being collected. When a firm gets a customer complaint and records it, this too is information that should be put to use. All this data can be used to generate consumer insight. However, truly understanding customers involves not just collecting quantitative data (numbers) related to them but qualitative data, such as comments about what they think.
Audio Clip
Interview with Joy Mead
http://app.wistia.com/embed/medias/c89771530aRecall from Chapter 3 "Consumer Behavior: How People Make Buying Decisions" that Joy Mead is an associate director of marketing with Procter & Gamble. Listen to this clip to hear Mead talk about the research techniques and methods Procter & Gamble uses to develop consumer insight. You will learn that the company isn’t just interested in what consumers want now but also years in the future.
The trick is integrating all the information you collect so it can be used by as many people as possible in your organization to make good decisions. Unfortunately, in many organizations, information isn’t shared very well among departments. Even within departments, it can be a problem. For example, one group in a marketing department might research a problem related to a brand, uncover certain findings that would be useful to other brand managers, but never communicate them.
A marketing information system (MIS)A system, either paper or electronic, used to manage information a firm’s marketing professionals and managers need to make good decisions. is a way to manage the vast amount of information firms have on hand—information marketing professionals and managers need to make good decisions. Marketing information systems range from paper-based systems to very sophisticated computer systems. Ideally, however, a marketing information system should include the following components:
- A system for recording internally generated data and reports
- A system for collecting market intelligence on an ongoing basis
- Marketing analytics software to help managers with their decision making
- A system for recording marketing research information
Internally Generated Data and Reports
As we explained, an organization generates and records a lot of information as part of its daily business operations, including sales and accounting data, and data on inventory levels, back orders, customer returns, and complaints. Firms are also constantly gathering information related to their Web sites, such as clickstream data. Clickstream dataData collected from Web sites showing the Web pages visitors clicked on and the order of their clicks. is data generated about the number of people who visit a Web site and its various pages, how long they dwell there, and what they buy or don’t buy. Companies use clickstream data in all kinds of ways. They use it to monitor the overall traffic of visitors that a site gets, to see which areas of the site people aren’t visiting and explore why, and to automatically offer visitors products and promotions by virtue of their browsing patterns. Software can be used to automatically tally the vast amounts of clickstream data gathered from Web sites and generate reports for managers based on that information. Netflix recently awarded a $1 million prize to a group of scientists to plow through Web data generated by millions of Netflix users so as to improve Netflix’s predictions of what users would like to rent.Stephen Baker, “The Web Knows What You Want,” BusinessWeek, July 24, 2009, http://www.businessweek.com/magazine/content/09_30/b4140048486880.htm (accessed December 14, 2009). (That’s an interesting way to conduct marketing research, don’t you think?)
Being able to access clickstream data and other internally generated information quickly can give a company’s decision makers a competitive edge. Remember our discussion in Chapter 9 "Using Supply Chains to Create Value for Customers" about how Walmart got a leg up on Target after 9/11? Walmart’s inventory information was updated by the minute (the retailer’s huge computing center rivals the Pentagon’s, incidentally); Target’s was only updated daily. When Walmart’s managers noticed American flags began selling rapidly immediately following the terrorist attacks on 9/11, the company quickly ordered as many flags as possible from various vendors—leaving none for Target.
Click on the following link to watch a fascinating documentary about how Walmart, the world’s most powerful retailer, operates: http://www.hulu.com/watch/103756/cnbc-originals-the-new-age -of-walmart.
Many companies make a certain amount of internal data available to their employees, managers, vendors, and trusted partners via intranets. An intranetA private, internal Web site accessible only to a firm’s employees. looks like the Web and operates like it, but only an organization’s employees have access to the information. So, for example, instead of a brand manager asking someone in accounting to run a report on the sales of a particular product, the brand manager could look on her firm’s intranet for the information.
However, big companies with multiple products, business units, and databases purchased and installed in different places and at different times often have such vast amounts of information that they can’t post it all on an intranet. Consequently, getting hold of the right information can be hard. The information could be right under your nose and you might not know it. Meet people like Gary Pool: Pool works for BNSF Railway and is one of BNSF’s “go-to” employees when it comes to gathering marketing data. Pool knows how to access different databases and write computer programs to extract the right information from the right places at BNSF, a process known as data miningThe process of extracting information from large databases so as to uncover patterns and trends.. Combining data into one location is called data warehousingA location for combining and storing data., and makes Pool’s analysis easier. He then captures the information and displays it in dashboardsA display of information used by managers to make decisions easier; often dynamic in the sense that a manager can click on the display to probe deeper into the numbers and get more detail., screens on the computer that make the data easily understood so that managers can detect marketing trends. While a dashboard may display a piece of information, such as the number of carloads sold in West Virginia, the manager can click on the number and get more detail.
Figure 10.2

Gary Pool is an expert at data mining—hunting up information for decision makers at BNSF Railway. And no, he doesn’t wear a headlamp. Nor does he wear a pocket protector! Pool’s title: Manager, Marketing Systems Support & Marketing Decision Support & Planning.
Analytics Software
Increasingly, companies are purchasing analytics software to help them pull and make sense of internally generated information. Analytics softwareSoftware that utilizes a firm’s data, regression models, linear programming, and other statistical methods to help managers who are not computer experts make decisions. allows managers who are not computer experts to gather all kinds of different information from a company’s databases—information not produced in reports regularly generated by the company. The software incorporates regression models, linear programming, and other statistical methods to help managers answer “what if” types of questions. For example, “If we spend 10 percent more of our advertising on TV ads instead of magazine ads, what effect will it have on sales?” Oracle Corporation’s Crystal Ball is one brand of analytical software.
The camping, hunting, fishing, and hiking retailer Cabela’s has managed to refine its marketing efforts considerably using analytics software developed by the software maker SAS. “Our statisticians in the past spent 75 percent of their time just trying to manage data. Now they have more time for analyzing the data with SAS, and we have become more flexible in the marketplace,” says Corey Bergstrom, director of marketing research and analysis for Cabela’s. “That is just priceless.”Christina Zarello, “Hunting for Gold in the Great Outdoors,” Retail Information Systems News, May 5, 2009, http://www.risnews.com/ME2/dirmod.asp?sid=&nm=&type=MultiPublishing&mod=PublishingTitles&mid =2E3DABA5396D4649BABC55BEADF2F8FD&tier=4&id =7BC8781137EC46D1A759B336BF50D2B6 (accessed December 14, 2009).
Figure 10.3

Cabela’s’ analytics software has helped the outdoor sporting retailer reach the right customers with the right catalogs.
© Cabela’s Inc., used with permission.
The company uses the software to help analyze sales transactions, market research, and demographic data associated with its large database of customers. It combines the information with Web browsing data to gain a better understanding of the individual customers marketing channel preferences as well as other marketing decisions. For example, does the customer prefer Cabela’s’ one-hundred-page catalogs or the seventeen-hundred-page catalogs? The software has helped Cabela’s employees understand these relationships and make high-impact data-driven marketing decisions.Christina Zarello, “Hunting for Gold in the Great Outdoors,” Retail Information Systems News, May 5, 2009, http://www.risnews.com/ME2/dirmod.asp?sid=&nm=&type=MultiPublishing&mod=PublishingTitles&mid =2E3DABA5396D4649BABC55BEADF2F8FD&tier=4&id =7BC8781137EC46D1A759B336BF50D2B6 (accessed December 14, 2009).
Market Intelligence
A good internal reporting system can tell a manager what happened inside his firm. But what about what’s going on outside the firm? What is the business environment like? Are credit-lending terms loose or tight, and how will they affect what you and your customers are able to buy or not buy? How will rising fuel prices and alternate energy sources affect your firm and your products? Do changes such as these present business obstacles or opportunities? Moreover, what are your competitors up to?
Not gathering market intelligence leaves a company vulnerable. Remember Encyclopedia Britannica, the market leader in print encyclopedia business for literally centuries? Encyclopedia Britannica didn’t see the digital age coming and nearly went out of business as a result. (Suffice it to say, you can now access Encyclopedia Britannica online.) By contrast, when fuel prices hit an all-time high in 2008, unlike other passenger airline companies, Southwest Airlines was prepared. Southwest had anticipated the problem, and early on locked in contracts to buy fuel for its planes at much lower prices. Other airlines weren’t as prepared and lost money because their fuel expenses skyrocketed. Meanwhile, Southwest Airlines managed to eke out a profit. Collecting market intelligence can also help a company generate ideas or product concepts that can then be tested by conducting market research.
Gathering market intelligence involves a number of activities, including scanning newspapers, trade magazines, and economic data produced by the government to find out about trends and what the competition is doing. In big companies, personnel in a firm’s marketing department are primarily responsible for their firm’s market intelligence and making sure it gets conveyed to decision makers. Some companies subscribe to news service companies that regularly provide them with this information. LexisNexis is one such company. It provides companies with news about business and legal developments that could affect their operations. Other companies subscribe to mystery shopping services, companies that shop a client and/or competitors and report on service practices and service performance. Let’s now examine some of the sources of information you can look at to gather market intelligence.
Search Engines and Corporate Web Sites
An obvious way to gain market intelligence is by examining your competitors’ Web sites as well as doing basic searches with search engines like Google. If you want to find out what the press is writing about your company, your competitors, or any other topic you’re interested in, you can sign up to receive free alerts via e-mail by going to Google Alerts at http://www.google.com/alerts. Suppose you want to monitor what people are saying about you or your company on blogs, the comment areas of Web sites, and social networks such as Facebook and Twitter. You can do so by going to a site like WhosTalkin.com, typing a topic or company name into the search bar, and voilà! All the good (and bad) things people have remarked about the company or topic turn up. What a great way to seek out the shortcomings of your competitors. It’s also a good way to spot talent. For example, designers are using search engines like WhosTalkin.com to search the blogs of children and teens who are “fashion forward” and then involve them in designing new products.
WhosTalkin.com and Radian6 (a similar company) also provide companies with sentiment analysis. Sentiment analysisExamining content in social media to determine what a market is thinking or how customers feel, in general, about an offering or an idea. Also used by the government to track the progress of epidemics. is a method of examining content in blogs, tweets, and other online media (other than news media) such as Facebook posts to determine what people are thinking at any given time. Some companies use sentiment analysis to determine how the market is reacting to a new product. The Centers for Disease Control (CDC) uses sentiment analysis to track the progress of flu; as people post or tweet how sick they are, the CDC can determine where the flu is increasing or decreasing.
Figure 10.4

Type a company’s name (or anything else you want) into the search bar and see what comes up. (Note: It takes a little while for all of the results to show up.)
Source: http://www.whostalkin.com.
Publications
The Economist, the Wall Street Journal, Forbes, Fortune, BusinessWeek, the McKinsey Report, Sales and Marketing Management, and the Financial Times are good publications to read to learn about general business trends. All of them discuss current trends, regulations, and consumer issues that are relevant for organizations doing business in the domestic and global marketplace. All of the publications are online as well, although you might have to pay a subscription fee to look at some of the content. If your firm is operating in a global market, you might be interested to know that some of these publications have Asian, European, and Middle Eastern editions.
Other publications provide information about marketplace trends and activities in specific industries. Consumer Goods and Technology provides information consumer packaged-goods firms want to know. Likewise, Progressive Grocer provides information on issues important to grocery stores. Information Week provides information relevant to people and businesses working in the area of technology. World Trade provides information about issues relevant to organizations shipping and receiving goods from other countries. Innovation: America’s Journal of Technology Commercialization provides information about innovative products that are about to hit the marketplace.
Trade Shows and Associations
Trade shows are another way companies learn about what their competitors are doing. (If you are a marketing professional working a trade show for your company, you will want to visit all of your competitors’ booths and see what they have to offer relative to what you have to offer.) And, of course, every field has a trade association that collects and disseminates information about trends, breakthroughs, new technology, new processes, and challenges in that particular industry. The American Marketing Association, Food Marketing Institute, Outdoor Industry Association, Semiconductor Industry Association, Trade Promotion Management Association, and Travel Industry Association provide their member companies with a wealth of information and often deliver them daily updates on industry happenings via e-mail.
Salespeople
A company’s salespeople provide a vital source of market intelligence. Suppose one of your products is selling poorly. Will you initially look to newspapers and magazines to figure out why? Will you consult a trade association? Probably not. You will first want to talk to your firm’s salespeople to get their “take” on the problem.
Salespeople are the eyes and ears of their organizations. Perhaps more than anyone else, they know how products are faring in the marketplace, what the competition is doing, and what customers are looking for.
A system for recording this information is crucial, which explains why so many companies have invested in customer relationship management (CRM) systems. Some companies circulate lists so their employees have a better idea of the market intelligence they might be looking for. Textbook publishers are an example. They let their sales representatives know the types of books they want to publish and encourage their representatives to look for good potential textbook authors among the professors they sell to.
Suppliers and Industry Experts
Your suppliers can provide you with a wealth of information. Good suppliers know which companies are moving a lot of inventory. And oftentimes they have an idea why. In many instances, they will tell you, if the information you’re looking for is general enough so they don’t have to divulge any information that’s confidential or that would be unethical to reveal—an issue we’ll talk more about later in the book. Befriending an expert in your industry, along with business journalists and writers, can be helpful, too. Often these people are “in the know” because they get invited to review products.Jan Gardner, “Competitive Intelligence on a Shoestring,” Inc., September 24, 2001, http://www.inc.com/articles/2001/09/23436.html (accessed December 14, 2009).
Customers
Lastly, when it comes to market intelligence don’t neglect observing how customers are behaving. They can provide many clues, some of which you will be challenged to respond to. For example, during the latest economic downturn, many wholesalers and retailers noticed consumers began buying smaller amounts of goods—just what they needed to get by during the week. Seeing this trend, and realizing that they couldn’t pass along higher costs to customers (because of, say, higher fuel prices), a number of consumer-goods manufacturers “shrank” their products slightly rather than raise prices. You have perhaps noticed that some of the products you buy got smaller—but not cheaper.
Can Market Intelligence Be Taken Too Far?
Can market intelligence be taken too far? The answer is yes. In 2001, Procter & Gamble admitted it had engaged in “dumpster diving” by sifting through a competitors’ garbage to find out about its hair care products. Although the practice isn’t necessarily illegal, it cast P&G in a negative light. Likewise, British Airways received a lot of negative press in the 1990s after it came to light that the company had hacked into Virgin Atlantic Airways’ computer system.“P&G Admits to Dumpster Diving,” PRWatch.org, August 31, 2001, http://www.prwatch.org/node/663 (accessed December 14, 2009).
Gathering corporate information illegally or unethically is referred to as industrial espionageThe process of gathering corporate information illegally or unethically.. Industrial espionage is not uncommon. Sometimes companies hire professional spies to gather information about their competitors and their trade secrets or even bug their phones. Former and current employees can also reveal a company’s trade secret either deliberately or unwittingly. Microsoft recently sued a former employee it believed had divulged trade secrets to its competitors.“Microsoft Suit Alleges Ex-Worker Stole Trade Secrets,” CNET, January 30, 2009, http://news.cnet.com/8301-10805_3-10153616-75.html (accessed December 14, 2009). It’s been reported that for years professional spies bugged Air France’s first-class seats to listen in on executives’ conversations.Jack Anderson, “Bugging Air France First Class,” Ellensburg Daily News, March 25, 1995, 3, http://news.google.com/newspapers?nid=860&dat =19950320&id=ddYPAAAAIBAJ&sjid=F48DAAAAIBAJ&pg=4554,2982160 (accessed December 12, 2009).
Video Clip
Spying at Work—Espionage: Who, How, Why, and How to Stop It
(click to see video)To learn more about the hazards of industrial espionage and how it’s done, check out this YouTube video.
Figure 10.5

Don’t get caught doing this—unless you work for the natural-cosmetics maker Burt’s Bees. To get across to employees the amount of material being wasted, Burt’s Bees had its employees put on hazmat suits and sort through garbage for a couple of weeks. (No, employees weren’t engaging in industrial espionage.) The recycling opportunities they spotted as part of the exercise ended up saving the natural-cosmetics maker $25,000 annually.Judith Nemes, “Dumpster Diving: From Garbage to Gold,” Greenbiz.com, January 16, 2009, http://www.businessgreen.com/bg/analysis/1805796/dumpster-diving-from-garbage-gold (accessed December 14, 2009).
© 2010 Jupiterimages Corporation
To develop standards of conduct and create respect for marketing professionals who gather market intelligence, the Society of Competitive Intelligence Professionals has developed a code of ethics. It is as follows:
- To continually strive to increase the recognition and respect of the profession.
- To comply with all applicable laws, domestic and international.
- To accurately disclose all relevant information, including one’s identity and organization, prior to all interviews.
- To avoid conflicts of interest in fulfilling one’s duties.
- To provide honest and realistic recommendations and conclusions in the execution of one’s duties.
- To promote this code of ethics within one’s company, with third-party contractors and within the entire profession.
- To faithfully adhere to and abide by one’s company policies, objectives and guidelines.“SCIP Code of Ethics for CI Professionals,” Society of Competitive Intelligence Professionals, http://www.scip.org/About/content.cfm?ItemNumber=578&navItemNumber=504 (accessed December 14, 2009).
Marketing Research
Marketing research is what a company has to resort to if it can’t answer a question by using any of the types of information we have discussed so far—market intelligence, internal company data, or analytics software applied to data. As we have explained, marketing research is generally used to answer specific questions. The name you should give your new product is an example. Unless your company has previously done some specific research on product names—what consumers think of them, good or bad—you’re probably not going to find the answer to that question in your internal company data. Also, unlike internal data, which is generated on a regular basis, marketing research is not ongoing. Marketing research is done on an as-needed or project basis. If an organization decides that it needs to conduct marketing research, it can either conduct marketing research itself or hire a marketing research firm to do it.
So when exactly is marketing research needed? Keep in mind marketing research can be expensive. You therefore have to weigh the costs of the research against the benefits. What questions will the research answer, and will knowing the answer result in the firm earning or saving more money than the research costs?
Marketing research can also take time. If a quick decision is needed for a pressing problem, it might not be possible to do the research. Lastly, sometimes the answer is obvious, so there is no point in conducting the research. If one of your competitors comes up with a new offering and consumers are clamoring to get it, you certainly don’t need to undertake a research study to see if such a product would survive in the marketplace.
Alex J. Caffarini, the president and founder of the marketing research firm Analysights, believes there are a number of other reasons companies mistakenly do marketing research. Caffarini’s explanations (shown in parentheses) about why a company’s executives sometimes make bad decisions are somewhat humorous. Read through them:
- “We’ve always done this research.” (The research has taken on a life of its own; this particular project has continued for years and nobody questioned whether it was still relevant.)
- “Everyone’s doing this research.” (Their competitors are doing it, and they’re afraid they’ll lose competitive advantage if they don’t; yet no one asks what value the research is creating.)
- “The findings are nice to know.” (Great—spend a lot of money to create a wealth of useless information. If the information is nice to know, but you can’t do anything with it, you’re wasting money.)
- “If our strategy fails, having done the research will show that we made our best educated guess.” (They’re covering their butts. If things go wrong, they can blame the findings, or the researcher.)
- “We need to study the problem thoroughly before we decide on a course of action.” (They’re afraid of making a tough decision. Conducting marketing research is a good way to delay the inevitable. In the meantime, the problem gets bigger, or the window of opportunity closes.)
- “The research will show that our latest ad campaign was effective.” (They’re using marketing research to justify past decisions. Rarely should marketing research be done after the fact.)Alex J. Caffarini, “Ten Costly Marketing Mistakes and How to Avoid Them,” Analysights, LLC.
Is Marketing Research Always Correct?
To be sure, marketing research can help companies avoid making mistakes. Take Tim Hortons, a popular coffee chain in Canada, which has been expanding in the United States and internationally. Hortons recently opened some self-serve kiosks in Ireland, but the service was a flop. Why? Because cars in Ireland don’t have cup holders. Would marketing research have helped? Probably. So would a little bit of market intelligence. It would have been easy for an observer to see that trying to drive a car and hold a cup of hot coffee at the same time is difficult.
That said, we don’t want to leave you with the idea that marketing research is infallible. As we indicated at the beginning of the chapter, the process isn’t foolproof. In fact, marketing research studies have rejected a lot of good ideas. The idea for telephone answering machines was initially rejected following marketing research. So was the hit sitcom Seinfeld, a show that in 2002 TV Guide named the number-one television program of all time. Even the best companies, like Coca-Cola, have made mistakes in marketing research that have led to huge flops. In the next section of this chapter, we’ll discuss the steps related to conducting marketing research. As you will learn, many things can go wrong along the way that can affect the results of research and the conclusions drawn from it.
Key Takeaway
Many marketing problems and opportunities can be solved by gathering information from a company’s daily operations and analyzing it. Market intelligence involves gathering information on a regular, ongoing basis to stay in touch with what’s happening in the marketplace. Marketing research is what a company has to resort to if it can’t answer a question by using market intelligence, internal company data, or analytical software. Marketing research is not infallible, however.
Review Questions
- Why do companies gather market intelligence and conduct marketing research?
- What activities are part of market intelligence gathering?
- How do marketing professionals know if they have crossed a line in terms of gathering marketing intelligence?
- How does the time frame for conducting marketing intelligence differ from the time frame in which marketing research data is gathered?
We want to hear your feedback
At Flat World Knowledge, we always want to improve our books. Have a comment or suggestion? Send it along! http://bit.ly/wUJmef
10.2 Steps in the Marketing Research Process
Learning Objective
- Describe the basic steps in the marketing research process and the purpose of each step.
The basic steps used to conduct marketing research are shown in Figure 10.6 "Steps in the Marketing Research Process". Next, we discuss each step.
Figure 10.6 Steps in the Marketing Research Process
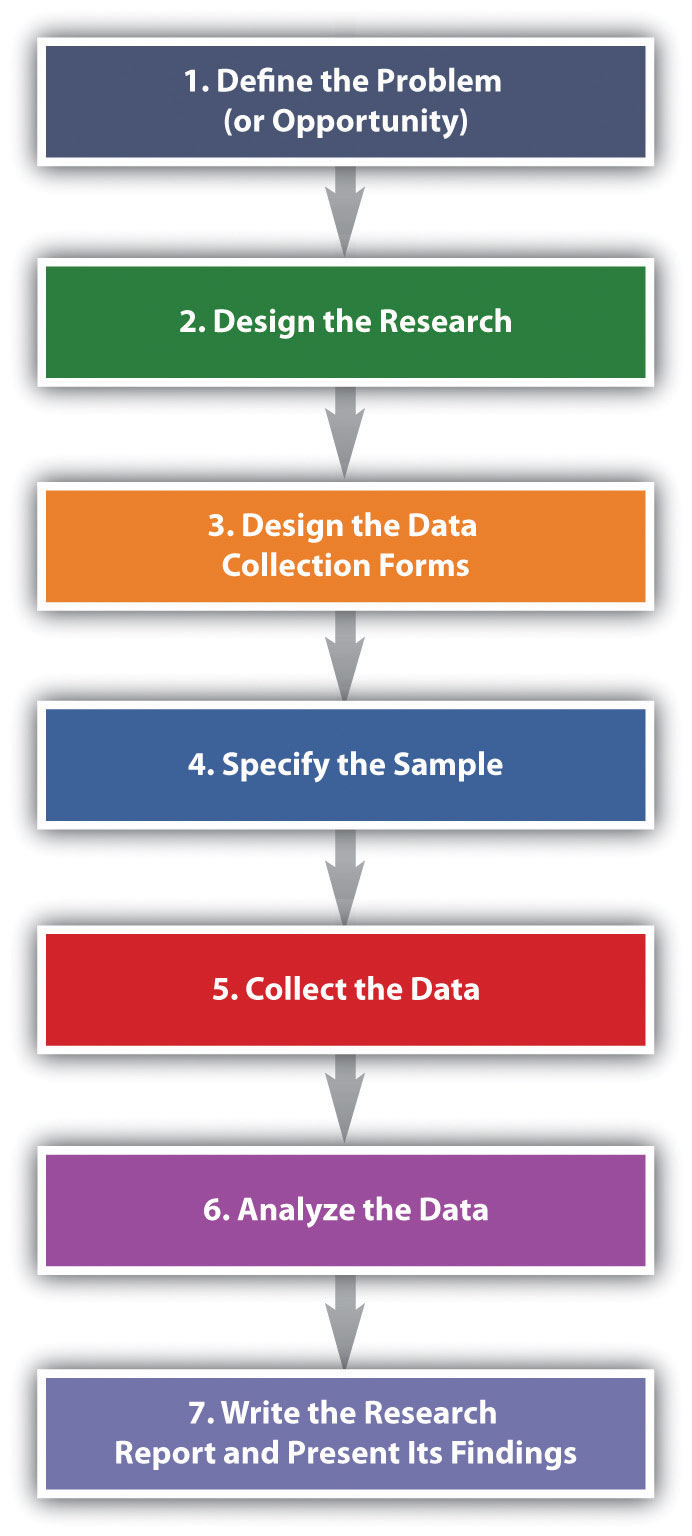
Step 1: Define the Problem (or Opportunity)
There’s a saying in marketing research that a problem half defined is a problem half solved. Defining the “problem” of the research sounds simple, doesn’t it? Suppose your product is tutoring other students in a subject you’re a whiz at. You have been tutoring for a while, and people have begun to realize you’re darned good at it. Then, suddenly, your business drops off. Or it explodes, and you can’t cope with the number of students you’re being asked help. If the business has exploded, should you try to expand your services? Perhaps you should subcontract with some other “whiz” students. You would send them students to be tutored, and they would give you a cut of their pay for each student you referred to them.
Both of these scenarios would be a problem for you, wouldn’t they? They are problems insofar as they cause you headaches. But are they really the problem? Or are they the symptoms of something bigger? For example, maybe your business has dropped off because your school is experiencing financial trouble and has lowered the number of scholarships given to incoming freshmen. Consequently, there are fewer total students on campus who need your services. Conversely, if you’re swamped with people who want you to tutor them, perhaps your school awarded more scholarships than usual, so there are a greater number of students who need your services. Alternately, perhaps you ran an ad in your school’s college newspaper, and that led to the influx of students wanting you to tutor them.
Businesses are in the same boat you are as a tutor. They take a look at symptoms and try to drill down to the potential causes. If you approach a marketing research company with either scenario—either too much or too little business—the firm will seek more information from you such as the following:
- In what semester(s) did your tutoring revenues fall (or rise)?
- In what subject areas did your tutoring revenues fall (or rise)?
- In what sales channels did revenues fall (or rise): Were there fewer (or more) referrals from professors or other students? Did the ad you ran result in fewer (or more) referrals this month than in the past months?
- Among what demographic groups did your revenues fall (or rise)—women or men, people with certain majors, or first-year, second-, third-, or fourth-year students?
The key is to look at all potential causes so as to narrow the parameters of the study to the information you actually need to make a good decision about how to fix your business if revenues have dropped or whether or not to expand it if your revenues have exploded.
The next task for the researcher is to put into writing the research objective. The research objectiveThe goal(s) marketing research is supposed to accomplish. is the goal(s) the research is supposed to accomplish. The marketing research objective for your tutoring business might read as follows:
To survey college professors who teach 100- and 200-level math courses to determine why the number of students referred for tutoring dropped in the second semester.
This is admittedly a simple example designed to help you understand the basic concept. If you take a marketing research course, you will learn that research objectives get a lot more complicated than this. The following is an example:
“To gather information from a sample representative of the U.S. population among those who are ‘very likely’ to purchase an automobile within the next 6 months, which assesses preferences (measured on a 1–5 scale ranging from ‘very likely to buy’ to ‘not likely at all to buy’) for the model diesel at three different price levels. Such data would serve as input into a forecasting model that would forecast unit sales, by geographic regions of the country, for each combination of the model’s different prices and fuel configurations.Alvin Burns and Ronald Bush, Marketing Research, 6th ed. (Upper Saddle River, NJ: Prentice Hall, 2010), 85.”
Now do you understand why defining the problem is complicated and half the battle? Many a marketing research effort is doomed from the start because the problem was improperly defined. Coke’s ill-fated decision to change the formula of Coca-Cola in 1985 is a case in point: Pepsi had been creeping up on Coke in terms of market share over the years as well as running a successful promotional campaign called the “Pepsi Challenge,” in which consumers were encouraged to do a blind taste test to see if they agreed that Pepsi was better. Coke spent four years researching “the problem.” Indeed, people seemed to like the taste of Pepsi better in blind taste tests. Thus, the formula for Coke was changed. But the outcry among the public was so great that the new formula didn’t last long—a matter of months—before the old formula was reinstated. Some marketing experts believe Coke incorrectly defined the problem as “How can we beat Pepsi in taste tests?” instead of “How can we gain market share against Pepsi?”Alvin Burns and Ronald Bush, Marketing Research, 6th ed. (Upper Saddle River, NJ: Prentice Hall, 2010), 87–88.
Video Clip
New Coke Is It! 1985
(click to see video)This video documents the Coca-Cola Company’s ill-fated launch of New Coke in 1985.
Video Clip
1985 Pepsi Commercial—“They Changed My Coke”
(click to see video)This video shows how Pepsi tried to capitalize on the blunder.
Step 2: Design the Research
The next step in the marketing research process is to do a research design. The research designAn outline that specifies the research data to be gathered, from whom, how, and when the data will be analyzed once it has been obtained. is your “plan of attack.” It outlines what data you are going to gather and from whom, how and when you will collect the data, and how you will analyze it once it’s been obtained. Let’s look at the data you’re going to gather first.
There are two basic types of data you can gather. The first is primary data. Primary dataData collected using hands-on tools such as interviews or surveys to answer a question for a specific research project. is information you collect yourself, using hands-on tools such as interviews or surveys, specifically for the research project you’re conducting. Secondary dataData already collected by your firm or another organization for purposes other than the marketing research project at hand. is data that has already been collected by someone else, or data you have already collected for another purpose. Collecting primary data is more time consuming, work intensive, and expensive than collecting secondary data. Consequently, you should always try to collect secondary data first to solve your research problem, if you can. A great deal of research on a wide variety of topics already exists. If this research contains the answer to your question, there is no need for you to replicate it. Why reinvent the wheel?
Sources of Secondary Data
Your company’s internal records are a source of secondary data. So are any data you collect as part of your marketing intelligence gathering efforts. You can also purchase syndicated research. Syndicated researchPrimary data marketing research firms collect on a regular basis and sell to other companies. is primary data that marketing research firms collect on a regular basis and sell to other companies. J.D. Power & Associates is a provider of syndicated research. The company conducts independent, unbiased surveys of customer satisfaction, product quality, and buyer behavior for various industries. The company is best known for its research in the automobile sector. One of the best-known sellers of syndicated research is the Nielsen Company, which produces the Nielsen ratings. The Nielsen ratings measure the size of television, radio, and newspaper audiences in various markets. You have probably read or heard about TV shows that get the highest (Nielsen) ratings. (Arbitron does the same thing for radio ratings.) Nielsen, along with its main competitor, Information Resources, Inc. (IRI), also sells businesses scanner-based researchInformation collected by scanners at checkout stands in stores.. Scanner-based research is information collected by scanners at checkout stands in stores. Each week Nielsen and IRI collect information on the millions of purchases made at stores. The companies then compile the information and sell it to firms in various industries that subscribe to their services. The Nielsen Company has also recently teamed up with Facebook to collect marketing research information. Via Facebook, users will see surveys in some of the spaces in which they used to see online ads.Alan Rappeport and David Gelles, “Facebook to Form Alliance with Nielsen,” Financial Times, September 23, 2009, 16.
By contrast, MarketResearch.com is an example of a marketing research aggregator. A marketing research aggregatorA marketing research company that doesn’t conduct its own research but instead buys it from other marketing research companies and then sells the reports in their entirety or in pieces to other firms. is a marketing research company that doesn’t conduct its own research and sell it. Instead, it buys research reports from other marketing research companies and then sells the reports in their entirety or in pieces to other firms. Check out MarketResearch.com’s Web site. As you will see there are a huge number of studies in every category imaginable that you can buy for relatively small amounts of money.
Figure 10.7
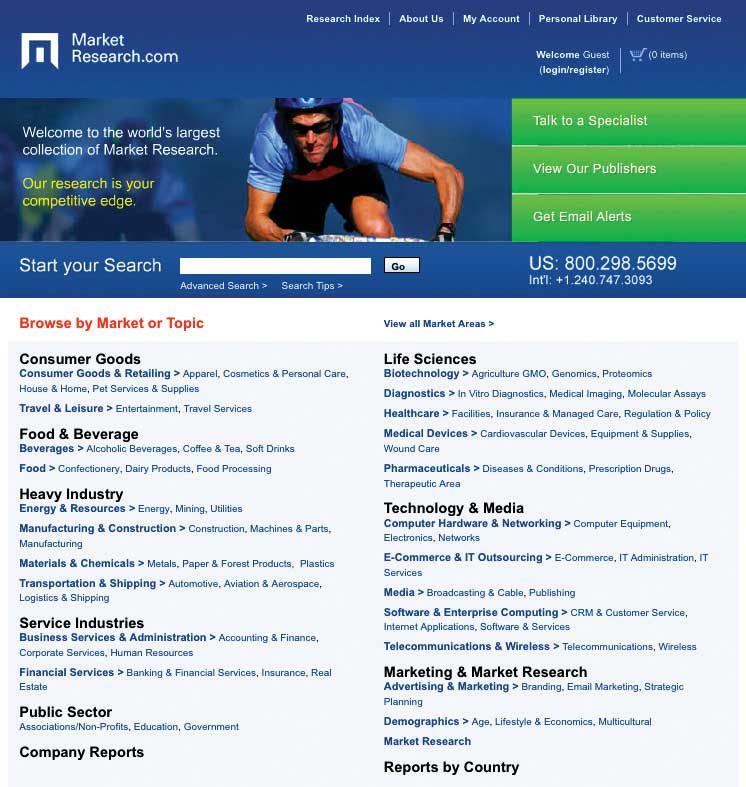
Market research aggregators buy research reports from other marketing research companies and then resell them in part or in whole to other companies so they don’t have to gather primary data.
Source: http://www.marketresearch.com.
Your local library is a good place to gather free secondary data. It has searchable databases as well as handbooks, dictionaries, and books, some of which you can access online. Government agencies also collect and report information on demographics, economic and employment data, health information, and balance-of-trade statistics, among a lot of other information. The U.S. Census Bureau collects census data every ten years to gather information about who lives where. Basic demographic information about sex, age, race, and types of housing in which people live in each U.S. state, metropolitan area, and rural area is gathered so that population shifts can be tracked for various purposes, including determining the number of legislators each state should have in the U.S. House of Representatives. For the U.S. government, this is primary data. For marketing managers it is an important source of secondary data.
The Survey Research Center at the University of Michigan also conducts periodic surveys and publishes information about trends in the United States. One research study the center continually conducts is called the “Changing Lives of American Families” (http://www.isr.umich.edu/home/news/research-update/2007-01.pdf). This is important research data for marketing managers monitoring consumer trends in the marketplace. The World Bank and the United Nations are two international organizations that collect a great deal of information. Their Web sites contain many free research studies and data related to global markets. Table 10.1 "Examples of Primary Data Sources versus Secondary Data Sources" shows some examples of primary versus secondary data sources.
Table 10.1 Examples of Primary Data Sources versus Secondary Data Sources
| Primary Data Sources | Secondary Data Sources |
|---|---|
| Interviews | Census data |
| Surveys | Web sites |
| Publications | |
| Trade associations | |
| Syndicated research and market aggregators |
Gauging the Quality of Secondary Data
When you are gathering secondary information, it’s always good to be a little skeptical of it. Sometimes studies are commissioned to produce the result a client wants to hear—or wants the public to hear. For example, throughout the twentieth century, numerous studies found that smoking was good for people’s health. The problem was the studies were commissioned by the tobacco industry. Web research can also pose certain hazards. There are many biased sites that try to fool people that they are providing good data. Often the data is favorable to the products they are trying to sell. Beware of product reviews as well. Unscrupulous sellers sometimes get online and create bogus ratings for products. See below for questions you can ask to help gauge the credibility of secondary information.
Gauging the Credibility of Secondary Data: Questions to Ask
- Who gathered this information?
- For what purpose?
- What does the person or organization that gathered the information have to gain by doing so?
- Was the information gathered and reported in a systematic manner?
- Is the source of the information accepted as an authority by other experts in the field?
- Does the article provide objective evidence to support the position presented?
Types of Research Design
Now let’s look specifically at the types of research designs that are utilized. By understanding different types of research designs, a researcher can solve a client’s problems more quickly and efficiently without jumping through more hoops than necessary. Research designs fall into one of the following three categories:
- Exploratory research design
- Descriptive research design
- Causal research design (experiments)
An exploratory research designA less-structured type of research design used to initially investigate a marketing research project that hasn’t yet been defined well enough for an in-depth study to be conducted. is useful when you are initially investigating a problem but you haven’t defined it well enough to do an in-depth study of it. Perhaps via your regular market intelligence, you have spotted what appears to be a new opportunity in the marketplace. You would then do exploratory research to investigate it further and “get your feet wet,” as the saying goes. Exploratory research is less structured than other types of research, and secondary data is often utilized.
One form of exploratory research is qualitative research. Qualitative researchAny form of research that results in data that is not quantitative and often seeks to answer questions such as why consumers do something, rather than how much or how often they do it. is any form of research that includes gathering data that is not quantitative, and often involves exploring questions such as why as much as what or how much. Different forms, such as depth interviews and focus group interviews, are common in marketing research.
The depth interviewAn exploratory research technique of engaging in detailed, one-on-one, question-and-answer sessions with potential buyers.—engaging in detailed, one-on-one, question-and-answer sessions with potential buyers—is an exploratory research technique. However, unlike surveys, the people being interviewed aren’t asked a series of standard questions. Instead the interviewer is armed with some general topics and asks questions that are open ended, meaning that they allow the interviewee to elaborate. “How did you feel about the product after you purchased it?” is an example of a question that might be asked. A depth interview also allows a researcher to ask logical follow-up questions such as “Can you tell me what you mean when you say you felt uncomfortable using the service?” or “Can you give me some examples?” to help dig further and shed additional light on the research problem. Depth interviews can be conducted in person or over the phone. The interviewer either takes notes or records the interview.
Focus groups and case studies are often utilized for exploratory research as well. A focus groupA group of potential buyers brought together to discuss a marketing research topic with one another. is a group of potential buyers who are brought together to discuss a marketing research topic with one another. A moderator is used to focus the discussion, the sessions are recorded, and the main points of consensus are later summarized by the market researcher. Textbook publishers often gather groups of professors at educational conferences to participate in focus groups. However, focus groups can also be conducted on the telephone, in online chat rooms, or both, using meeting software like WebEx. The basic steps of conducting a focus group are outlined below.
The Basic Steps of Conducting a Focus Group
- Establish the objectives of the focus group. What is its purpose?
- Identify the people who will participate in the focus group. What makes them qualified to participate? How many of them will you need and what they will be paid?
- Obtain contact information for the participants and send out invitations (usually e-mails are most efficient).
- Develop a list of questions.
- Choose a facilitator.
- Choose a location in which to hold the focus group and the method by which it will be recorded.
- Conduct the focus group. If the focus group is not conducted electronically, include name tags for the participants, pens and notepads, any materials the participants need to see, and refreshments. Record participants’ responses.
- Summarize the notes from the focus group and write a report for management.
A case studyA study that looks at how another company, or companies, solved a problem being researched. looks at how another company solved the problem that’s being researched. Sometimes multiple cases, or companies, are used in a study. Case studies nonetheless have a mixed reputation. Some researchers believe it’s hard to generalize, or apply, the results of a case study to other companies. Nonetheless, collecting information about companies that encountered the same problems your firm is facing can give you a certain amount of insight about what direction you should take. In fact, one way to begin a research project is to carefully study a successful product or service.
Two other types of qualitative data used for exploratory research are ethnographies and projective techniques. In an ethnographyA type of study whereby marketing researchers interview, observe, and often videotape people while they work, live, shop, and play., researchers interview, observe, and often videotape people while they work, live, shop, and play. The Walt Disney Company has recently begun using ethnographers to uncover the likes and dislikes of boys aged six to fourteen, a financially attractive market segment for Disney, but one in which the company has been losing market share. The ethnographers visit the homes of boys, observe the things they have in their rooms to get a sense of their hobbies, and accompany them and their mothers when they shop to see where they go, what the boys are interested in, and what they ultimately buy. (The children get seventy-five dollars out of the deal, incidentally.)Brook Barnes, “Disney Expert Uses Science to Draw Boy Viewers,” New York Times, April 15, 2009, http://www.nytimes.com/2009/04/14/arts/television/14boys.html?pagewanted=1&_r=1 (accessed December 14, 2009).
Projective techniquesAn exploratory research technique used to reveal information research respondents might not reveal by being asked directly. are used to reveal information research respondents might not reveal by being asked directly. Asking a person to complete sentences such as the following is one technique:
People who buy Coach handbags __________.
(Will he or she reply with “are cool,” “are affluent,” or “are pretentious,” for example?)
KFC’s grilled chicken is ______.
Or the person might be asked to finish a story that presents a certain scenario. Word associations are also used to discern people’s underlying attitudes toward goods and services. Using a word-association technique, a market researcher asks a person to say or write the first word that comes to his or her mind in response to another word. If the initial word is “fast food,” what word does the person associate it with or respond with? Is it “McDonald’s”? If many people reply that way, and you’re conducting research for Burger King, that could indicate Burger King has a problem. However, if the research is being conducted for Wendy’s, which recently began running an advertising campaign to the effect that Wendy’s offerings are “better than fast food,” it could indicate that the campaign is working.
Completing cartoons is yet another type of projective technique. It’s similar to finishing a sentence or story, only with the pictures. People are asked to look at a cartoon such as the one shown in Figure 10.8 "Example of a Cartoon-Completion Projective Technique". One of the characters in the picture will have made a statement, and the person is asked to fill in the empty cartoon “bubble” with how they think the second character will respond.
Figure 10.8 Example of a Cartoon-Completion Projective Technique

In some cases, your research might end with exploratory research. Perhaps you have discovered your organization lacks the resources needed to produce the product. In other cases, you might decide you need more in-depth, quantitative research such as descriptive research or causal research, which are discussed next. Most marketing research professionals advise using both types of research, if it’s feasible. On the one hand, the qualitative-type research used in exploratory research is often considered too “lightweight.” Remember earlier in the chapter when we discussed telephone answering machines and the hit TV sitcom Seinfeld? Both product ideas were initially rejected by focus groups. On the other hand, relying solely on quantitative information often results in market research that lacks ideas.
Video Clip
The Stone Wheel—What One Focus Group Said
(click to see video)Watch the video to see a funny spoof on the usefulness—or lack of usefulness—of focus groups.
Descriptive Research
Anything that can be observed and counted falls into the category of descriptive research design. A study using a descriptive research designA study that involves gathering hard numbers, often via surveys, to describe or measure a phenomenon so as to answer the questions of who, what, where, when, and how. involves gathering hard numbers, often via surveys, to describe or measure a phenomenon so as to answer the questions of who, what, where, when, and how. “On a scale of 1–5, how satisfied were you with your service?” is a question that illustrates the information a descriptive research design is supposed to capture.
Physiological measurements also fall into the category of descriptive design. Physiological measurementsMeasurements that record people’s involuntary physical responses to marketing stimuli, such as an advertisement. measure people’s involuntary physical responses to marketing stimuli, such as an advertisement. Elsewhere, we explained that researchers have gone so far as to scan the brains of consumers to see what they really think about products versus what they say about them. Eye tracking is another cutting-edge type of physiological measurement. It involves recording the movements of a person’s eyes when they look at some sort of stimulus, such as a banner ad or a Web page. The Walt Disney Company has a research facility in Austin, Texas, that it uses to take physical measurements of viewers when they see Disney programs and advertisements. The facility measures three types of responses: people’s heart rates, skin changes, and eye movements (eye tracking).Todd Spangler, “Disney Lab Tracks Feelings,” Multichannel News 30, no. 30 (August 3, 2009): 26.
Figure 10.9
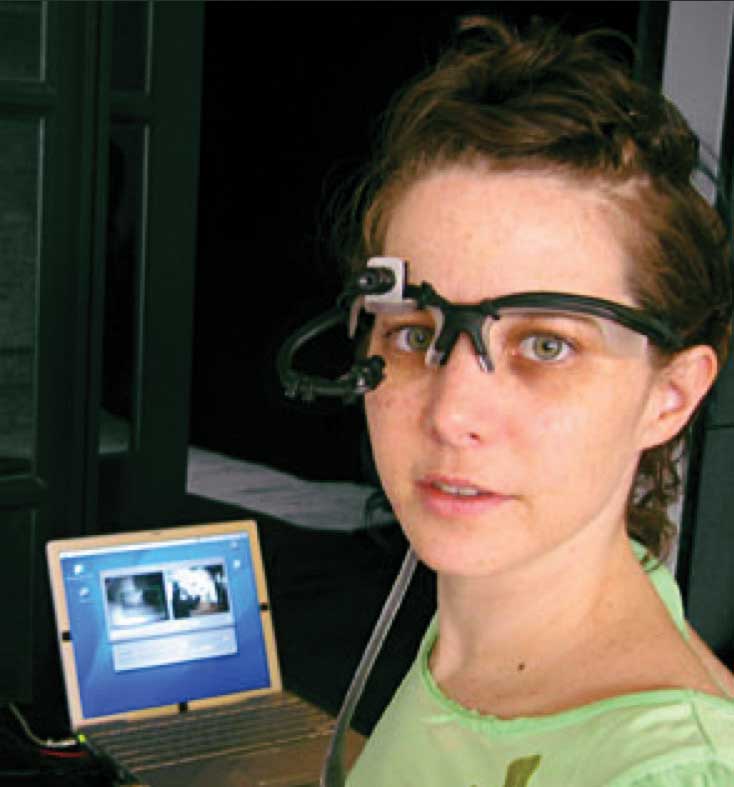
A woman shows off her headgear for an eye-tracking study. The gear’s not exactly a fashion statement but . . .
A strictly descriptive research design instrument—a survey, for example—can tell you how satisfied your customers are. It can’t, however, tell you why. Nor can an eye-tracking study tell you why people’s eyes tend to dwell on certain types of banner ads—only that they do. To answer “why” questions an exploratory research design or causal research design is needed.James Wagner, “Marketing in Second Life Doesn’t Work…Here Is Why!” GigaOM, April 4, 2007, http://gigaom.com/2007/04/04/3-reasons-why-marketing-in-second-life-doesnt-work (accessed December 14, 2009).
Causal Research
Causal research designA type of research design that examines cause-and-effect relationships to allow researchers to answer “what if” types of questions. examines cause-and-effect relationships. Using a causal research design allows researchers to answer “what if” types of questions. In other words, if a firm changes X (say, a product’s price, design, placement, or advertising), what will happen to Y (say, sales or customer loyalty)? To conduct causal research, the researcher designs an experiment that “controls,” or holds constant, all of a product’s marketing elements except one (or using advanced techniques of research, a few elements can be studied at the same time). The one variable is changed, and the effect is then measured. Sometimes the experiments are conducted in a laboratory using a simulated setting designed to replicate the conditions buyers would experience. Or the experiments may be conducted in a virtual computer setting.
You might think setting up an experiment in a virtual world such as the online game Second Life would be a viable way to conduct controlled marketing research. Some companies have tried to use Second Life for this purpose, but the results have been somewhat mixed as to whether or not it is a good medium for marketing research. The German marketing research firm Komjuniti was one of the first “real-world” companies to set up an “island” in Second Life upon which it could conduct marketing research. However, with so many other attractive fantasy islands in which to play, the company found it difficult to get Second Life residents, or players, to voluntarily visit the island and stay long enough so meaningful research could be conducted. (Plus, the “residents,” or players, in Second Life have been known to protest corporations invading their world. When the German firm Komjuniti created an island in Second Life to conduct marketing research, the residents showed up waving signs and threatening to boycott the island.)James Wagner, “Marketing in Second Life Doesn’t Work…Here Is Why!” GigaOM, April 4, 2007, http://gigaom.com/2007/04/04/3-reasons-why-marketing-in-second-life-doesnt-work/ (accessed December 14, 2009).
Why is being able to control the setting so important? Let’s say you are an American flag manufacturer and you are working with Walmart to conduct an experiment to see where in its stores American flags should be placed so as to increase their sales. Then the terrorist attacks of 9/11 occur. In the days afterward, sales skyrocketed—people bought flags no matter where they were displayed. Obviously, the terrorist attacks in the United States would have skewed the experiment’s data.
An experiment conducted in a natural setting such as a store is referred to as a field experimentA marketing research experiment conducted in a natural setting such as a store versus a simulated setting in a laboratory or on a computer.. Companies sometimes do field experiments either because it is more convenient or because they want to see if buyers will behave the same way in the “real world” as in a laboratory or on a computer. The place the experiment is conducted or the demographic group of people the experiment is administered to is considered the test marketThe place an experiment is conducted or the demographic group of people an experiment is administered to.. Before a large company rolls out a product to the entire marketplace, it will often place the offering in a test market to see how well it will be received. For example, to compete with MillerCoors’ sixty-four-calorie beer MGD 64, Anheuser-Busch recently began testing its Select 55 beer in certain cities around the country.Jeremiah McWilliams, “A-B Puts Super-Low-Calorie Beer in Ring with Miller,” St. Louis Post-Dispatch, August 16, 2009, http://www.stltoday.com/business/next-matchup-light-weights-a-b-puts-super-low-calorie/article_47511bfe-18ca-5979-bdb9-0526c97d4edf.html (accessed April 13, 2012).
Figure 10.10

Select 55 beer: Coming soon to a test market near you? (If you’re on a diet, you have to hope so!)
© 2010 Jupiterimages Corporation
Many companies use experiments to test all of their marketing communications. For example, the online discount retailer O.co (formerly called Overstock.com) carefully tests all of its marketing offers and tracks the results of each one. One study the company conducted combined twenty-six different variables related to offers e-mailed to several thousand customers. The study resulted in a decision to send a group of e-mails to different segments. The company then tracked the results of the sales generated to see if they were in line with the earlier experiment it had conducted that led it to make the offer.
Step 3: Design the Data-Collection Forms
If the behavior of buyers is being formally observed, and a number of different researchers are conducting observations, the data obviously need to be recorded on a standardized data-collection form that’s either paper or electronic. Otherwise, the data collected will not be comparable. The items on the form could include a shopper’s sex; his or her approximate age; whether the person seemed hurried, moderately hurried, or unhurried; and whether or not he or she read the label on products, used coupons, and so forth.
The same is true when it comes to surveying people with questionnaires. Surveying people is one of the most commonly used techniques to collect quantitative data. Surveys are popular because they can be easily administered to large numbers of people fairly quickly. However, to produce the best results, the questionnaire for the survey needs to be carefully designed.
Questionnaire Design
Most questionnaires follow a similar format: They begin with an introduction describing what the study is for, followed by instructions for completing the questionnaire and, if necessary, returning it to the market researcher. The first few questions that appear on the questionnaire are usually basic, warm-up type of questions the respondent can readily answer, such as the respondent’s age, level of education, place of residence, and so forth. The warm-up questions are then followed by a logical progression of more detailed, in-depth questions that get to the heart of the question being researched. Lastly, the questionnaire wraps up with a statement that thanks the respondent for participating in the survey and information and explains when and how they will be paid for participating. To see some examples of questionnaires and how they are laid out, click on the following link: http://cas.uah.edu/wrenb/mkt343/Project/Sample%20Questionnaires.htm.
How the questions themselves are worded is extremely important. It’s human nature for respondents to want to provide the “correct” answers to the person administering the survey, so as to seem agreeable. Therefore, there is always a hazard that people will try to tell you what you want to hear on a survey. Consequently, care needs to be taken that the survey questions are written in an unbiased, neutral way. In other words, they shouldn’t lead a person taking the questionnaire to answer a question one way or another by virtue of the way you have worded it. The following is an example of a leading question.
Don’t you agree that teachers should be paid more?
The questions also need to be clear and unambiguous. Consider the following question:
Which brand of toothpaste do you use?
The question sounds clear enough, but is it really? What if the respondent recently switched brands? What if she uses Crest at home, but while away from home or traveling, she uses Colgate’s Wisp portable toothpaste-and-brush product? How will the respondent answer the question? Rewording the question as follows so it’s more specific will help make the question clearer:
Which brand of toothpaste have you used at home in the past six months? If you have used more than one brand, please list each of them.“Questionnaire Design,” QuickMBA, http://www.quickmba.com/marketing/research/qdesign (accessed December 14, 2009).
Sensitive questions have to be asked carefully. For example, asking a respondent, “Do you consider yourself a light, moderate, or heavy drinker?” can be tricky. Few people want to admit to being heavy drinkers. You can “soften” the question by including a range of answers, as the following example shows:
How many alcoholic beverages do you consume in a week?
- __0–5 alcoholic beverages
- __5–10 alcoholic beverages
- __10–15 alcoholic beverages
Many people don’t like to answer questions about their income levels. Asking them to specify income ranges rather than divulge their actual incomes can help.
Other research question “don’ts” include using jargon and acronyms that could confuse people. “How often do you IM?” is an example. Also, don’t muddy the waters by asking two questions in the same question, something researchers refer to as a double-barreled questionA survey question that is potentially confusing because it asks two questions in the same question.. “Do you think parents should spend more time with their children and/or their teachers?” is an example of a double-barreled question.
Open-ended questionsQuestions that ask respondents to elaborate upon, or explain, their answers., or questions that ask respondents to elaborate, can be included. However, they are harder to tabulate than closed-ended questionsQuestions that limit a respondent’s answers. Multiple-choice and yes-and-no questions are examples of closed-ended questions., or questions that limit a respondent’s answers. Multiple-choice and yes-and-no questions are examples of closed-ended questions.
Testing the Questionnaire
You have probably heard the phrase “garbage in, garbage out.” If the questions are bad, the information gathered will be bad, too. One way to make sure you don’t end up with garbage is to test the questionnaire before sending it out to find out if there are any problems with it. Is there enough space for people to elaborate on open-ended questions? Is the font readable? To test the questionnaire, marketing research professionals first administer it to a number of respondents face to face. This gives the respondents the chance to ask the researcher about questions or instructions that are unclear or don’t make sense to them. The researcher then administers the questionnaire to a small subset of respondents in the actual way the survey is going to be disseminated, whether it’s delivered via phone, in person, by mail, or online.
Getting people to participate and complete questionnaires can be difficult. If the questionnaire is too long or hard to read, many people won’t complete it. So, by all means, eliminate any questions that aren’t necessary. Of course, including some sort of monetary incentive for completing the survey can increase the number of completed questionnaires a market researcher will receive.
Step 4: Specify the Sample
Once you have created your questionnaire or other marketing study, how do you figure out who should participate in it? Obviously, you can’t survey or observe all potential buyers in the marketplace. Instead, you must choose a sample. A sampleA small amount of a product given to consumers to try for free. is a subset of potential buyers that are representative of your entire target market, or populationThe entire target market being studied. being studied. Sometimes market researchers refer to the population as the universe to reflect the fact that it includes the entire target market, whether it consists of a million people, a hundred thousand, a few hundred, or a dozen. “All unmarried people over the age of eighteen who purchased Dirt Devil steam cleaners in the United States during 2011” is an example of a population that has been defined.
Obviously, the population has to be defined correctly. Otherwise, you will be studying the wrong group of people. Not defining the population correctly can result in flawed research, or sampling error. A sampling errorAny type of marketing research mistake that results because a sample was utilized. is any type of marketing research mistake that results because a sample was utilized. One criticism of Internet surveys is that the people who take these surveys don’t really represent the overall population. On average, Internet survey takers tend to be more educated and tech savvy. Consequently, if they solely constitute your population, even if you screen them for certain criteria, the data you collect could end up being skewed.
The next step is to put together the sampling frameThe list from which a research sample is drawn. The sampling frame won’t perfectly match the population., which is the list from which the sample is drawn. The sampling frame can be put together using a directory, customer list, or membership roster.Bruce Wrenn, Robert E. Stevens, and David L. Loudon, Marketing Research: Text and Cases, 2nd ed. (Binghamton, NY: Haworth Press, 2007), 180. Keep in mind that the sampling frame won’t perfectly match the population. Some people will be included on the list who shouldn’t be. Other people who should be included will be inadvertently omitted. It’s no different than if you were to conduct a survey of, say, 25 percent of your friends, using friends’ names you have in your cell phone. Most of your friends’ names are likely to be programmed into your phone, but not all of them. As a result, a certain degree of sampling error always occurs.
There are two main categories of samples in terms of how they are drawn: probability samples and nonprobability samples. A probability sampleA research sample in which each would-be participant has a known and equal chance of being selected. is one in which each would-be participant has a known and equal chance of being selected. The chance is known because the total number of people in the sampling frame is known. For example, if every other person from the sampling frame were chosen, each person would have a 50 percent chance of being selected.
A nonprobability sampleA research sample that’s not drawn in a systematic way. is any type of sample that’s not drawn in a systematic way. So the chances of each would-be participant being selected can’t be known. A convenience sampleType of nonprobability sample that’s drawn because it’s readily available and convenient to do so. is one type of nonprobability sample. It is a sample a researcher draws because it’s readily available and convenient to do so. Surveying people on the street as they pass by is an example of a convenience sample. The question is, are these people representative of the target market?
For example, suppose a grocery store needed to quickly conduct some research on shoppers to get ready for an upcoming promotion. Now suppose that the researcher assigned to the project showed up between the hours of 10 a.m. and 12 p.m. on a weekday and surveyed as many shoppers as possible. The problem is that the shoppers wouldn’t be representative of the store’s entire target market. What about commuters who stop at the store before and after work? Their views wouldn’t be represented. Neither would people who work the night shift or shop at odd hours. As a result, there would be a lot of room for sampling error in this study. For this reason, studies that use nonprobability samples aren’t considered as accurate as studies that use probability samples. Nonprobability samples are more often used in exploratory research.
Lastly, the size of the sample has an effect on the amount of sampling error. Larger samples generally produce more accurate results. The larger your sample is, the more data you will have, which will give you a more complete picture of what you’re studying. However, the more people surveyed or studied, the more costly the research becomes.
Statistics can be used to determine a sample’s optimal size. If you take a marketing research or statistics class, you will learn more about how to determine the optimal size.
Of course, if you hire a marketing research company, much of this work will be taken care of for you. Many marketing research companies, like ResearchNow, maintain panels of prescreened people they draw upon for samples. In addition, the marketing research firm will be responsible for collecting the data or contracting with a company that specializes in data collection. Data collection is discussed next.
Step 5: Collect the Data
As we have explained, primary marketing research data can be gathered in a number of ways. Surveys, taking physical measurements, and observing people are just three of the ways we discussed. If you’re observing customers as part of gathering the data, keep in mind that if shoppers are aware of the fact, it can have an effect on their behavior. For example, if a customer shopping for feminine hygiene products in a supermarket aisle realizes she is being watched, she could become embarrassed and leave the aisle, which would adversely affect your data. To get around problems such as these, some companies set up cameras or two-way mirrors to observe customers. Organizations also hire mystery shoppers to work around the problem. A mystery shopperA person who is paid to shop at a firm’s establishment or one of its competitors’ to observe the level of service, cleanliness of the facility, and so forth, and report his or her findings to the firm. is someone who is paid to shop at a firm’s establishment or one of its competitors to observe the level of service, cleanliness of the facility, and so forth, and report his or her findings to the firm.
Video Clip
Make Extra Money as a Mystery Shopper
(click to see video)Watch the YouTube video to get an idea of how mystery shopping works.
Survey data can be collected in many different ways and combinations of ways. The following are the basic methods used:
- Face-to-face (can be computer aided)
- Telephone (can be computer aided or completely automated)
- Mail and hand delivery
- E-mail and the Web
A face-to-face survey is, of course, administered by a person. The surveys are conducted in public places such as in shopping malls, on the street, or in people’s homes if they have agreed to it. In years past, it was common for researchers in the United States to knock on people’s doors to gather survey data. However, randomly collected door-to-door interviews are less common today, partly because people are afraid of crime and are reluctant to give information to strangers.Carl D. McDaniel and Roger H. Gates, Marketing Research Essentials, 2nd ed. (Cincinnati: South-Western College Publishing, 1998), 61.
Nonetheless, “beating the streets” is still a legitimate way questionnaire data is collected. When the U.S. Census Bureau collects data on the nation’s population, it hand delivers questionnaires to rural households that do not have street-name and house-number addresses. And Census Bureau workers personally survey the homeless to collect information about their numbers. Face-to-face surveys are also commonly used in third world countries to collect information from people who cannot read or lack phones and computers.
A plus of face-to-face surveys is that they allow researchers to ask lengthier, more complex questions because the people being surveyed can see and read the questionnaires. The same is true when a computer is utilized. For example, the researcher might ask the respondent to look at a list of ten retail stores and rank the stores from best to worst. The same question wouldn’t work so well over the telephone because the person couldn’t see the list. The question would have to be rewritten. Another drawback with telephone surveys is that even though federal and state “do not call” laws generally don’t prohibit companies from gathering survey information over the phone, people often screen such calls using answering machines and caller ID.
Probably the biggest drawback of both surveys conducted face-to-face and administered over the phone by a person is that they are labor intensive and therefore costly. Mailing out questionnaires is costly, too, and the response rates can be rather low. Think about why that might be so: if you receive a questionnaire in the mail, it is easy to throw it in the trash; it’s harder to tell a market researcher who approaches you on the street that you don’t want to be interviewed.
By contrast, gathering survey data collected by a computer, either over the telephone or on the Internet, can be very cost-effective and in some cases free. SurveyMonkey and Zoomerang are two Web sites that will allow you to create online questionnaires, e-mail them to up to one hundred people for free, and view the responses in real time as they come in. For larger surveys, you have to pay a subscription price of a few hundred dollars. But that still can be extremely cost-effective. The two Web sites also have a host of other features such as online-survey templates you can use to create your questionnaire, a way to set up automatic reminders sent to people who haven’t yet completed their surveys, and tools you can use to create graphics to put in your final research report. To see how easy it is to put together a survey in SurveyMonkey, click on the following link: http://help.surveymonkey.com/app/tutorials/detail/a_id/423.
Like a face-to-face survey, an Internet survey can enable you to show buyers different visuals such as ads, pictures, and videos of products and their packaging. Web surveys are also fast, which is a major plus. Whereas face-to-face and mailed surveys often take weeks to collect, you can conduct a Web survey in a matter of days or even hours. And, of course, because the information is electronically gathered it can be automatically tabulated. You can also potentially reach a broader geographic group than you could if you had to personally interview people. The Zoomerang Web site allows you to create surveys in forty different languages.
Another plus for Web and computer surveys (and electronic phone surveys) is that there is less room for human error because the surveys are administered electronically. For instance, there’s no risk that the interviewer will ask a question wrong or use a tone of voice that could mislead the respondents. Respondents are also likely to feel more comfortable inputting the information into a computer if a question is sensitive than they would divulging the information to another person face-to-face or over the phone. Given all of these advantages, it’s not surprising that the Internet is quickly becoming the top way to collect primary data. However, like mail surveys, surveys sent to people over the Internet are easy to ignore.
Lastly, before the data collection process begins, the surveyors and observers need to be trained to look for the same things, ask questions the same way, and so forth. If they are using rankings or rating scales, they need to be “on the same page,” so to speak, as to what constitutes a high ranking or a low ranking. As an analogy, you have probably had some teachers grade your college papers harder than others. The goal of training is to avoid a wide disparity between how different observers and interviewers record the data.
Figure 10.11

Training people so they know what constitutes different ratings when they are collecting data will improve the quality of the information gathered in a marketing research study.
© 2010 Jupiterimages Corporation
For example, if an observation form asks the observers to describe whether a shopper’s behavior is hurried, moderately hurried, or unhurried, they should be given an idea of what defines each rating. Does it depend on how much time the person spends in the store or in the individual aisles? How fast they walk? In other words, the criteria and ratings need to be spelled out.
Collecting International Marketing Research Data
Gathering marketing research data in foreign countries poses special challenges. However, that doesn’t stop firms from doing so. Marketing research companies are located all across the globe, in fact. Eight of the ten largest marketing research companies in the world are headquartered in the United States. However, five of these eight firms earn more of their revenues abroad than they do in the United States. There’s a reason for this: many U.S. markets were saturated, or tapped out, long ago in terms of the amount that they can grow. Coke is an example. As you learned earlier in the book, most of the Coca-Cola Company’s revenues are earned in markets abroad. To be sure, the United States is still a huge market when it comes to the revenues marketing research firms generate by conducting research in the country: in terms of their spending, American consumers fuel the world’s economic engine. Still, emerging countries with growing middle classes, such as China, India, and Brazil, are hot new markets companies want to tap.
What kind of challenges do firms face when trying to conduct marketing research abroad? As we explained, face-to-face surveys are commonly used in third world countries to collect information from people who cannot read or lack phones and computers. However, face-to-face surveys are also common in Europe, despite the fact that phones and computers are readily available. In-home surveys are also common in parts of Europe. By contrast, in some countries, including many Asian countries, it’s considered taboo or rude to try to gather information from strangers either face-to-face or over the phone. In many Muslim countries, women are forbidden to talk to strangers.
And how do you figure out whom to research in foreign countries? That in itself is a problem. In the United States, researchers often ask if they can talk to the heads of households to conduct marketing research. But in countries in which domestic servants or employees are common, the heads of households aren’t necessarily the principal shoppers; their domestic employees are.Naresh Malhotra, Marketing Research: An Applied Approach, 6th ed. (Upper Saddle River, NJ: Prentice Hall), 764.
Translating surveys is also an issue. Have you ever watched the TV comedians Jay Leno and David Letterman make fun of the English translations found on ethnic menus and products? Research tools such as surveys can suffer from the same problem. Hiring someone who is bilingual to translate a survey into another language can be a disaster if the person isn’t a native speaker of the language to which the survey is being translated.
One way companies try to deal with translation problems is by using back translation. When back translationA process whereby a native speaker translates a research instrument such as a survey into a foreign language and then back again to the original language to determine if there are gaps in meaning. is used, a native speaker translates the survey into the foreign language and then translates it back again to the original language to determine if there were gaps in meaning—that is, if anything was lost in translation. And it’s not just the language that’s an issue. If the research involves any visual images, they, too, could be a point of confusion. Certain colors, shapes, and symbols can have negative connotations in other countries. For example, the color white represents purity in many Western cultures, but in China, it is the color of death and mourning.Malika Zouhali-Worrall, “Found in Translation: Avoiding Multilingual Gaffes,” CNNMoney.com, July 14, 2008, http://money.cnn.com/2008/07/07/smallbusiness/language_translation.fsb/index.htm (accessed December 14, 2009). Also, look back at the cartoon-completion exercise in Figure 10.8 "Example of a Cartoon-Completion Projective Technique". What would women in Muslim countries who aren’t allowed to converse with male sellers think of it? Chances are, the cartoon wouldn’t provide you with the information you’re seeking if Muslim women in some countries were asked to complete it.
One way marketing research companies are dealing with the complexities of global research is by merging with or acquiring marketing research companies abroad. The Nielsen Company is the largest marketing research company in the world. The firm operates in more than a hundred countries and employs more than forty thousand people. Many of its expansions have been the result of acquisitions and mergers.
Step 6: Analyze the Data
Step 6 involves analyzing the data to ensure it’s as accurate as possible. If the research is collected by hand using a pen and pencil, it’s entered into a computer. Or respondents might have already entered the information directly into a computer. For example, when Toyota goes to an event such as a car show, the automaker’s marketing personnel ask would-be buyers to complete questionnaires directly on computers. Companies are also beginning to experiment with software that can be used to collect data using mobile phones.
Once all the data is collected, the researchers begin the data cleaningThe process of removing research data that have accidentally been duplicated (entered twice into the computer) or correcting data that have obviously been recorded wrong., which is the process of removing data that have accidentally been duplicated (entered twice into the computer) or correcting data that have obviously been recorded wrong. A program such as Microsoft Excel or a statistical program such as Predictive Analytics Software (PASW, which was formerly known as SPSS) is then used to tabulate, or calculate, the basic results of the research, such as the total number of participants and how collectively they answered various questions. The programs can also be used to calculate averages, such as the average age of respondents, their average satisfaction, and so forth. The same can done for percentages, and other values you learned about, or will learn about, in a statistics course, such as the standard deviation, mean, and median for each question.
The information generated by the programs can be used to draw conclusions, such as what all customers might like or not like about an offering based on what the sample group liked or did not like. The information can also be used to spot differences among groups of people. For example, the research might show that people in one area of the country like the product better than people in another area. Trends to predict what might happen in the future can also be spotted.
If there are any open-ended questions respondents have elaborated upon—for example, “Explain why you like the current brand you use better than any other brand”—the answers to each are pasted together, one on top of another, so researchers can compare and summarize the information. As we have explained, qualitative information such as this can give you a fuller picture of the results of the research.
Part of analyzing the data is to see if it seems sound. Does the way in which the research was conducted seem sound? Was the sample size large enough? Are the conclusions that become apparent from it reasonable?
The two most commonly used criteria used to test the soundness of a study are (1) validity and (2) reliability. A study is validA study that actually tests what it was designed to test and not something else. if it actually tested what it was designed to test. For example, did the experiment you ran in Second Life test what it was designed to test? Did it reflect what could really happen in the real world? If not, the research isn’t valid. If you were to repeat the study, and get the same results (or nearly the same results), the research is said to be reliableA study that, when repeated, produces the same or nearly the same result.. If you get a drastically different result if you repeat the study, it’s not reliable. The data collected, or at least some it, can also be compared to, or reconciled with, similar data from other sources either gathered by your firm or by another organization to see if the information seems on target.
Stage 7: Write the Research Report and Present Its Findings
If you end up becoming a marketing professional and conducting a research study after you graduate, hopefully you will do a great job putting the study together. You will have defined the problem correctly, chosen the right sample, collected the data accurately, analyzed it, and your findings will be sound. At that point, you will be required to write the research report and perhaps present it to an audience of decision makers. You will do so via a written report and, in some cases, a slide or PowerPoint presentation based on your written report.
The six basic elements of a research report are as follows.
- Title Page. The title page explains what the report is about, when it was conducted and by whom, and who requested it.
- Table of Contents. The table of contents outlines the major parts of the report, as well as any graphs and charts, and the page numbers on which they can be found.
- Executive Summary. The executive summary summarizes all the details in the report in a very quick way. Many people who receive the report—both executives and nonexecutives—won’t have time to read the entire report. Instead, they will rely on the executive summary to quickly get an idea of the study’s results and what to do about those results.
-
Methodology and Limitations. The methodology section of the report explains the technical details of how the research was designed and conducted. The section explains, for example, how the data was collected and by whom, the size of the sample, how it was chosen, and whom or what it consisted of (e.g., the number of women versus men or children versus adults). It also includes information about the statistical techniques used to analyze the data.
Every study has errors—sampling errors, interviewer errors, and so forth. The methodology section should explain these details, so decision makers can consider their overall impact. The margin of errorA measure of the possible inaccuracy of the data reported in a survey. is the overall tendency of the study to be off kilter—that is, how far it could have gone wrong in either direction. Remember how newscasters present the presidential polls before an election? They always say, “This candidate is ahead 48 to 44 percent, plus or minus 2 percent.” That “plus or minus” is the margin of error. The larger the margin of error is, the less likely the results of the study are accurate. The margin of error needs to be included in the methodology section.
- Findings. The findings section is a longer, fleshed-out version of the executive summary that goes into more detail about the statistics uncovered by the research that bolster the study’s findings. If you have related research or secondary data on hand that back up the findings, it can be included to help show the study did what it was designed to do.
- Recommendations. The recommendations section should outline the course of action you think should be taken based on the findings of the research and the purpose of the project. For example, if you conducted a global market research study to identify new locations for stores, make a recommendation for the locations.Sherrie Mersdorf, “How to Organize Your Next Survey Report,” Cvent, August 24, 2009, http://survey.cvent.com/blog/cvent-survey/0/0/how-to-organize-your-next-survey-report (accessed December 14, 2009).
As we have said, these are the basic sections of a marketing research report. However, additional sections can be added as needed. For example, you might need to add a section on the competition and each firm’s market share. If you’re trying to decide on different supply chain options, you will need to include a section on that topic.
As you write the research report, keep your audience in mind. Don’t use technical jargon decision makers and other people reading the report won’t understand. If technical terms must be used, explain them. Also, proofread the document to ferret out any grammatical errors and typos, and ask a couple of other people to proofread behind you to catch any mistakes you might have missed. If your research report is riddled with errors, its credibility will be undermined, even if the findings and recommendations you make are extremely accurate.
Many research reports are presented via PowerPoint. If you’re asked to create a slideshow presentation from the report, don’t try to include every detail in the report on the slides. The information will be too long and tedious for people attending the presentation to read through. And if they do go to the trouble of reading all the information, they probably won’t be listening to the speaker who is making the presentation.
Instead of including all the information from the study in the slides, boil each section of the report down to key points and add some “talking points” only the presenter will see. After or during the presentation, you can give the attendees the longer, paper version of the report so they can read the details at a convenient time, if they choose to.
Key Takeaway
Step 1 in the marketing research process is to define the problem. Businesses take a look at what they believe are symptoms and try to drill down to the potential causes so as to precisely define the problem. The next task for the researcher is to put into writing the research objective, or goal, the research is supposed to accomplish. Step 2 in the process is to design the research. The research design is the “plan of attack.” It outlines what data you are going to gather, from whom, how, and when, and how you’re going to analyze it once it has been obtained. Step 3 is to design the data-collection forms, which need to be standardized so the information gathered on each is comparable. Surveys are a popular way to gather data because they can be easily administered to large numbers of people fairly quickly. However, to produce the best results, survey questionnaires need to be carefully designed and pretested before they are used. Step 4 is drawing the sample, or a subset of potential buyers who are representative of your entire target market. If the sample is not correctly selected, the research will be flawed. Step 5 is to actually collect the data, whether it’s collected by a person face-to-face, over the phone, or with the help of computers or the Internet. The data-collection process is often different in foreign countries. Step 6 is to analyze the data collected for any obvious errors, tabulate the data, and then draw conclusions from it based on the results. The last step in the process, Step 7, is writing the research report and presenting the findings to decision makers.
Review Questions
- Explain why it’s important to carefully define the problem or opportunity a marketing research study is designed to investigate.
- Describe the different types of problems that can occur when marketing research professionals develop questions for surveys.
- How does a probability sample differ from a nonprobability sample?
- What makes a marketing research study valid? What makes a marketing research study reliable?
- What sections should be included in a marketing research report? What is each section designed to do?
We want to hear your feedback
At Flat World Knowledge, we always want to improve our books. Have a comment or suggestion? Send it along! http://bit.ly/wUJmef
10.3 Discussion Questions and Activities
Discussion Questions
- Are small business owners at a disadvantage if they lack the marketing research resources large companies have? Why or why not?
- Online marketing research seems to be the wave of the future. What drawbacks do you see associated with conducting surveys online? Are privacy issues greater with online surveys than with other forms of administering surveys, such as phone, face-to-face, or mail?
- Why do you think so many marketing research companies are conglomerating—that is, merging with or acquiring one another? Is it solely to conduct global marketing research?
- You need to conduct research on consumer acceptance for a new product. Describe the process you would use. How would your project change if the product solved an embarrassing problem? What would your challenges be in that situation?
- Given the way people tweet about customer service, why do companies still use mystery shoppers? Why not simply follow tweet volume and content to see if service is good?
- You are working for an organization that provides clean water technology to communities in Africa. They’ve never worked in Malawi but want to and need to understand how consumers source water, how they prepare it (sterilize or clean it), and how they use it. You know that a study was done on water sources, water preparation, and water uses in Kenya. What type of research would the Kenya study be considered and how would you go about validating its findings for Malawi (a different country in Africa)? How would your answer change if your organization was considering a community in a remote area of Nicaragua? (By the way, this question is based on a real situation involving Living Water International, a student project at Baylor University and funded by 3M that examined Somotillo, Nicaragua, and a study done in Kenya by Boston University’s School of Public Health).
- Your CEO is personally involved in developing a new product that is really cool, but you have your doubts about whether it really delivers any additional benefits over what is already available. When you pitch the idea of marketing research study to test consumer response, she says, “Are you kidding? Why waste the money and time, as well as let our competitors know what we’ve got? Let’s get this to market!” But the market launch will cost $3 million and your company’s profits last year were only $5 million. How would you respond? How would your answer differ if the launch only cost $300,000?
-
The chapter mentions using salespeople and channel partners as sources of information. Describe how you would go about this and if or why salesperson/channel partner input is important when trying to make the following decisions:
- When trying to design the booth for use at trade shows
- When trying to decide which features to add or subtract from a product
- Making pricing decisions
- Describe how you would use projective techniques to help your university understand how prospective students make schooling decisions. Be specific when describing how you would use the technique, providing examples of questions.
- In Freakonomics, Steven Leavitt describes a study of public housing residents that began with the question, “How does it feel to be poor and black?” He says that’s a bad question to start a survey with. Why? (There are multiple reasons.)
-
You sell manufacturing equipment for a Chinese company that imports the equipment into your country. You want to do a research project on potential brand names for a new product line, and have to choose among the following sampling ideas or projects. For each one, identify what type of study and sample you have, discuss the pros and cons, and then at the end, make a decision.
- Stopping 200 people at a trade show and showing potential brand names to them to get their reaction.
- Hosting a breakfast or lunch at a trade show to get 3 groups of 10 to provide feedback to the names and logos.
- Send an email to your customers with a link to a URL that has the various names and let them vote.
Activities
-
In this activity, you will conduct a survey using either Zoomerang.com or SurveyMonkey.com. Divide into groups of four people. Each group should do the following:
- Choose a food-service establishment on or near your campus. Then create a ten-question survey designed to gauge how satisfied customers are with the establishment’s food and service.
- Decide how you will deliver the questionnaire you’ve created. Choose a sampling frame, or list of people from which you will draw your sample.
- Administer the survey. After you have collected the results, analyze them and write a research report with the sections outlined in the chapter.
- Contact the owner or manager of the establishment, and present him or her with the findings. If your research is helpful to the manager, who knows? It might earn you a free meal or at least some money-off coupons.
- Would you like to own an all-electric car? Do you think there is a viable market for such a product? Team up into small groups of three or four people. As a team, use secondary data to research the viability of selling electric cars profitably. Utilize some of the sources mentioned in the chapter. Try to determine the population of electric-car buyers. Lastly, write a research report based on your findings. Each group should present its findings to the class. Do the findings differ from group to group? If so, why?
We want to hear your feedback
At Flat World Knowledge, we always want to improve our books. Have a comment or suggestion? Send it along! http://bit.ly/wUJmef