This is “Cash and Cash Conversion Cycle”, chapter 17 from the book Finance for Managers (v. 0.1). For details on it (including licensing), click here.
For more information on the source of this book, or why it is available for free, please see the project's home page. You can browse or download additional books there. To download a .zip file containing this book to use offline, simply click here.


Chapter 17 Cash and Cash Conversion Cycle
Cash is King
PLEASE NOTE: This book is currently in draft form; material is not final.
During the financial crisis of 2008 many of the very wealthy were doing the unthinkable: they were flying commercial! Instead of taking the private jet to Aspen or Monaco, the wealthy were arriving two hours early for flights and going through security (just like us commonfolk). The rich were reducing spending in other ways as well: luxury car sales were down, as were vacation home sales and purchases of art and collectables. The affluent were looking for “bargains”. Why such austere measures amongst those whose assets were valued in the millions? The collapse of financial markets and the decline in real estate values, among other factors, created a situation of having wealth on paper, but lacking liquid assets, that is, cash.
Cash flow is important in business, too. Assets on financial statements do not always translate into money available to pay workers or suppliers. The financial crisis took its toll on many companies as well and led to bankruptcies for large companies such as Lehman Brothers, General Motors, and CIT Group, Inc. Cash management is like a see-saw that companies need to balance between keeping cash on hand and investing in assets. They need enough cash to be liquid enough to pay suppliers and please creditors, but demanding too much cash from investors can increase financing costs. In this chapter we discuss the cash flow of a firm, including taxes, and describe techniques that can be used to forecast future cash production or need.
Financial Planning
Learning Objectives
- Describe a corporate financial plan.
- Distinguish and explain the difference between short-term and long-term plans.
Proper financial planning is key to any financial manager’s success. Financial planning is a process involving analyzation of the existing state of financial affairs and a realistic estimation of the future. Companies review current assets, expenses, income and sales and try to estimate potential opportunities and challenges. This analysis is compiled into a financial plan. A financial planAn evaluation of a company’s current financial state and a plan for the future. is an evaluation of a company’s current financial state and a projection for the future. Financial plans are either short-term, covering a 1–2 year period or long-term, typically two to ten years. Many companies (and universities and non-profits and others) use a five year plan and update it as needed. Without a solid financial plan, a new product or plant addition may not come to frutition.
There are two components to corporate financial planning: planning for cash flows and planning for profits. The first step is cash budget planning (remember cash is king). A good cash budget becomes the foundation for a profit plan. The second step is planning for profits. The profit plan involves pro forma statements. A pro forma statement is projected figures for a company to use in the financial planning process. Pro forma statements require more in depth analysis and are covered in a separate chapter. In this chapter we focus on cash. There are many parts involved with cash and its management. We begin here with cash budgeting.
Key Takeaways
- A financial plan is an assessment of a company’s current financial situation and a projection of their future situation.
- Short-term plans are 1–2 years and long-term plans are typically 2–10 years.
Exercises
- Why does a company need a financial plan?
- In what ways is a corporate financial plan similar to a personal financial plan? Do you have a personal financial plan? If not, do you have plans to create one?
17.1 Cash Budgets
PLEASE NOTE: This book is currently in draft form; material is not final.
Learning Objectives
- Describe a cash budget and its components.
- Distinguish and explain the difference between cash inflows and outflows.
- Identify the parts of a sales forecast.
Creating a cash budget is a way for a firm to estimate its short-term cash income and expenditure requirements. Typically cash budgets are for a one-year period, usually divided into months to capture the seasonality experienced by many businesses. Just like an individual would want to plan for higher heating bills in the winter, a business would want to plan for seasonal fluctuations, such as lower sales for snowblowers in the summer. A cash budget is very different from the cash flow statement.
Cash Inflows and Outflows
Any cash coming in to the company is a cash inflowA source of cash or an increase in the company’s cash balance.; for the sake of consistency and to avoid errors, we will always use positive numbers to represent inflows. Any cash leaving the company is a cash outflowA use of cash or a decrease in the company’s cash balance., and will be represented by a negative number. Simply put, inflows are sources of cash while outflows are uses of cash.
When a company pays its advertising bill, it is a cash outflow. When the company receives payment from a customer, it is a cash inflow. Other accounts are a bit trickier. For example, if a firm’s accounts payable increased by $2,000, it is a cash inflow. If inventory increased over the year by $3,000, the change would be negative and an outflow of cash. Let’s start with the summary below.
Figure 17.1 Examples of Cash Inflows and Outflows
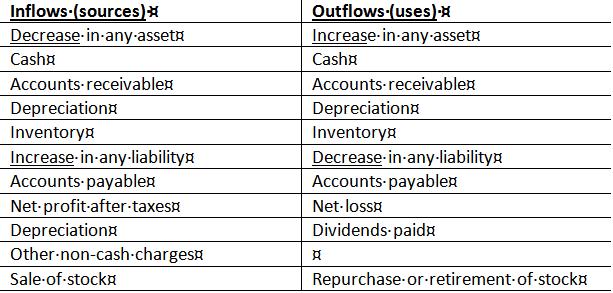
Cash increases occur anytime you have a decrease in any asset or an increase in liabilities. How is this? If any of your assets decrease (for example accounts receivable or inventory) this means that cash has been freed up to be held as cash instead of being tied up as AR or in inventory. In essence we put money in the safe (a cash inflow) and a have a decrease in our asset. Conversely, a company’s cash balance decreases (cash outflow) if there is an increase in any of its assets. If accounts receivable or inventory increases, then that is more money held as that asset and therefore less money held as cash. So the company’s cash balance decreases.
With liabilities the opposite is true. An increase in any liability such as accounts payable results in an inflow of cash. In other words, if accounts payable increases than that means we did not pay as much on our payables and therefore we are holding more cash. If accounts payable decreases, then we have a cash outflow because we used cash to pay our payables. Profit is a bit easier. So easy in fact we can sum it up in one sentence: Any profit is a cash inflow and any loss is a cash outflow.
Key Takeaways
Cash management is vital to the health of any company. A cash budget is an vital tool in cash management as it helps with a company’s financial planning, both short-term and long-term.
- A cash budget is an important tool in financial planning.
- Key in accurate prediction of a cash budget is the sales forecast and any other external or internal variables
- Cash inflows are positive, cash outflows are negative.
Exercises
-
Classify the following cash flows as a cash inflow or cash outflow.
Sales
Electric Supplier invoice
mortgage
payment from biggest customer
-
Create an internal cash budget based on the following information:
Sales = $50,000
Rent = $20,000
Depreciation = $7,500
Accounts Receivable = $20,000
Accounts Payable = $15,000
17.2 Net Working Capital Basics
PLEASE NOTE: This book is currently in draft form; material is not final.
Learning Objectives
- Identify working capital and why working capital is needed.
- Explain different strategies for determining the level of working capital.
Related to cash is net working capital. Net working capital is not specifically cash but instead the diference between what we currently owe and what we currently own. These are our immediate sources and uses of cash. To see if we can pay our bills we need to manage our current assets and liabilities; as these will all come due within a year. Working capital management is the creation of a working capital policy and the day to day management of cash, inventories, receivables, accruals and payables and is a large part of a financial manager’s job. It includes the determinination of the level of each of these items and also the financing of these items. Working capital policy impacts a firm’s balance sheet, financial ratios and possibly credit rating. Businesses risk defaulting if they don’t have enough cash to pay their debts.
Net working capitalThe difference between current assets and current liabilities. is the difference between current assets and current liabilities. Change in net working capital is most simply the change in current assets minus the change in current liabilities.
If Current Assets > Current Liabilties, then Net Working Capital is positive If Current Assets < Current Liabilities, then Net Working Capital is negativeSo is it better to have more or less Net Working Capital? It depends. If we are growing revenues, then our accounts receivable will probably increase as we loan more to our customers, thus increasing Net Working Capital (if we maintain the same levels for all of our other current items). On the other hand, if our customers are taking longer to pay us, accounts receivable will also increase (thus increasing Net Working Capital). In both cases, Net Working Capital increases, but the story is much better for our company in the former case.
Negative Net Working Capital = Good?
Negative net working capital can be good. Since current liabilities are money owed but not paid, it means that your business is effectively using other people’s money to run day-to-day operations. Walmart, for example, routinely has negative net working capital; it takes its time paying its suppliers (large accounts payable) but receives payment from most of its customers at the time of sale (small accounts receivable). Not a bad position to be in.
Risk and Net Working Capital
There is always a tradeoff between risk and return. Businesses want to minimize risk and maximixe return. Holding cash on the balance sheet provides a safety net, since the more cash available, the lower the chance of not having enough to pay bills as they come due. But cash is a terrible investment: it does not earn a return. Investing cash in projects, other business, securities, etc. can earn a return, but then we risk not having it available when it is needed. Companies try to maximize their return with minimum risk by making sure they hold enough cast to remain solvent, but investing excess cash.
External Funding of Working Capital
Our company’s investment in current assets has to come from somewhere; funding of current assets can be either with short-term or long-term debt, equity, or the sale of long-term assets. Primary sources include bank loans, credit terms from suppliers, accrued liabilities, bonds, and common equity. Each of these sources has advantages and disadvantages. Short-term loans need to be paid sooner, and are typically more sensitive to fluctuations in interest rates. Longer term debt is more predictable, but also typically more expensive.
Seasonal Requirements
Demand for working capital is not constant. We’ve discussed how net working capital can increase due to growth or new projects, but companies can also have seasonal current asset requirements. Ski resorts, ice cream shops, department stores, and many tourist businesses have seasonal funding requirements: they may have different levels of current assets at different times of the year.
Figure 17.2 Seasonal Funding Requirements
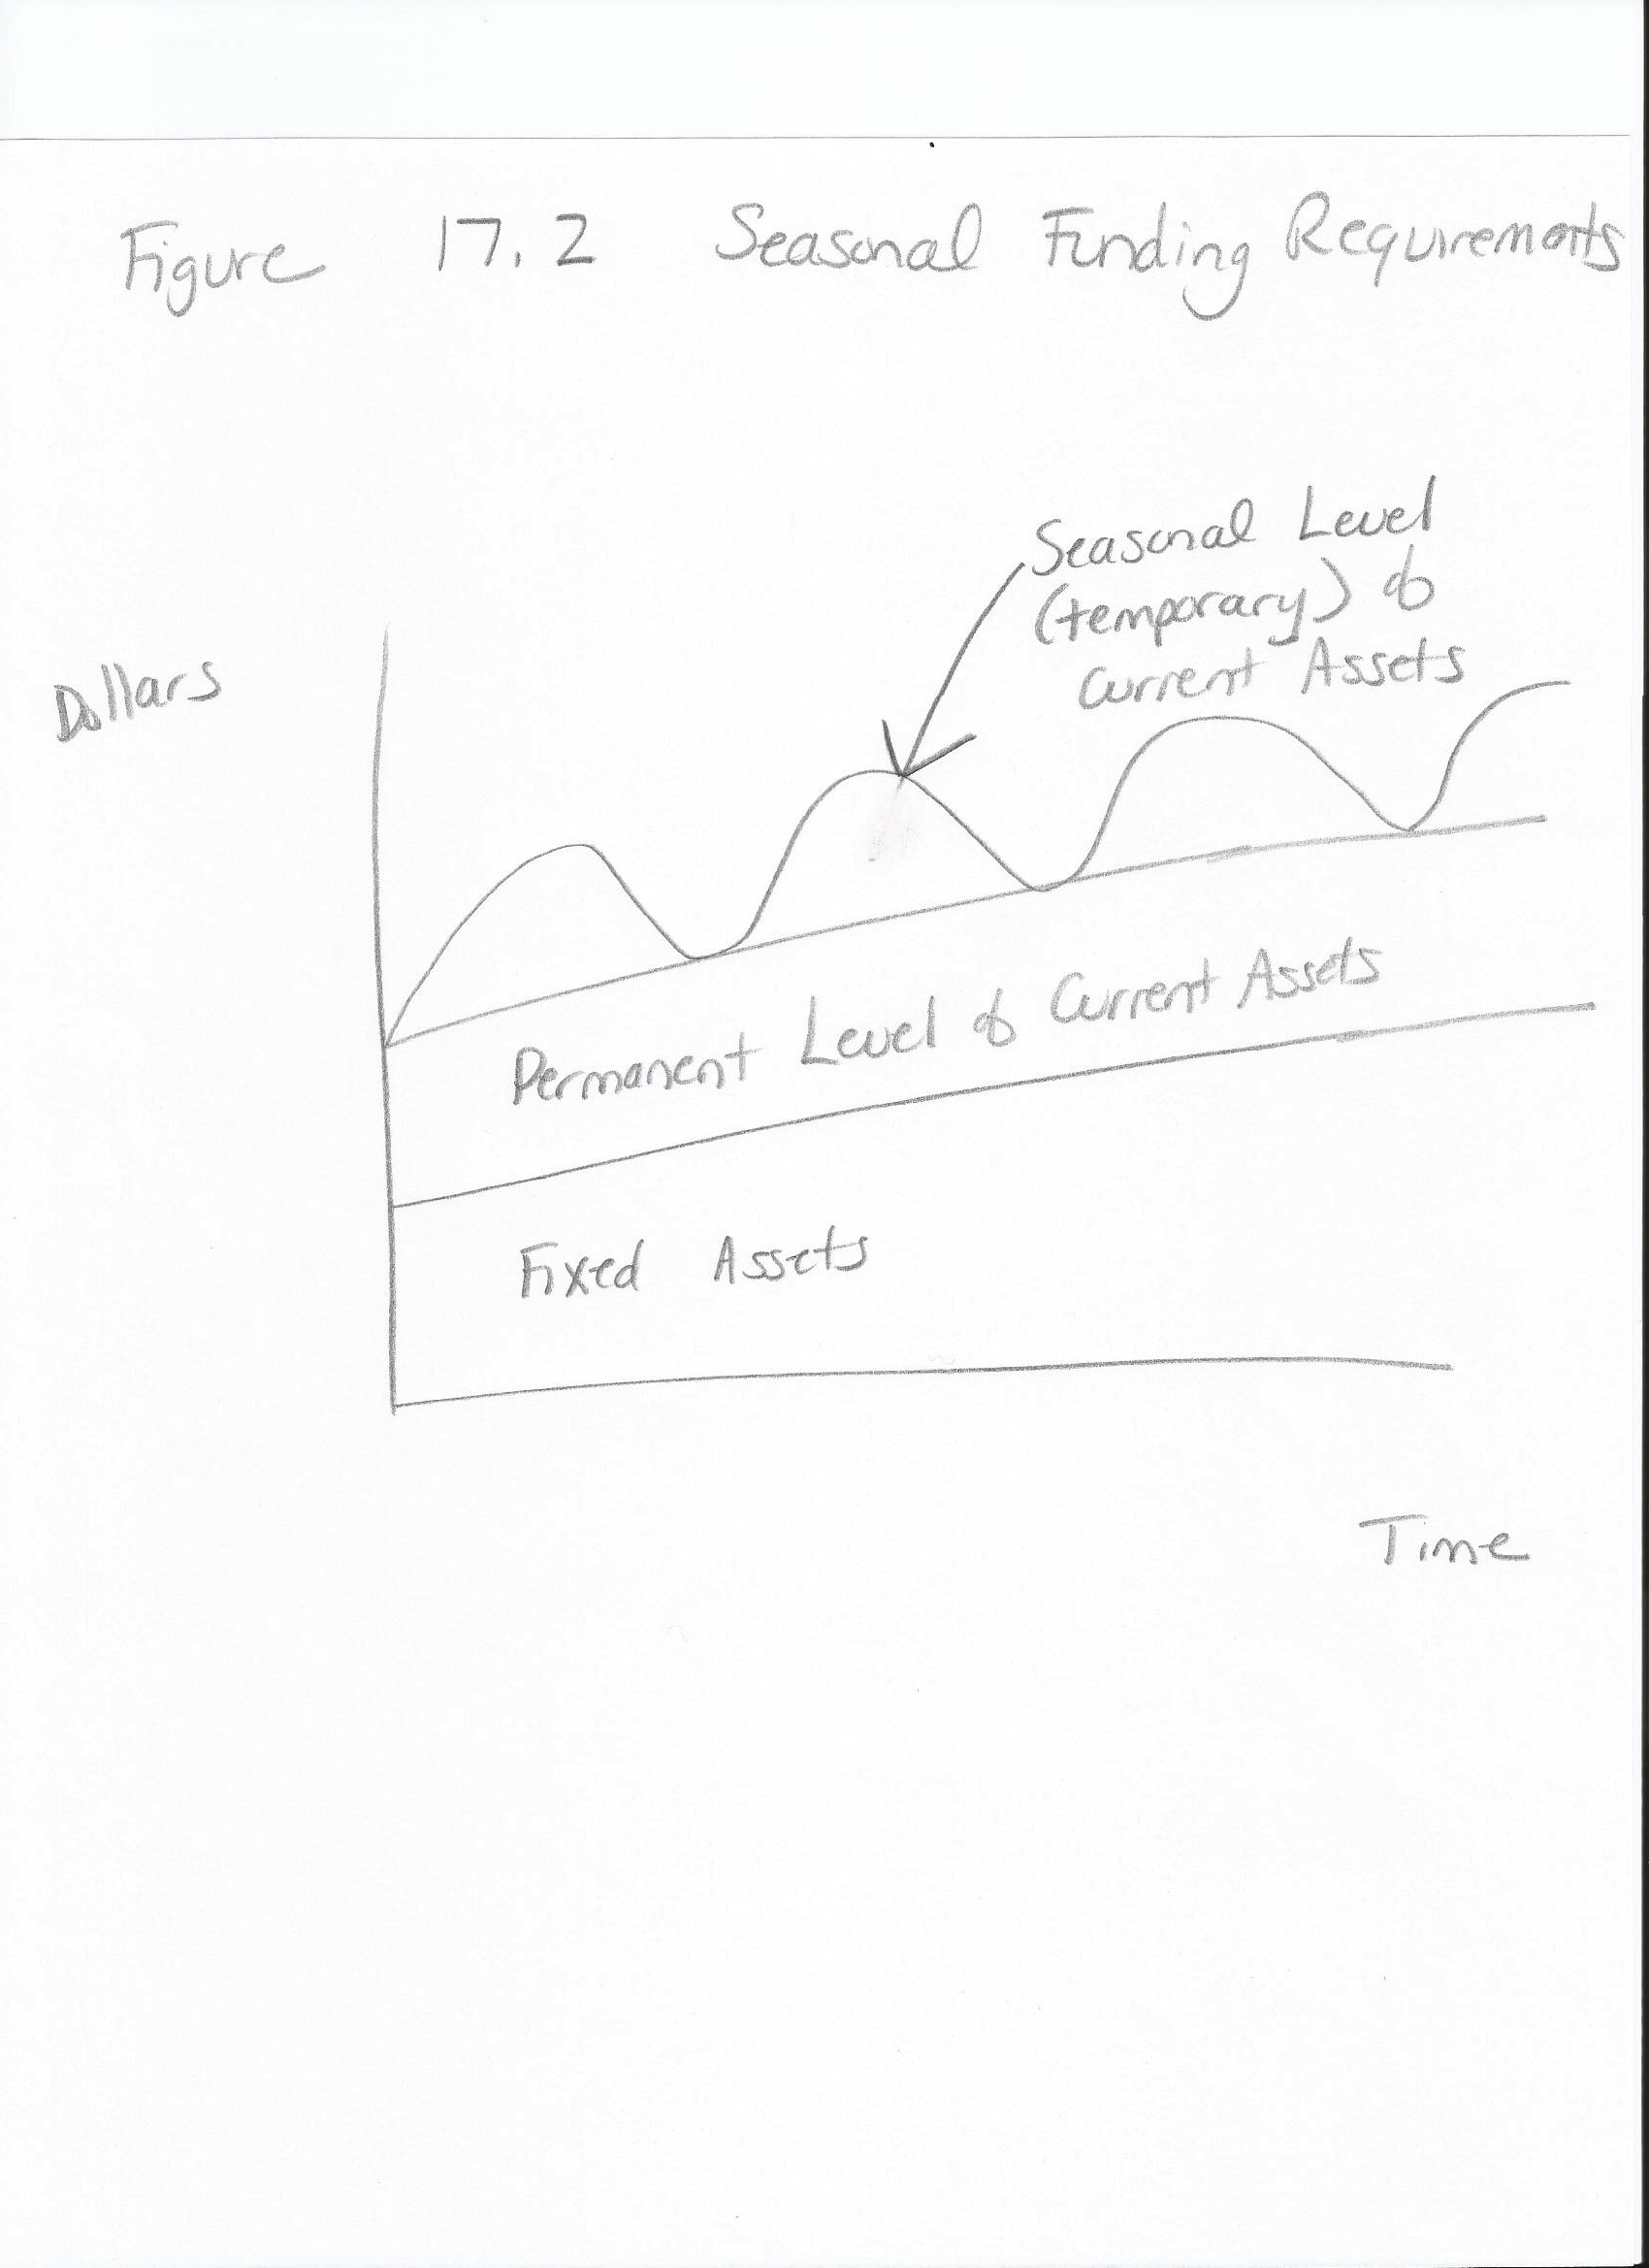
Jack Co. and Johnny Co. Seasonal Funding Example
Jack Co. has $25,000 in cash, $100,000 in inventory and $80,000 in Accounts Receivable (A/R). Their Accounts Payable (A/P) is stable at $55,000. What is their permanent funding requirement?
$25,000 + $100,000 + $80,000 = $205,000 − $55,000 = $150,000
Johnny Co. has the same current asset requirements for part of the year. The other part of the year their inventory peaks at $140,000 and their A/R peaks at $135,000. All other variables remain constant. Their permanent funding need is $150,000 (same as Jack Co.), but what is their seasonal funding need?
$25,000 + $140,000 + $135,000 = $300,000 − $55,000 = $245,000
Thus, Johnny Co. needs to have access to $245,000 − $135,000 = $110,000 of extra funding during the peak season.
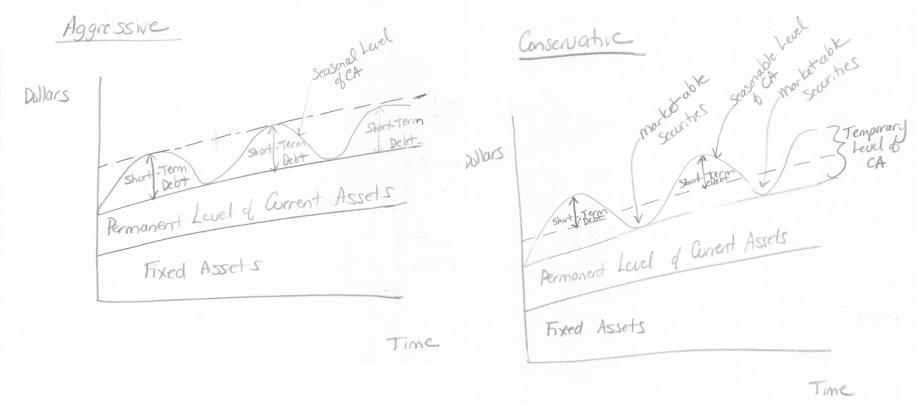
Aggressive vs. Conservative Strategies
Different people hold their money in different ways. Jane might have $10,000 in her checking account because she frequently travels for work and may need access to a lot of cash. Tim, however, holds only the minimum balance required by his bank in his checking account because he has invested in the stock market. Businesses too have different management strategies. Firms can be aggressive or conservative in their approach to the amount of cash they hold. Firms can follow aggressive (also called tight, restricted or lean) policies where holdings of current assets are minimized. Or they can follow a conservative (relaxed) policy where they hold more current assets. A ‘tight’ current assets policy is riskier, as a company may need to resort to scrambling for cash if unexpected expenses arise. Relaxed assures there is enough cash, but potentially trades off higher profitability due to the extra cash being “unproductive”. Many companies split the difference, using a more moderate or a maturity-matching policy, where fixed assets are financed with long-term debt and equity, and current assets are paid for with short-term financing.
Seasonal funding requirements will also differ by strategy. Conservative companies fund both seasonal and long-term requirements with long-term financing, keeping the extra cash on hand when it isn’t needed. Aggressive companies fund seasonal requirements with short-term financing as needed.
Figure 17.3 Aggressive vs. Conservative Strategies
Key Takeaways
- Working capital is the difference between current assets and current liabilities.
- There are different strategies to manage working capital including aggressive and conservative.
Exercises
-
Determine the net working capital funding needs, given the following:
Cash = $15,000
Inventory = $30,000
A/R = $20,000
A/P = $25,000
-
Determine the seasonal funding needs, given the permanent NWC funding in problem 1 and the following peak needs:
Cash = $15,000
Inventory = $55,000
A/R = $45,000
A/P = $25,000
- How might an aggressive strategy backfire? How might a conservative strategy backfire? When is it best to use each type of strategy?
17.3 Cash Conversion Cycle
PLEASE NOTE: This book is currently in draft form; material is not final.
Learning Objectives
- Describe the parts of the cash conversion cycle.
- Calculate the cash conversion cycle.
- Explain how to manage the cash conversion cycle to manage operating capital.
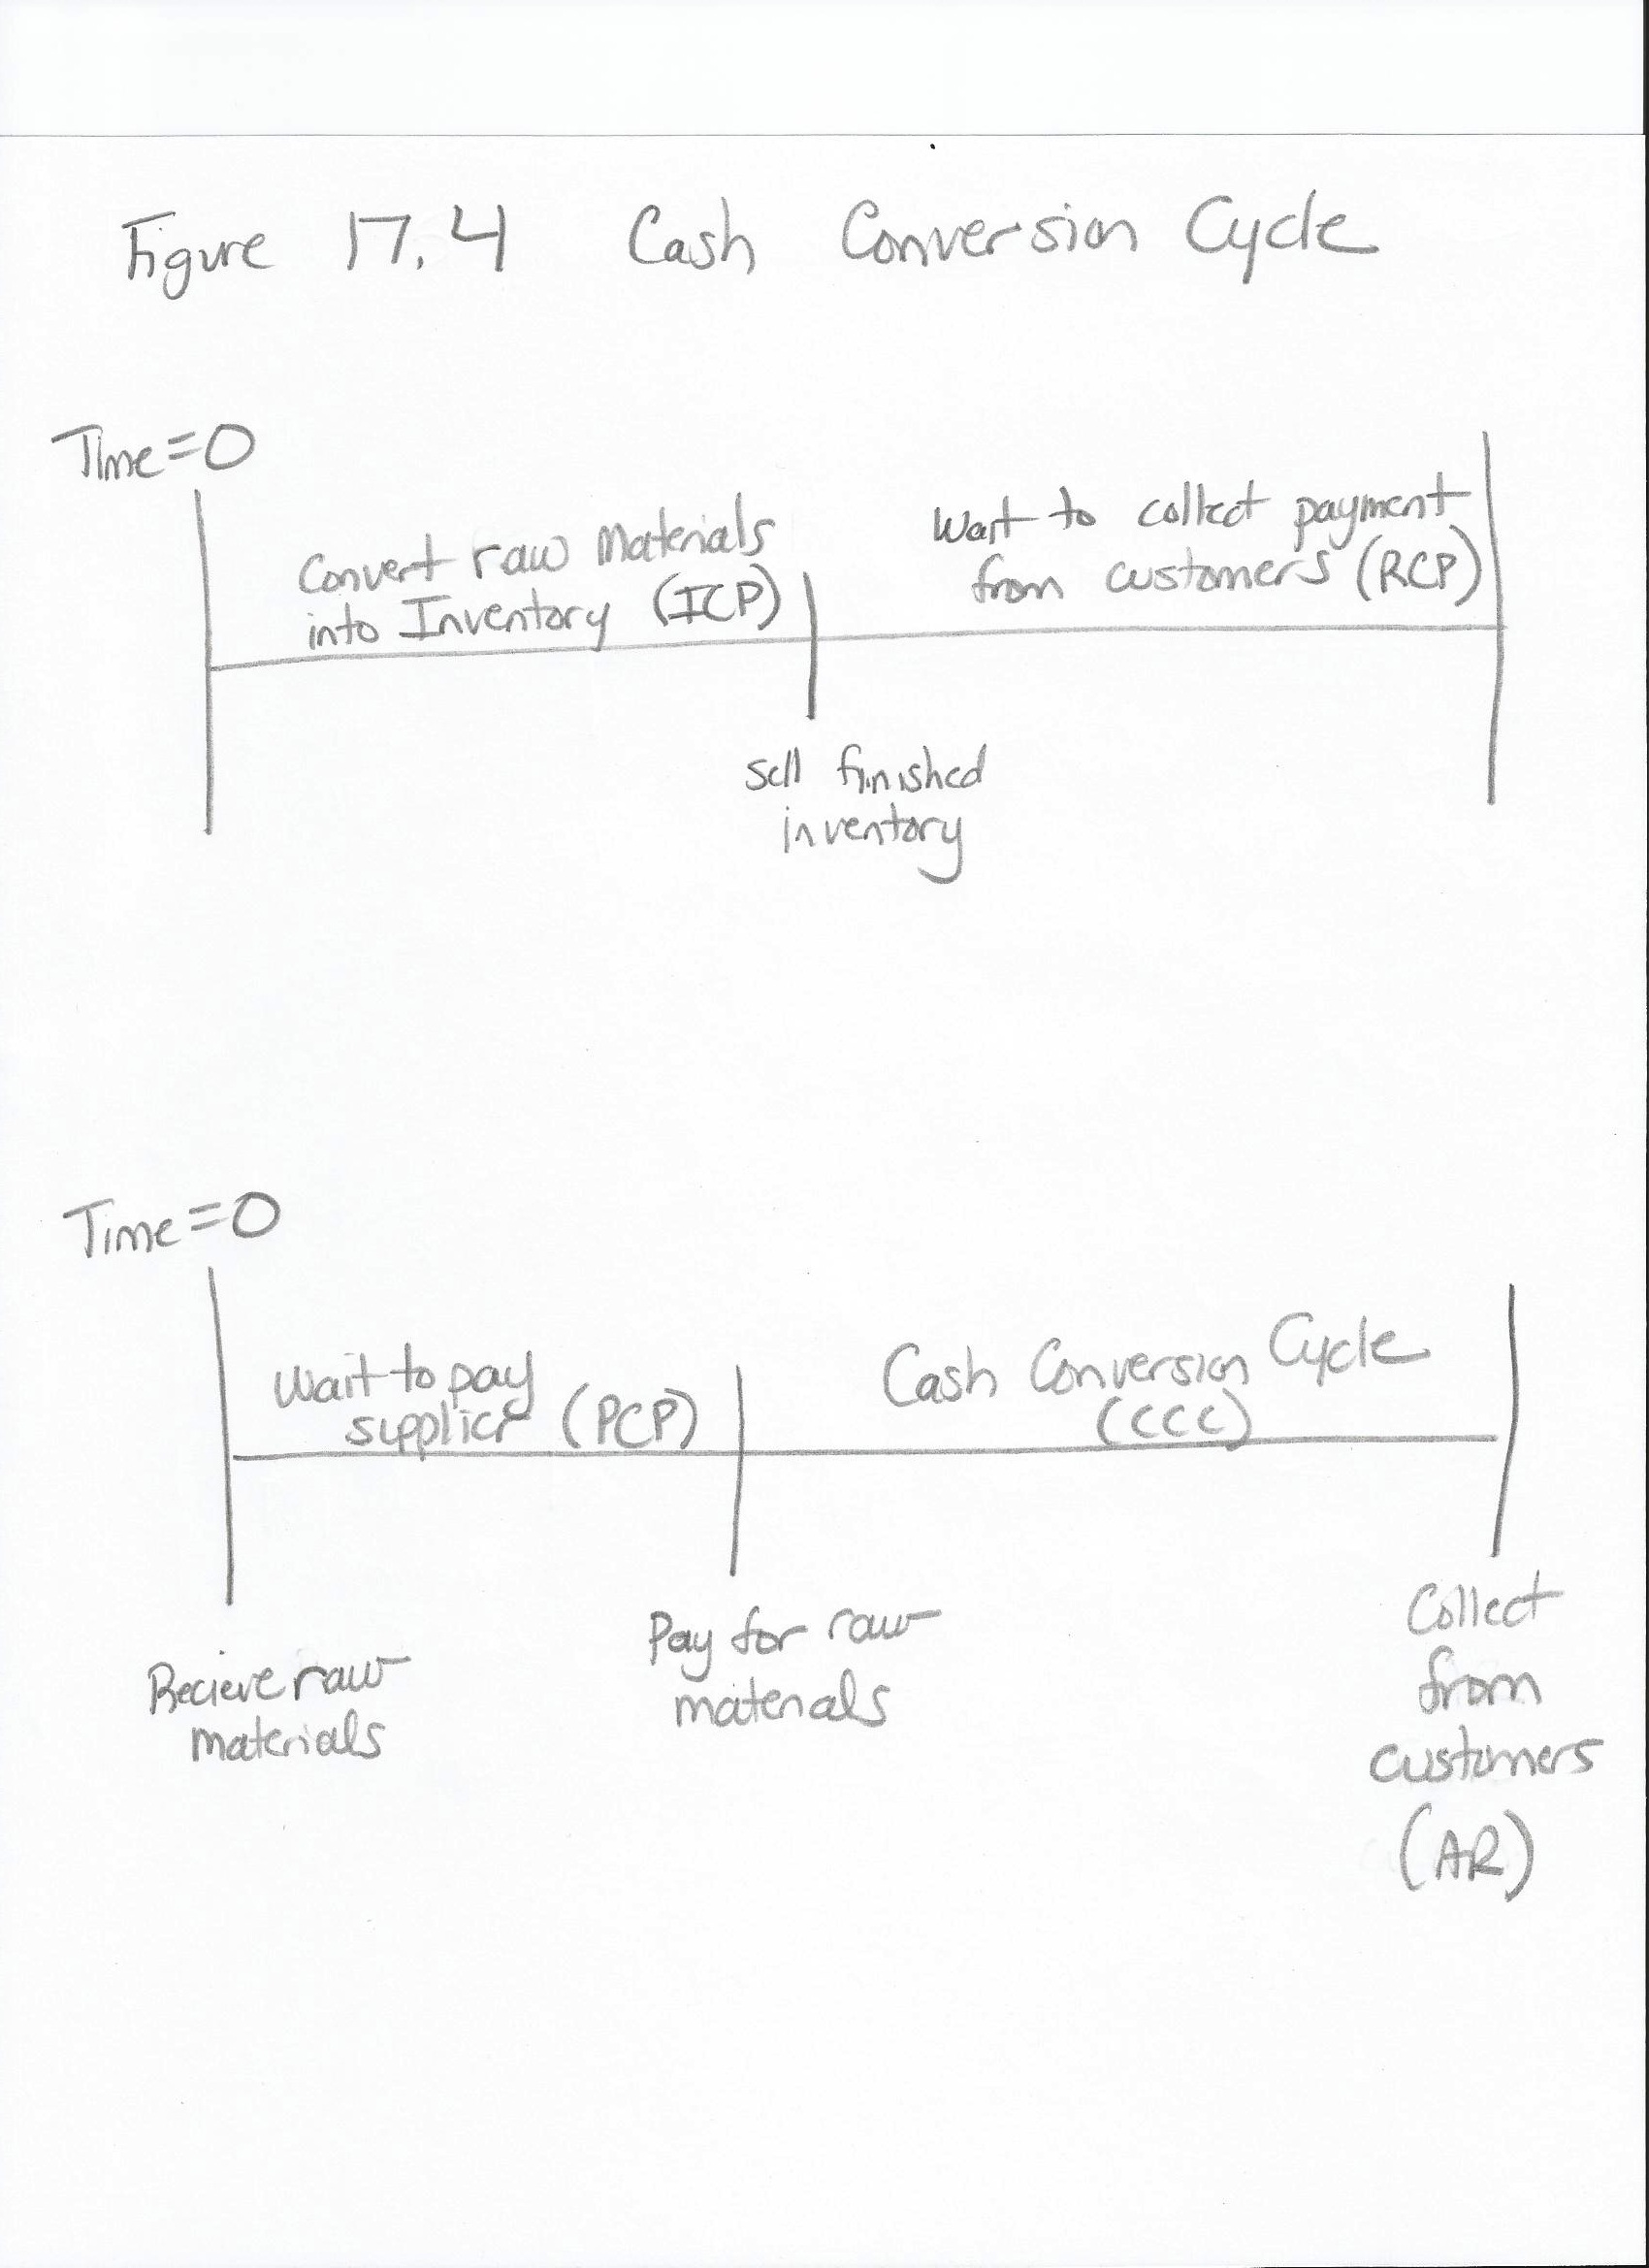
Central to a firm’s working capital management is an understanding of its cash conversion cycleThe length of time it takes a company to convert purchases of raw materials into cash received., or how long it takes for the company to convert cash invested in operations into cash received. The cash conversion cycle measures the time passed from the beginning of the production process to collection of cash from the sale of the finished product. Typically a firm buys raw materials and produces a product. This product goes into inventory and then is sold. Once the product is sold then the firm waits to recieve payment, at which point the process begins again. How long does this take? Understanding this cycle is essential to successful working capital management.
Calculating the Cash Conversion Cycle
The cash conversion cycle is divided into three parts: the average payment period, the average collection period and the average age of inventory. The firm’s operating cycleThe time from the receipt of raw materials until the receipt of cash for the sale of the goods. is length of time from the receipt of raw materials to the collection of payment for the goods sold. This is, essentially, how long it takes from the start of making a new product until we receive cash (on average). The operating cycle is thus the sum of the inventory conversion periodThe average time between when raw materials are received into inventory and product is sold. (the average time between when raw materials are received into inventory and product is sold) and the receivables conversion periodThe average time between a sale and collection of the receipt. (the average time between a sale and collection of the receipt).
Figure 17.4 Cash Conversion Cycle
The inventory conversion period can be estimated if we know the average balance of our inventory and the average value of goods sold each day of the year. The latter should be equal to cost of goods sold for the year divided by 365.
Equation 17.1 Inventory Conversion Period
As an example, if we have $60 thousand in inventory and sell $3 thousand worth of goods every day, then our inventory takes, on average, $60 thousand/$3 thousand per day = 20 days to sell. This, of course, includes production time as well as time that inventory “sits on the shelves”.
Likewise, the receivables conversion period can be estimated if we know the average balance of our account receivables and the average revenues each day of the year. The latter should be equal to revenues for the year divided by 365.
Equation 17.2 Receivables Conversion Period
As an example, if we have $12 thousand in receivables and sell $4 thousand in revenues per day, then our receivables take, on average, $120 thousand/$4 thousand per day = 30 days to collect.
Equation 17.3 Operating Cycle
In our examples, the operating cycle is 20 days + 30 days = 50 days.
When we purchase raw materials, however, we don’t typically pay for them immediately. Just as we offer customers credit, our suppliers will usually provide opportunities for credit to us. Therefore, our cash is not tied up for the entire operating cycle, but just the time from when we finally have to pay for raw materials. This length of time or payables conversion periodThe average time between acquiring raw materials and payment for them. (the average time between acquiring raw materials and payment for them) is subtracted from the operating cycle to determine the entire cash conversion cycle. Unfortunately, total purchases are not readily available from the income statement, so we will often have to estimate them as a percentage of cost of goods sold.
Equation 17.4 Payables Conversion Period
As an example, if we have $30 thousand in payables and purchase $2 thousand in raw materials per day, then our payables take, on average, $30 thousand/$2 thousand per day = 15 days.
Equation 17.5 Cash Conversion Cycle
Our examples cash conversion cycle is thus 20 days + 30 days − 15 days = 35 days.
Figure 17.5 Cash Conversion Cycle Example
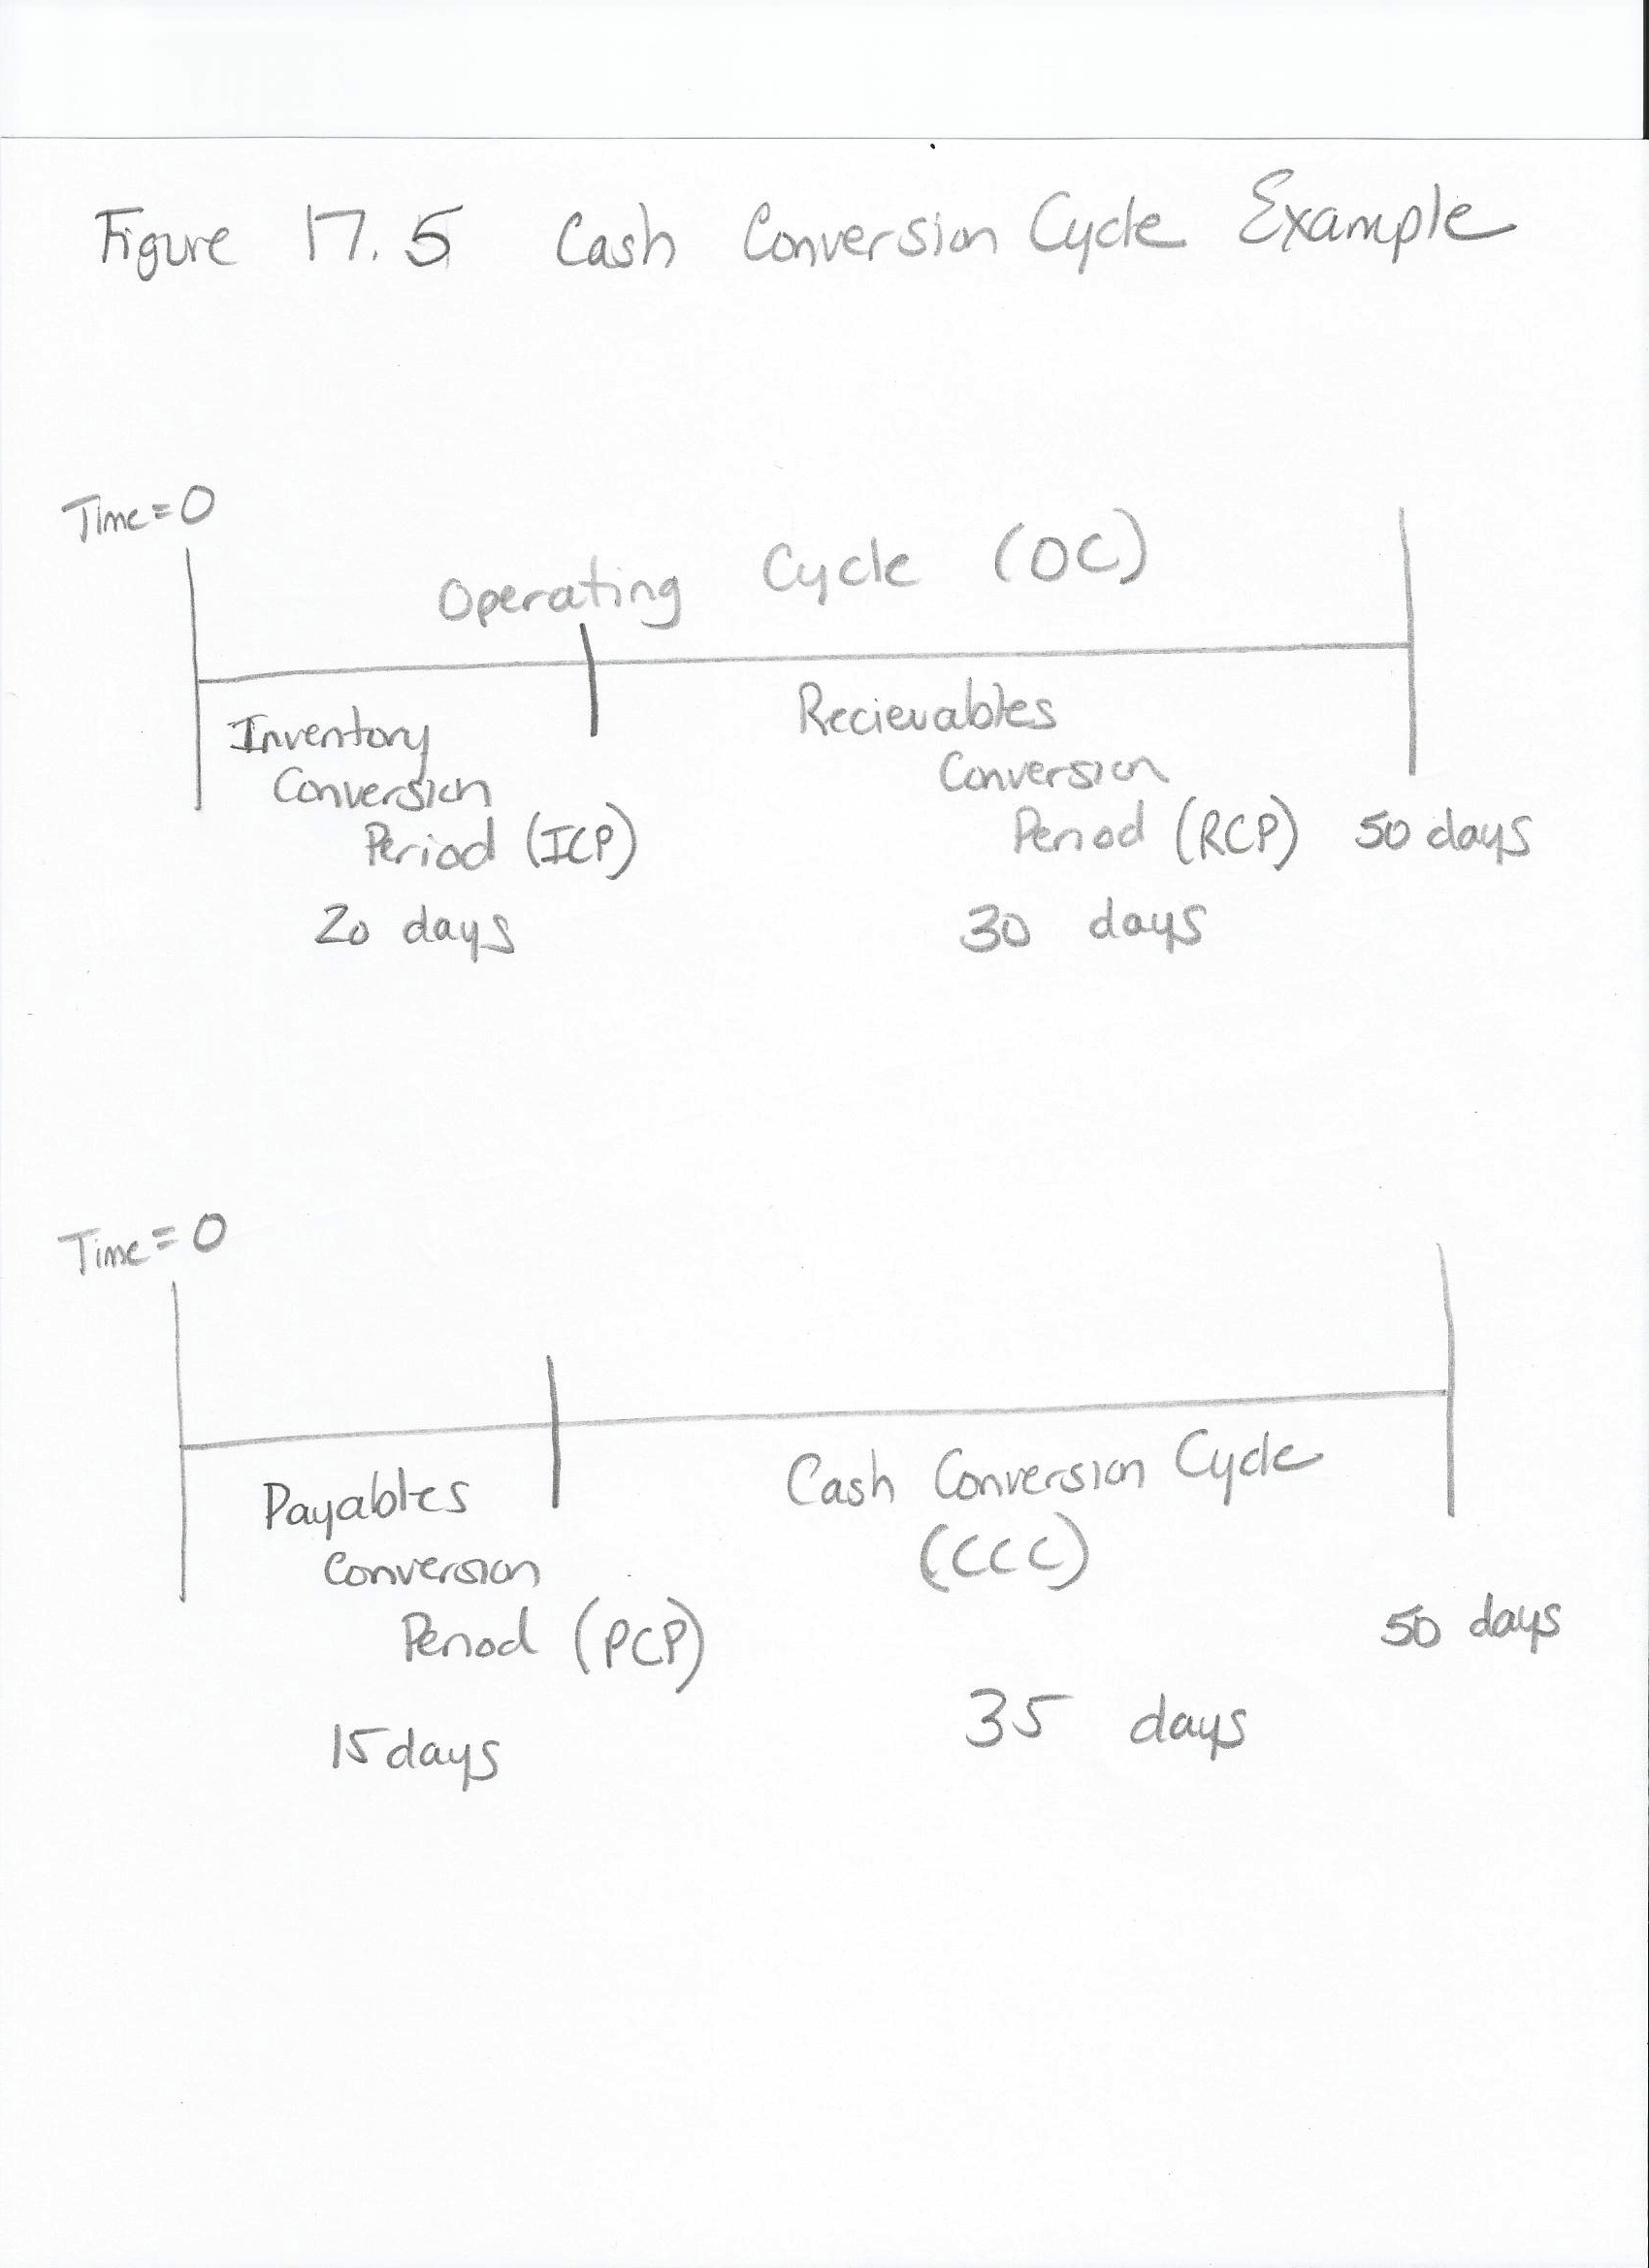
Typically, the shorter the cash conversion cycle, the better, as it means we are keeping our cash moving instead of having it tied up in Net Working Capital. There are other considerations, however. Perhaps, extending collections of receivables, for example, might entice more sales from our customers. Then we need to balance the benefits from the extra sales with the additional costs in Net Working Capital due to the lengthening cash conversion cycle.
CABS Example
Figure 17.6 CABS Balance Sheet
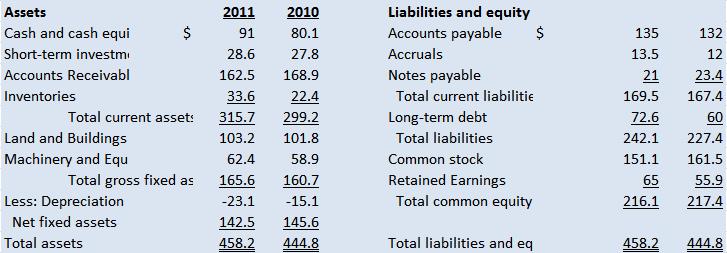
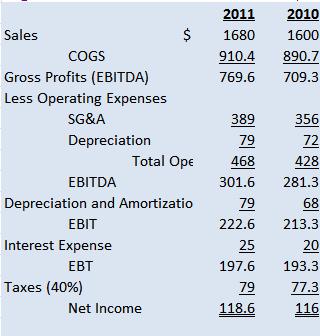
Figure 17.7 CABS Income Statement
Let’s calculate the cash conversion cycle for 2011. Let’s assume that purchases are 90% of the COGS.
First, need to determine the inventory conversion period. Average daily COGS is 910.4 thousand/365 days = 2.49 thousand per day. Ending inventory in 2011 was 33.6 thousand, so 33.6 thousand/2.49 thousand per day = 13.5 days.
What “average” should I take?
In this problem, we are using the ending balances as the average for inventory, A/R, and A/P. Another option would be to take the mean of the starting and end balances (that is, add them together and divide by 2). In reality, we need to use our best judgment as to what the appropriate representation for our company is.
Average daily revenues are 1,680 thousand/365 days = 4.60 thousand per day. Ending A/R in 2011 was 162.5 thousand, so 162.5 thousand/4.60 thousand per day = 35.3 days.
Annual purchases are 90% × 910.4 thousand = 819.4 thousand. Average daily purchases are 819.4 thousand/365 days = 2.24 thousand per day. Ending A/P in 2011 was 135 thousand, so 135 thousand/2.24 thousand per day = 60.3 days.
The cash conversion cycle is therefore 13.5 + 35.3 − 60.3 = −11.5 days. Since our payables conversion period is so long (almost twice the receivables conversion period), we end up paying for the materials after we’ve received payment from our customers!
How Do We Manage the Cash Conversion Cycle?
When a firm changes any of these variables, then their cash conversion cycle changes. Certain steps can be taken to reduce a firm’s cash conversion cycle. These steps include:
- Reduce the average age of inventory. Improve their inventory conversion period by making goods and selling them faster through more efficient processes. Avoiding inventory shortages or stockouts helps too.
- Reduce the average collection period. Speed up collections on accounts receivable. Collect A/R as quickly as possible without losing customers but maintain good credit relations with customers.
- Increase the payables deferral period. Pay A/P as slowly as possible without harming credit rating or relationship with supplier.
- Use technology, strategic partnerships and other leverages effectively. Use technology to collect payments, make product or any other use of technology which improves efficiency.
Key Takeaway
- The shorter the cash conversion cycle, the better we are managing our cash flow.
Exercises
- What does each of the components of the cash conversion cycle represent?
-
Calculate the cash conversion cycle given the following information:
Inventory Conversion Period = 25.3 days
Receivables Conversion Period = 19.9 days
Payables Conversion Period = 14.7 days
17.4 The Bigger Picture
PLEASE NOTE: This book is currently in draft form; material is not final.
Learning Objectives
- Explain how cash and cash budgets fit into the larger picture of financial management.
- Describe some ethical considerations of cash budgets and management.
Through efficient current asset management, necessary working capital can be reduced. By freeing up cash from working capital, we can employ it in more productive, and higher returning, endeavors. Particularly in service industries, where there is less dependency upon fixed captial, effective collections from customers can be the difference between success and failure. A company can have a large net income, but if they can’t finance current assets (as can happen when a company grows too quickly), they can be driven to default. In a sense, they can be very profitably going bankrupt!
Ethical Considerations
When considering cash management, its tempting to try to decrease our cash conversion cycle at all costs. Some strategies may hurt our relationship with our customers: overly aggressive collections can alienate customers, or we might deny credit to customers when they need our support most.
Unscrupulous managers might also manipulate reporting of current assets to falsely represent the state of the company. They might not properly account for bad debts; net income will consequently be higher, but only as accounts receivable swells into a “ticking time-bomb”. If the manager is rewarded for raising revenue, he or she might relax credit standards and sell to customers who have no capacity to pay. Even if the customer can “scrape together” the payments, perhaps the burden would be too much (for example, a low-income customer leasing a luxury automobile).
Another possibility is overstating the value of inventory. Obsolescence or spoilage can cause the value of inventory to be less than what is represented on the balance sheet.
Key Takeaways
- Proper cash management is vital.
- Policies regarding cash have the potential to alienate customers. Balance is key in proper cash management.
Exercise
- Your company has a 90 day collection policy for receivables. A customer is having a cash flow issue, and asks for more lenient payment terms. What are some of the ethical considerations for this scenario?
17.5 End-of-Chapter Problems
PLEASE NOTE: This book is currently in draft form; material is not final.
Exercises
-
Calculate Inventory Conversion Period, Receivables Conversion Period, the Payment Conversion Period and the Operating Cycle for Persistence Inc. given the following information. Use 365 to get average:
Inventory = 150
COGS = 2200
A/R = 80
Revenues = 1460
Purchases = 2555
A/P = 100
- Calculate the Cash Conversion Cycle for the above data from Persistence Inc. and graph on a timeline.
- Can a Cash Conversion Cycle be negative? Why or why not? What does this mean?