This is “Aggregate Supply”, section 23.2 from the book Finance, Banking, and Money (v. 2.0). For details on it (including licensing), click here.
For more information on the source of this book, or why it is available for free, please see the project's home page. You can browse or download additional books there. To download a .zip file containing this book to use offline, simply click here.


23.2 Aggregate Supply
Learning Objectives
- What is the short-run AS curve and why does it slope upward?
- What shifts the short-run AS curve and why?
The aggregate supply curve is a tad trickier because it is believed to change over time. In the long run, it is thought to be vertical at Ynrl, the natural rate of output concept introduced earlier. In the long run, the economy can produce only so much given the state of technology, the natural rate of unemployment, and the amount of physical capital devoted to productive uses.
Figure 23.3 Short-run aggregate supply curve
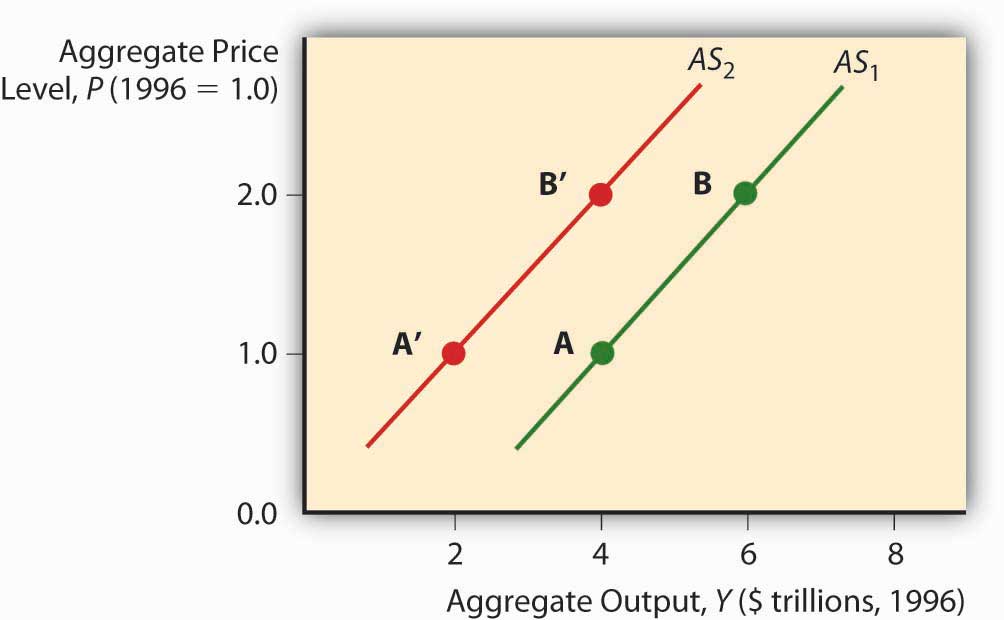
In the short run, by contrast, the total value of goods and services supplied to the economy is a function of business profits, meant here simply as the price goods bear in the market minus all the costs of their production, including wages and raw material costs. Prices of final goods and services generally adjust faster than the cost of inputs like labor and raw materials, which are often “sticky” due to long-term contracts fixing their price. So as the price level rises, ceteris paribus, business profits are higher and hence businesses supply a higher quantity to the market. That is why the aggregate supply (AS) curve slopes upward in the short run, as in Figure 23.3 "Short-run aggregate supply curve".
The short-run AS curve shifts due to changes in costs and hence profits. When the labor market is tight, the wage bill rises, cutting into profits and shifting the AS curve to the left. Any so-called wage push from any source, like unionization, will have the same effect. If economic agents expect the price level to rise, that will also shift the AS curve left because they are going to demand higher wages or higher prices for their wares. Finally, changes in technology and raw materials supplies will shift the AS curve to the right or left, depending on the nature of the shock. Improved productivity (more output from the same input) is a positive shock that moves the AS curve to the right. A shortage due to bad weather, creation of a successful producer monopoly or cartel, and the like, is a negative shock that shifts the AS curve to the left.
Figure 23.4 Factors that shift the short-run aggregate supply curve
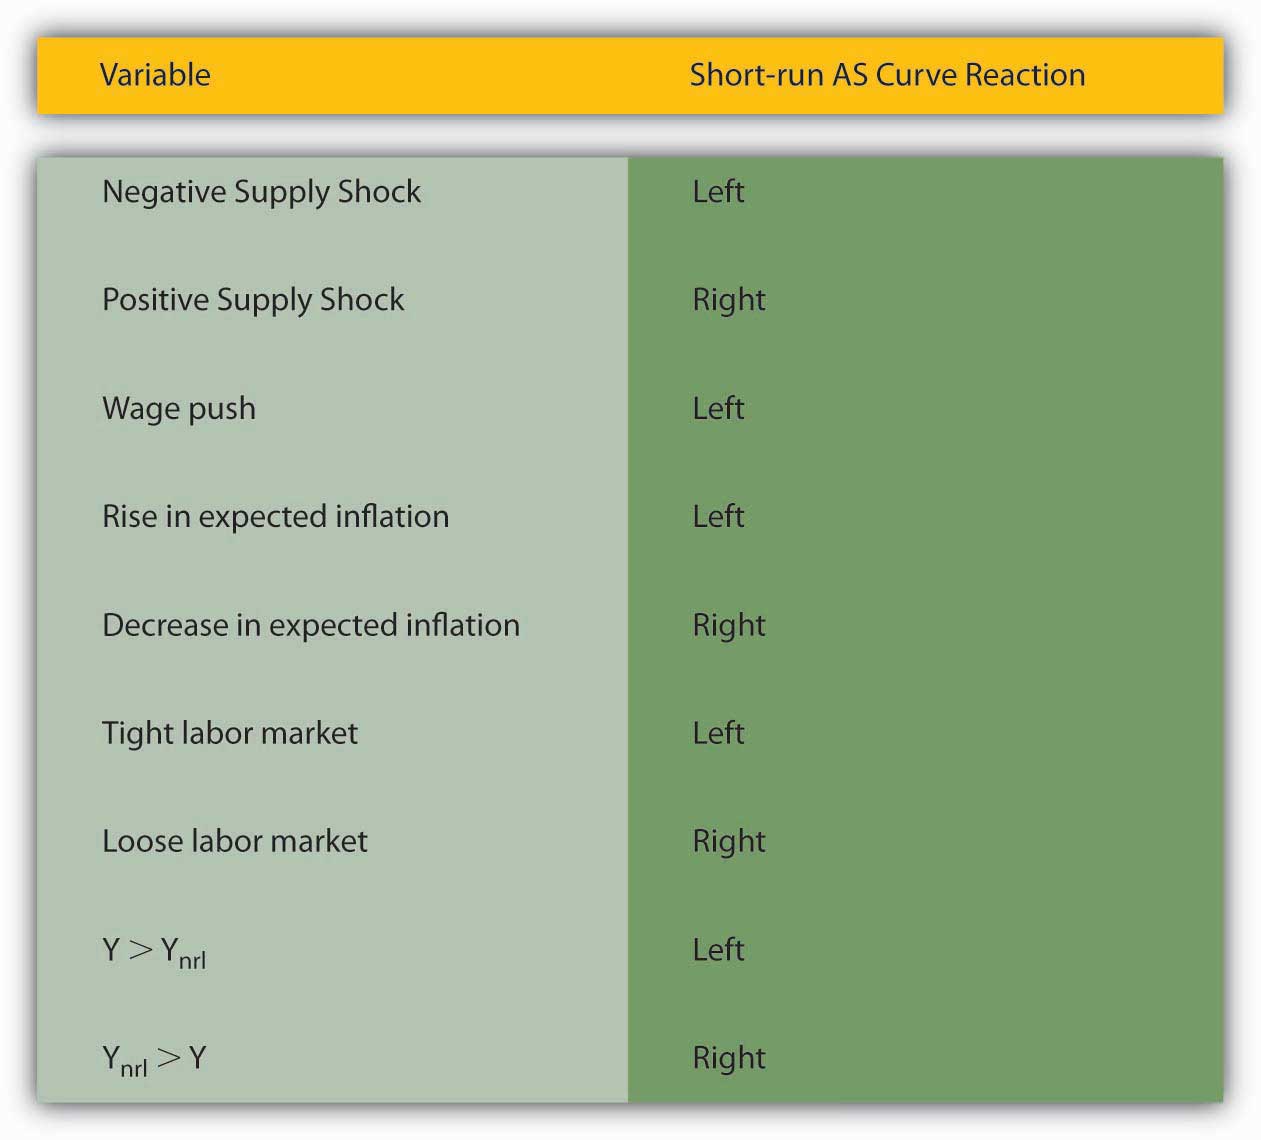
Also, whenever Y exceeds Ynrl, the AS curve shifts left. That is because when Y exceeds Ynrl, the labor market gets tighter and expectations of inflation grow. Reversing that reasoning, the AS curve shifts right whenever Ynrl exceeds Y. Figure 23.4 "Factors that shift the short-run aggregate supply curve" summarizes the discussion of the short-run AS curve.
Key Takeaways
- The aggregate supply (AS) curve is the total quantity of final goods and services supplied at different price levels.
- It slopes upward because wages and other costs are sticky in the short run, so higher prices mean more profits (prices minus costs), which means a higher quantity supplied.
- The AS curve shifts left when Y* exceeds Ynrl, and it shifts right when Y* is less than Ynrl.
- In other words, Ynrl is achieved via shifts in the AS curve, particularly through labor market “tightness” and inflation expectations.
- When Y* is > Ynrl, the labor market is tight, pushing wages up and strengthening inflation expectations; when Ynrl is > *Y, the labor market is loose, keeping wages low and inflation expectations weak.
- Supply shocks, both positive and negative, also shift the AS curve.
- Anything (like a so-called wage push or higher raw materials prices) that decreases business profits shifts AS to the left, while anything that increases business profits moves it to the right.