This is “Determining the Exchange Rate”, section 18.2 from the book Finance, Banking, and Money (v. 1.1). For details on it (including licensing), click here.
For more information on the source of this book, or why it is available for free, please see the project's home page. You can browse or download additional books there. To download a .zip file containing this book to use offline, simply click here.
18.2 Determining the Exchange Rate
Learning Objectives
- What is the structure of the foreign exchange market?
- Why shouldn’t countries be proud that it takes many units of foreign currencies to purchase a single unit of their currency?
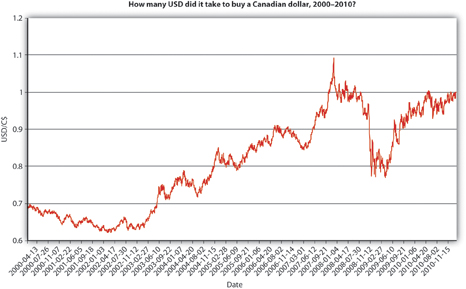
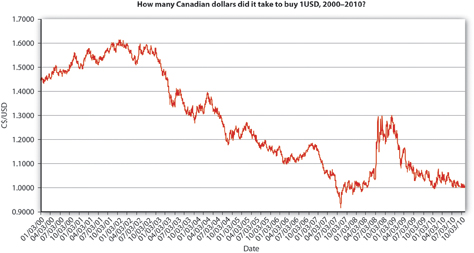
We can’t teach you how to predict future exchange rates because the markets are highly efficient and because exchange rates follow a random walk. (Check out Chapter 7 "Rational Expectations, Efficient Markets, and the Valuation of Corporate Equities" again if you need to.) Trying to make a living predicting exchange rate changes is difficult indeed. That said, you should be able to post-dict why exchange rates changed or, in other words, to narrate plausible reasons why past changes, like those depicted in Figure 18.2 "How many USD did it take to buy 1 Canadian dollar?" and Figure 18.3 "How many Canadian dollars did it take to buy 1 USD?", may have occurred. (This is similar to what we did with interest rates.)
Figure 18.2 How many USD did it take to buy 1 Canadian dollar?

Figure 18.3 How many Canadian dollars did it take to buy 1 USD?

The figures, like the exchange rates in Figure 18.1 "The dollar price of a €17,000 Rabbit and the euro price of a $10 computer fan", are mathematical reciprocals of each other. Both express the exchange rate but from different perspectives. Figure 18.2 "How many USD did it take to buy 1 Canadian dollar?" asks how many USD it took to buy $C1, or mathematically USD/C$. Figure 18.3 "How many Canadian dollars did it take to buy 1 USD?" asks how many $C it took to buy 1 USD, or C$/USD. In Figure 18.2 "How many USD did it take to buy 1 Canadian dollar?", USD weakens as the line moves up the chart because it takes more USD to buy $C1. The dollar strengthens as it moves down the chart because it takes fewer USD to buy $C1. Everything is reversed in Figure 18.3 "How many Canadian dollars did it take to buy 1 USD?", where upward movements indicate a strengthening of USD (a weakening of $C) because it takes more $C to buy 1 USD, and downward movements indicate a weakening of USD (a strengthening of $C) because it takes fewer $C to buy 1 USD. Again, the figures tell the same story: USD strengthened vis-à-vis the Canadian dollar from 2000 to early 2003, then weakened considerably, experiencing many ups and downs along the way. USD appreciated during the financial crisis in an apparent “flight to quality” but weakened again during the 2010 recovery, bringing it back to parity with the Looney. We could do the same exercise ad nauseam (Latin for “until we vomit”) with every pair of currencies in the world. But we won’t because the mode of analysis would be precisely the same.
We’ll concentrate on the spot exchange rateThe price of one currency in terms of another today., the price of one currency in terms of another today. The forward exchange rateThe price of one currency in terms of another in the future., the price today of future exchanges of foreign currencies, is also important but follows the same general principles as the spot market. Both types of trading are conducted on a wholesale (large-scale) basis by a few score-big international banks in an over-the-counter (OTC) market. Investors and travelers can buy foreign currencies in a variety of ways, via everything from brokerage accounts to airport kiosks, to their credit cards. Retail purchasers give up more of their domestic currency to receive a given number of units of a foreign currency than the wholesale banks do. (To put the same idea another way, they receive fewer units of the foreign currency for each unit of their domestic currency.) That’s partly why the big banks are in the business. The big boys also try to earn profits via speculation, buying (selling) a currency when it is low (high), and selling (buying) it when it is high (low). (They also seek out arbitrage opportunities, but those are rare and fleeting.) Each day, over $1 trillion of wholesale-level ($1 million plus per transaction) foreign exchange transactions take place.
Before we go any further, a few words of caution. Students sometimes think that a strong currency is always better than a weak one. That undoubtedly stems from the fact that strong sounds good and weak sounds bad. As noted above, however, a strong (weak) currency is neither good nor bad but rather advantageous (disadvantageous) for imports/consumers and disadvantageous (advantageous) for exports/producers of exportable goods and services. Another thing: no need to thump your chest patriotically because it takes many units of foreign currencies to buy 1 USD. That would be like proclaiming that you are “hot” because your temperature is 98.6 degrees Fahrenheit instead of 37 degrees Centigrade (that’s the same temperature, measured two different ways) or that you are 175 centimeters tall instead of 68.9 inches (another equivalent). Most countries have a very small unit of account compared to the United States, that is all. Other countries, like Great Britain, have units of account that are larger than the USD, so it takes more than 1 USD to buy a unit of those currencies. The nominal level of the exchange rate in no way means that one country or economy is better than another. Changes in exchange rates, by contrast, have profound consequences, as we have seen. They also have profound causes.
Key Takeaways
- At the wholesale level, the market for foreign exchange is conducted by a few score large international players in huge (> $1 trillion per day) over-the-counter spot and forward markets.
- Those markets appear to be efficient in the sense that exchange rates follow a random walk and arbitrage opportunities, which appear infrequently, are quickly eliminated.
- In the retail segment of the market, tourists, business travelers, and small-scale investors buy and sell foreign currencies, including physical media of exchange (paper notes and coins), where appropriate.
- Compared to the wholesale ($1 million plus per transaction) players, retail purchasers of a foreign currency obtain fewer units of the foreign currency, and retail sellers of a foreign currency receive fewer units of their domestic currency.
- The nominal level of exchange rates is essentially arbitrary. Some countries simply chose a smaller unit of account, a smaller amount of value. That’s why it often takes over ¥100 to buy 1 USD. But if the United States had chosen a smaller unit of account, like a cent, or if Japan had chosen a larger one (like ¥100 = ¥1), the yen and USD (and the euro, as it turns out) would be roughly at parity.
- A strong currency is not necessarily a good thing because it promotes imports over exports (because it makes foreign goods look so cheap and domestic goods look so expensive to foreigners).
- A weak currency, despite the loser-sound to it, means strong exports because domestic goods now look cheap both at home and abroad. Imports will decrease, too, because foreign goods will look more expensive to domestic consumers and businesses.


