This is “The Determinants of Interest Rates II: The Term Structure”, section 6.3 from the book Finance, Banking, and Money (v. 1.0). For details on it (including licensing), click here.
For more information on the source of this book, or why it is available for free, please see the project's home page. You can browse or download additional books there. To download a .zip file containing this book to use offline, simply click here.


6.3 The Determinants of Interest Rates II: The Term Structure
Learning Objective
- What is the term structure of interest rates and the yield curve, and what do they explain?
Now we are going to hold the risk structure of interest rates—default risk, liquidity, and taxes—constant and concentrate on what economists call the term structure of interest rates, the variability of returns due to differing maturities. As Figure 6.4 "Risk premiums and bond spreads during the Great Depression, 1929–1939" reveals, even bonds from the same issuer, in this case, the U.S. government, can have yields that vary according to the length of time they have to run before their principals are repaid. Note that the general postwar trend is the same as that in Figure 6.1 "The risk structure of interest rates in the United States, 1919–2008", a trend upward followed by an equally dramatic slide. Unlike Figure 6.1 "The risk structure of interest rates in the United States, 1919–2008", however, the ranking of the series here is much less stable. Sometimes short-term Treasuries have lower yields than long-term ones, sometimes they have about the same yield, and sometimes they have higher yields.
To study this phenomenon more closely, economists and market watchers use a tool called a yield curve, which is basically a snapshot of yields of bonds of different maturities at a given moment. Figure 6.1 "The risk structure of interest rates in the United States, 1919–2008" is what the Treasury yield curve looks like as reported in the Wall Street Journal, which publishes it daily. The current yield curve can also be viewed many places online, including Bloomberg and the U.S. Treasury itself.www.bloomberg.com/markets/rates/index.html;http://www.ustreas.gov/offices/domestic-finance/debt-management/interest-rate/yield.shtml What observers have discovered is that the yields of bonds of different maturities (but identical risk structures) tend to move in tandem. They also note that yield curves usually slope upward. In other words, short-term rates are usually lower than long-term rates. Sometimes, however, the yield “curve” is actually flat—yields for bonds of different maturities are identical, or nearly so. Sometimes, particularly when short-term rates are higher than normal, the curve inverts or slopes downward, indicating that the yield on short-term bonds is higher than that on long-term bonds. And sometimes the curve goes up and down, resembling a sideways S (sometimes tilted on its face and sometimes its back) or Z. What explains this? (Remember, it can’t be tax, default, or liquidity risk because those variables are all the same for Treasuries.)
Figure 6.6 Treasury yield curve
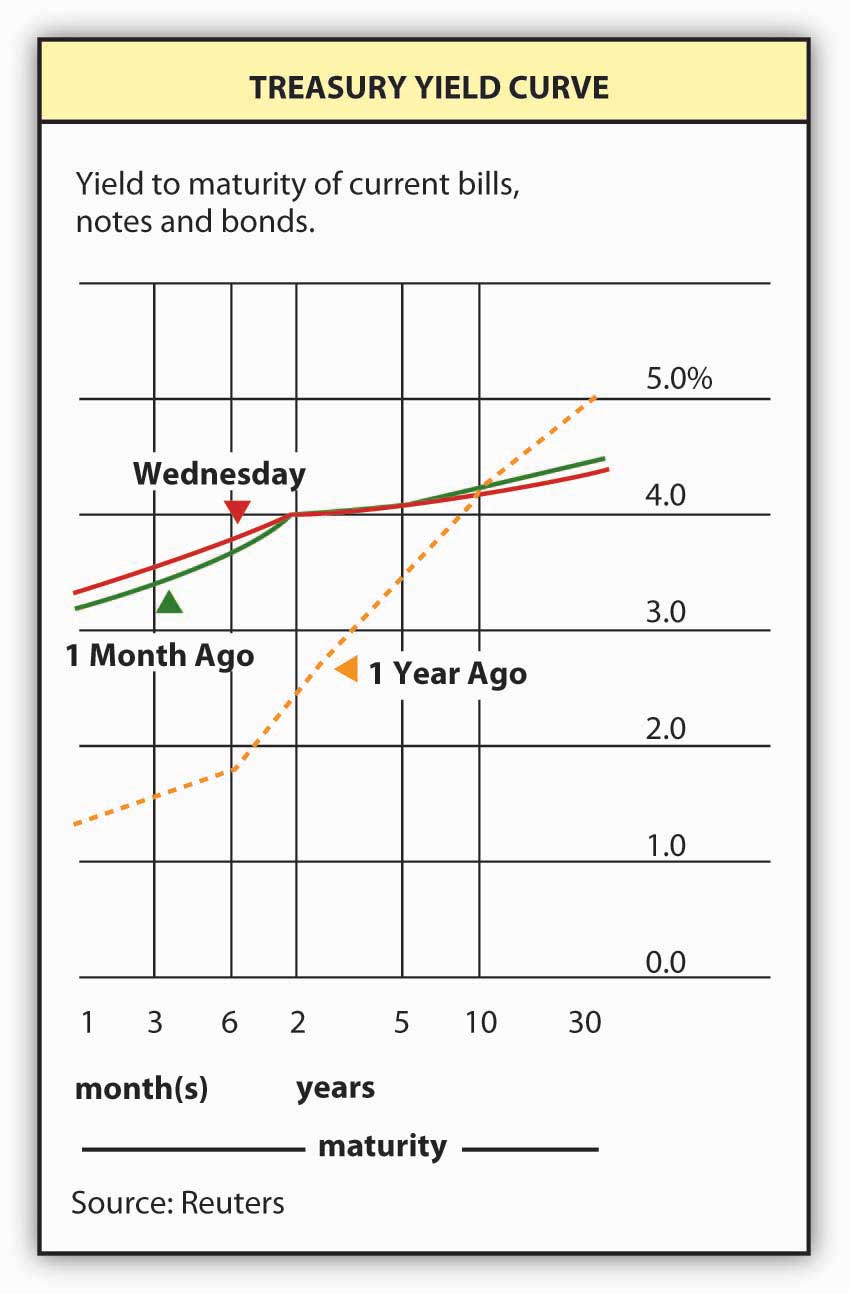
Theory and empirical evidence both point to the same conclusion: bonds of different maturities are partial substitutes for each other, not perfect substitutes, but not completely segmented either. Generally, investors prefer short-term bonds to long-term ones, but they reverse their preference if the interest rate goes unusually high. Investors are willing to pay more for short-term bonds, other factors (like “the” interest rate and the risk structure) held constant, because longer-term bonds are more subject to interest rate risk, as we learned in Chapter 3 "Money". Or, to put it another way, investors need a premium (in the form of a lower price or higher yield) to hold long-term bonds. Ergo, the yield curve usually slopes upward, as it does in Figure 6.6 "Treasury yield curve".
But what about those times when the curve is flat or inverted? Well, there is one thing that can induce investors to give up their liquidity preferenceThe name of one of the theories that economists use to explain the yield curve., their preferred habitatThe name of one of the theories that economists use to explain the yield curve. of short-term bonds: the expectation of a high interest rate for a short term. Investors think of a long-term bond yield as the average of the yields on shorter-term obligations, so when the interest rate is high by historical norms but expected after a year or so to revert to some long-term mean, they will actually begin to prefer long-term bonds and will buy them at much higher prices (lower yields) than short-term bonds. More formally, investors believe that
where:
in = interest rate today on a bond that matures in n years
iex = expected interest rate at time x (0, 1, 2, 3, . . . through n)
ρ = the liquidity or term premium for an n-period bond (it is always positive and increases with n)
So the yield today of a bond with 5 years to maturity, if the liquidity premium is .5 percent and the expected interest rate each year is 4, is 4.5:
i5 = (4 + 4 + 4 + 4 + 4)/5 + .5 = 20/5 + .5 = 4.5, implying an upward sloping yield curve because 4 < 4.5.
If the interest rate is expected to rise over the next 5 years, the yield curve slopes upward yet more steeply:
i5 = (4 + 5 + 6 + 7 + 8)/5 + .5 = 30/5 + .5 = 6.5, again implying an upward sloping curve because 4 < 6.5.
If, on the other hand, interest rates are expected to fall over the next 5 years, the yield curve will slope downward, as in this example:
i5 = (12 + 10 + 8 + 5 + 5)/5 + .5 = 40/5 + .5 = 8.5, implying an inverted yield curve because 12 > 8.5.
Investors may also realize that long-term bonds will increase in price when interest rates fall (as they are expected to do in this example and as we learned in Chapter 3 "Money"), so they are willing to pay more for them now.
Stop and Think Box
In the nineteenth century, the yield curve was usually flat under normal conditions. (It inverted during financial panics.) In other words, short-term and long-term bonds issued by the same economic entity did not often differ much in price. Why might that have been?
One possibility is that there was no liquidity premium then. Then, as now, short-term bonds suffered less interest rate risk than long-term bonds, but investors often complained of extremely high levels of reinvestment risk, of their inability to easily and cheaply reinvest the principal of bonds and mortgages when they were repaid. Often, lenders urged good borrowers not to repay (but to continue to service their obligations, of course). Another not mutually exclusive possibility is that the long-term price level stability engendered by the specie standard made the interest rate less volatile. The expectation was that the interest rate would not long stray from its long-term tendency.
The neat thing about this theory is that it reveals the yield curve as the market’s prediction of future short-term interest rates, making it, by extension, an economic forecasting tool. Where the curve slopes sharply upward, the market expects future short-term interest rates to rise. Where it slopes slightly upward, the market expects future short-term rates to remain the same. Where the curve is flat, rates, it is thought, will fall moderately in the future. Inversion of the curve means short-term interest rates should fall sharply, as in the numerical example above. The simplest way to remember this is to realize that the prediction equals the yield curve minus ρn, the term premium.
Empirical research suggests that the yield curve is a good predictor of future interest rates in the very short term, the next few months, and the long term, but not in between. Part of the difficulty is that ρn is not well understood nor is it easily observable. It may change over time and/or not increase much from one maturity to the next on the short end of the curve. Nevertheless, economic forecasters use the yield curve to make predictions about inflation and the business cycle. A flat or inverted curve, for instance, portends lower short-term interest rates in the future, which is consistent with a recession but also with lower inflation rates, as we learned in Chapter 5 "The Economics of Interest-Rate Fluctuations". A curve sloped steeply upward, by contrast, portends higher future interest rates, which might be brought about by an increase in inflation rates or an economic boom.
Time once again to ensure that we’re on the same page, er, Web site.
Exercises
-
What does the following yield curve tell us?
Treasury yield curve for January 20, 2006.
Maturity Yield (%) 1 month 3.95 3 months 4.35 6 months 4.48 1 year 4.44 2 years 4.37 3 years 4.32 5 years 4.31 7 years 4.32 10 years 4.37 20 years 4.59 -
What does the following yield curve predict?
Treasury yield curve for July 31, 2000.
Maturity Yield (%) 1 month 3 months 6.20 6 months 6.35 1 year 2 years 6.30 3 years 6.30 5 years 6.15 7 years 10 years 6.03 30 years 5.78
Key Takeaways
- The term structure of interest rates explains why bonds issued by the same economic entity but of different maturities sometimes have different yields.
- Plotting yield against maturity produces an important analytical tool called the yield curve.
- The yield curve is a snapshot of the term structure of interest rates created by plotting yield against maturity for a single class of bonds, like Treasuries or munis, which reveals the market’s prediction of future short-term interest rates, and thus, by extension, can be used to make inferences about inflation and business cycle expectations.