This is “Review And Practice”, section 6.4 from the book Economics Principles (v. 1.1). For details on it (including licensing), click here.
For more information on the source of this book, or why it is available for free, please see the project's home page. You can browse or download additional books there. To download a .zip file containing this book to use offline, simply click here.


6.4 Review And Practice
Summary
Economists insist that individuals do not make choices willy-nilly. Rather, economists assume that individuals make choices in a purposeful way, one that seeks the maximum value for some objective. We assume that consumers seek to maximize utility and that firms seek to maximize profits.
Whatever is being maximized, choices are based on the marginal decision rule. Following this rule results in an allocation that achieves the greatest degree of utility or profit possible.
If utility- and profit-maximizing choices are made in the context of a price system that confronts decision makers with all of the costs and all of the benefits of their choices, the allocation of resources will be efficient. An efficient allocation is one that maximizes the net benefit of every activity. The concepts of consumer and producer surplus show us how this net benefit is shared. Equity is a separate issue, one that calls for a normative evaluation of the fairness of the distribution of income.
The allocation of resources will be inefficient in the absence of competitive markets. It will also be inefficient if property rights are not exclusive and transferable. These two conditions break down when there are public goods, common property resources, or external benefits or costs. In each of these cases, public sector intervention may improve the efficiency of resource allocation. When a market fails to achieve the efficient solution, net benefit falls short of the maximum possible. Deadweight loss is the amount by which net benefit falls below the net benefit possible at the efficient solution.
Concept Problems
- What is achieved by selecting the quantity of an activity at which marginal benefit equals marginal cost?
- Suppose the marginal benefit of an activity exceeds the marginal cost. What does the marginal decision rule say a maximizing decision maker will do?
- Suppose you are a discus hurler and your goal is to maximize the distance you achieve. You “produce” discus hurls by practicing. The total benefit of practice is distance achieved, and the input that achieves this distance is hours of practice. Describe the total benefit curve of practice. What point on the curve would you select?
-
This chapter argues that consumers maximize utility and firms maximize profits. What do you suppose each of the following might be presumed to maximize?
- A minister or rabbi
- A United States Senator
- The manager of a major league baseball team
- The owner of a major league baseball team
- The director of a charitable organization
-
For each of the following goods, indicate whether exclusive, transferable property rights exist and whether the good poses a problem for public policy. If it does, does the problem relate to a problem of property rights?
- Clean air
- Tomatoes
- Housing
- Blue whales
- The dry-cleaning industry is a major source of air pollution. What can you conclude about the price and output of dry-cleaning services?
- Economists often recommend that polluters such as dry-cleaning establishments be charged fees for the pollution they emit. Critics of this idea respond that the establishments would simply respond by passing these charges on to their customers, leaving the level of pollution unchanged. Comment on this objection.
- Government agencies often require that children be inoculated against communicable diseases such as polio and measles. From the standpoint of economic efficiency, is there any justification for such a requirement?
-
Which of the following goods or services are public? Why or why not?
- Libraries
- Fire protection
- Television programs
- Health care
- Water for household consumption
- If a village in Botswana is granted several licenses to kill elephants, how does this give it an incentive to preserve elephants and increase the size of the herd? How does the international ban on ivory sales affect the incentive in Botswana to preserve the elephant?
- The number of fish caught in the ocean has fallen in recent years partly as a result of more intensive fishing efforts and the use of more sophisticated equipment. Fish in the ocean are a common property resource. How might this fact be related to declining fish catches? How do you think this drop in the catch affects the price of seafood?
Numerical Problems
-
Joe Higgins is thinking about how much time to spend studying for a biology exam tomorrow. Using “utility units” he measures the benefits and costs of study; his calculations are shown in the following table.
Figure 6.19
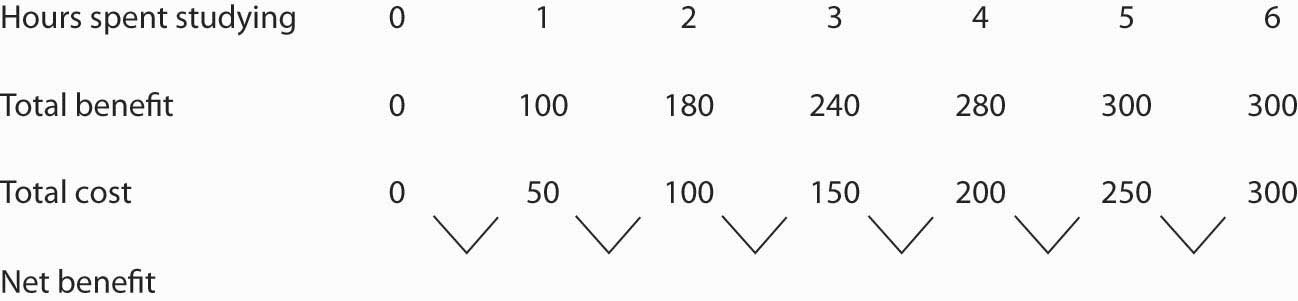
- Fill in the fourth row for net benefit in the table. Use the midpoint convention to emphasize that the net benefit is a marginal value showing the gain as hours spent increase by one-hour increments.
- Using a graph similar to Panel (a) of Figure 6.1 "The Benefits of Studying Economics" show the marginal benefit curve and verify that the area under the curve at 3 hours of study corresponds to the total benefit of that much study. (Hint: Remember that marginal values are plotted at the midpoints of the corresponding intervals on the horizontal axis.)
- Use a graph similar to Panel (b) of Figure 6.1 "The Benefits of Studying Economics" to show the marginal cost curve and verify that the area under the curve at 3 hours of study corresponds to the total cost of that much study.
- Use a graph similar to Panel (a) of Figure 6.6 "Using Marginal Benefit and Marginal Cost Curves to Determine Net Benefit" to combine the marginal benefit and marginal cost curves you drew in parts (a) and (b).
- Based on the marginal decision rule, how many hours should Joe spend studying for his biology exam?
-
Now suppose some friends of Joe’s call to say they are having a party tonight. Joe calculates that the party is now his best alternative to study, and he increases his estimate of the cost of each hour of study. One hour of study now costs 70; two hours cost 140; three hours 210, four hours 280; five hours 350; and six hours 470.
- Draw the new marginal benefit and marginal cost curves as in Problem 1, part (d):
- Based on the marginal decision rule, identify the new solution that maximizes the net benefit of study time.
-
The local gasoline market in a particular city has demand and supply curves given by the following data. (All quantities are in millions of gallons per month.)
Price per gallon $1.00 $1.50 $2.00 $2.50 $3.00 $3.50 $4.00 Quantity demanded 6 5 4 3 2 1 0 Quantity supplied 0 1 2 3 4 5 6 - Plot the demand and supply curves, and determine the equilibrium price and quantity.
- Show the areas of consumer and producer surplus.
- Now suppose that the community determines that each gallon of gasoline consumed imposes $0.50 in pollution costs. Accordingly, a $0.50-per-gallon tax is imposed. The tax is imposed on sellers of gasoline, and it has the effect of increasing by $0.50 the price required to induce the quantities supplied in the table. For example, a price of $2.00 is now required for a quantity of 1 million gallons to be supplied each month. Plot the new supply curve.
- Approximate the new equilibrium price and output.
- Does the price increase by the full amount of the tax? If not, explain why.
- Would your answer be different if the demand for gasoline were perfectly inelastic?
-
The flu vaccination market has the demand and supply curves given by the following data. (All quantities are in thousands.)
Price per vaccination $10 $15 $20 $25 $30 Quantity demanded 90 80 70 60 50 Quantity supplied 50 60 70 80 90 - Plot the demand and supply curves, and determine the equilibrium price and quantity.
- Show the areas of consumer and producer surplus.
- Now suppose that each vaccination given generates an external benefit, as those who do not get vaccinated are less likely to get the flu when others do get vaccinated. As a result, suppliers receive a $10 subsidy from the government for each vaccine. For example, if consumers pay $10 per vaccination, suppliers receive $20, so only $10 from consumers is required to induce suppliers to offer 70,000 vaccinations per month. Plot the new supply curve.
- Determine the new equilibrium price and quantity.
- Does the price fall by the full amount of the subsidy? If not, explain why.
- What is the total amount that consumers now pay for the new equilibrium quantity of vaccinations?
- What is the total subsidy that suppliers receive from the government at the new equilibrium quantity of vaccinations?
-
Given the following information about the supply of and demand for apples:
Price per pound Quantity demanded (pounds per month) Quantity Supplied (pounds per month $0.50 12,000 0 0.75 10,000 2,000 1.00 8,000 4,000 1.25 6,000 6,000 1.50 4,000 8,000 1.75 2,000 10,000 2.00 0 12,000 - Draw a graph similar to Figure 6.12 "Net Benefit: The Sum of Consumer and Producer Surplus"
- Assuming the market for apples meets the efficiency condition, show the equilibrium price and quantity that maximizes net benefit to society.
- Identify the area of consumer surplus and the area of producer surplus.