This is “International Trade”, chapter 17 from the book Economics Principles (v. 1.0). For details on it (including licensing), click here.
For more information on the source of this book, or why it is available for free, please see the project's home page. You can browse or download additional books there. To download a .zip file containing this book to use offline, simply click here.


Chapter 17 International Trade
Start Up: Trade Winds
Rapid increases in the flow of goods and services between vastly different nations and cultures have changed what people eat, how they dress, and even how they communicate with one another. For you, increased trade has meant greater choice of what to buy and often lower prices.
Look through your room. Chances are it is full of items from all around the world. The relatively free trade that exists today provides you with expanded choices. No one forced you to buy that shirt from India or that CD player from Japan. Presumably you bought them because you preferred them to other shirts and CD players you might have bought, perhaps because they had certain characteristics—style, color, perceived quality, or price—that you favored.
Your gains are being experienced worldwide because the winds of international trade have blown generally freer in the past decades. Nations all over the world have dramatically lowered the barriers they impose on the products of other countries.
One region that was once closed to virtually all trade but is now open is Eastern Europe and the countries that made up the former Soviet Union. A key part of these countries’ attempts to create market capitalist economic systems has been the opening of their borders to international trade.
In Western Europe, the members of the European Union (EU) have eliminated virtually every restriction on the free flow of goods and services among them. A truckload of electronic equipment from Italy now passes through France on its way to Spain with no more restrictions than would be encountered by a truck delivering goods from Michigan to Illinois. The purchase of the equipment can even be arranged using a new currency, the euro, which has been adopted by most EU nations.
Canada, Mexico, and the United States, while not adopting a common currency, have created a similar free trade area, the North American Free Trade Area (NAFTA). In addition, the 18 member nations of the Asian-Pacific Economic Cooperation organization (APEC) agreed in 1994 to forge a free trade area among industrialized nations such as the United States and Japan by 2010. Other member nations such as Mexico and China agreed to participate by 2020.
NAFTA has resulted in a dramatic increase in trade between Canada, the United States, and Mexico. Since NAFTA’s creation in 1994, employment in all three countries has risen substantially. Those increases in employment cannot necessarily be attributed to NAFTA, but the fact that they have occurred flies in the face of the arguments when NAFTA was first proposed that it would lead to a reduction in U.S. employment.
President Bush proposed and Congress passed in 2005 the creation of a Central American Free Trade Association (CAFTA) that would create a free trade area south of Mexico and linked to the United States. It abolishes most tariff restrictions between the United States and the countries of Central America—Costa Rica, the Dominican Republic, El Salvador, Guatemala, Honduras, and Nicaragua. The six countries make up the second-largest export market for the United States in Latin America, behind Mexico. President Bush has also proposed extending the free trade zone throughout the Western Hemisphere.
And, in 1995, the World Trade Organization (WTO) was established to “help trade flow smoothly, freely, fairly and predictably” among member nations. In 2008, it had 153 member countries. Since World War II, the General Agreement on Tariffs and Trade (GATT)—WTO’s predecessor—and WTO have generated a series of agreements that slashed trade restraints among members. These agreements have helped propel international trade, which in 2006 was more than 35 times its level in 1950, but the negotiations leading to these agreements have always been protracted and tumultuous and issues of nationalism and patriotism are often not far from the surface. The current and ninth round of trade talks are referred to as the Doha Round, because they were officially launched in Doha, Qatar, in 2001. In mid-2008, talks were still mired in controversy over the removal of agricultural export subsidies and lowering of trade barriers of various kinds.
Why have so many countries moved to make trade freer? What are the effects of free trade? Why do efforts to eliminate trade restrictions meet with resistance? Why do many nations continue to impose barriers against some foreign goods and services? How do such barriers affect the economy? How do such barriers affect you?
This chapter will answer these questions by developing a model of international trade based on the idea of comparative advantage, introduced in an earlier chapter. The model predicts that free international trade will benefit the countries that participate in it. Free trade does not benefit every individual, however. Most people benefit from free trade, but some are hurt. We will then look at the phenomenon of two-way trade, in which countries both import and export the same goods. The last part of the chapter examines the effects of trade restrictions and evaluates the arguments made for such restrictions. Economists tend to be skeptical of their validity.
17.1 The Gains from Trade
Learning Objectives
- Differentiate between an absolute advantage in producing some good and a comparative advantage.
- Explain and illustrate the conditions under which two countries can mutually benefit from trading with each other.
- Explain and illustrate how the terms of trade determine the extent to which each country specializes.
- Explain and illustrate the mutual benefits of trade.
To model the effects of trade, we begin by looking at a hypothetical country that does not engage in trade and then see how its production and consumption change when it does engage in trade.
Production and Consumption Without International Trade
Suppose the hypothetical country of Roadway is completely isolated from the rest of the world. It neither exports nor imports goods and services. We shall use the production possibilities model to analyze Roadway’s ability to produce goods and services.
A production possibilities curve illustrates the production choices available to an economy. Recall that the production possibilities curve for a particular country is determined by the factors of production and the technology available to it.
Figure 17.1 "Roadway’s Production Possibilities Curve" shows a production possibilities curve for Roadway. We assume that it produces only two goods—trucks and boats. Roadway must be operating somewhere on its production possibilities curve or it will be wasting resources or engaging in inefficient production. If it were operating inside the curve at a point such as D, then a combination on the curve, such as B, would provide more of both goods (Roadway produces 3,000 more trucks and 3,000 more boats per year at B than at D). At any point inside the curve, Roadway’s production would not be efficient. Point E suggests an even higher level of output than points A, B, or C, but because point E lies outside Roadway’s production possibilities curve, it cannot be attained.
Figure 17.1 Roadway’s Production Possibilities Curve
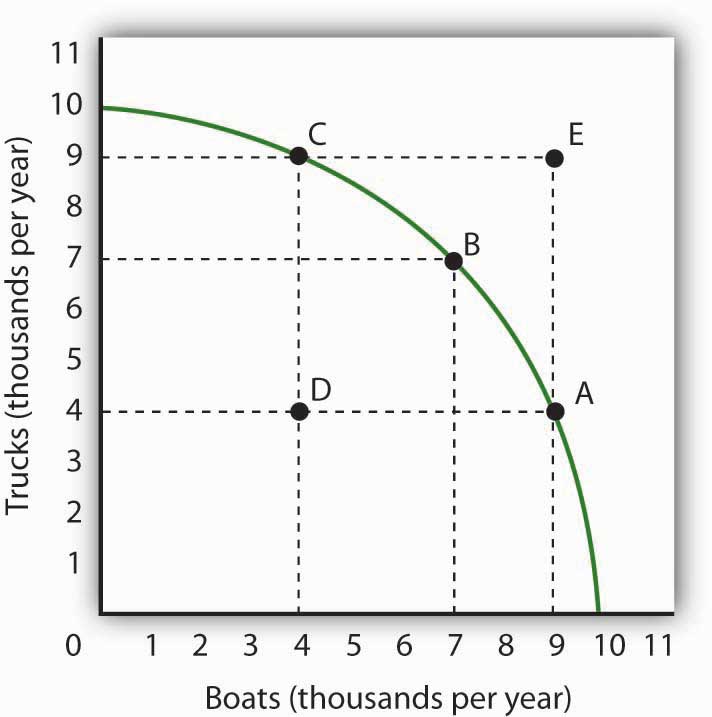
The production possibilities curve for Roadway shows the combinations of trucks and boats that it can produce, given the factors of production and technology available to it. To maximize the value of total production, Roadway must be operating somewhere along this curve. Production at point D implies that Roadway is failing to use its resources fully and efficiently; production at point E is unobtainable.
We have learned that the absolute value of the slope of a production possibilities curve at any point gives the quantity of the good on the vertical axis that must be given up to produce an additional unit of the good on the horizontal axis. It thus gives the opportunity cost of producing another unit of the good on the horizontal axis.
Figure 17.2 Measuring Opportunity Cost in Roadway
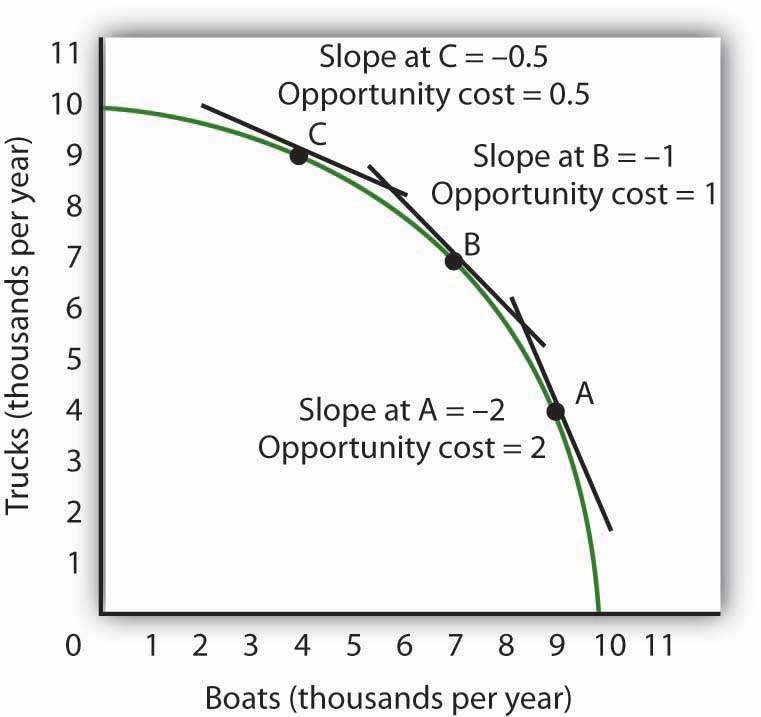
The slope of the production possibilities curve at any point is equal to the slope of a line tangent to the curve at that point. The absolute value of the slope equals the opportunity cost of increased boat production. Moving down and to the right along its production possibilities curve, the opportunity cost of boat production increases; this is an application of the law of increasing opportunity cost.
Figure 17.2 "Measuring Opportunity Cost in Roadway" shows the opportunity cost of producing boats at points A, B, and C. Recall that the slope of a curve at any point is equal to the slope of a line drawn tangent to the curve at that point. The slope of a line tangent to the production possibilities curve at point B, for example, is −1. The opportunity cost of producing one more boat is thus one truck. As the law of increasing opportunity costs predicts, in order to produce more boats, Roadway must give up more and more trucks for each additional boat. Roadway’s opportunity cost of producing boats increases as we travel down and to the right on its production possibilities curve.
Comparative Advantage
People participate in international trade because they make themselves better off by doing so. In this section we will find that countries that participate in international trade are able to consume more of all goods and services than they could consume while producing in isolation from the rest of the world.
Suppose the world consists of two countries, Roadway and Seaside. Their production possibilities curves are given in Figure 17.3 "Comparative Advantage in Roadway and Seaside". Roadway’s production possibilities curve in Panel (a) is the same as the one in Figure 17.1 "Roadway’s Production Possibilities Curve" and Figure 17.2 "Measuring Opportunity Cost in Roadway". Seaside’s curve is given in Panel (b).
Figure 17.3 Comparative Advantage in Roadway and Seaside
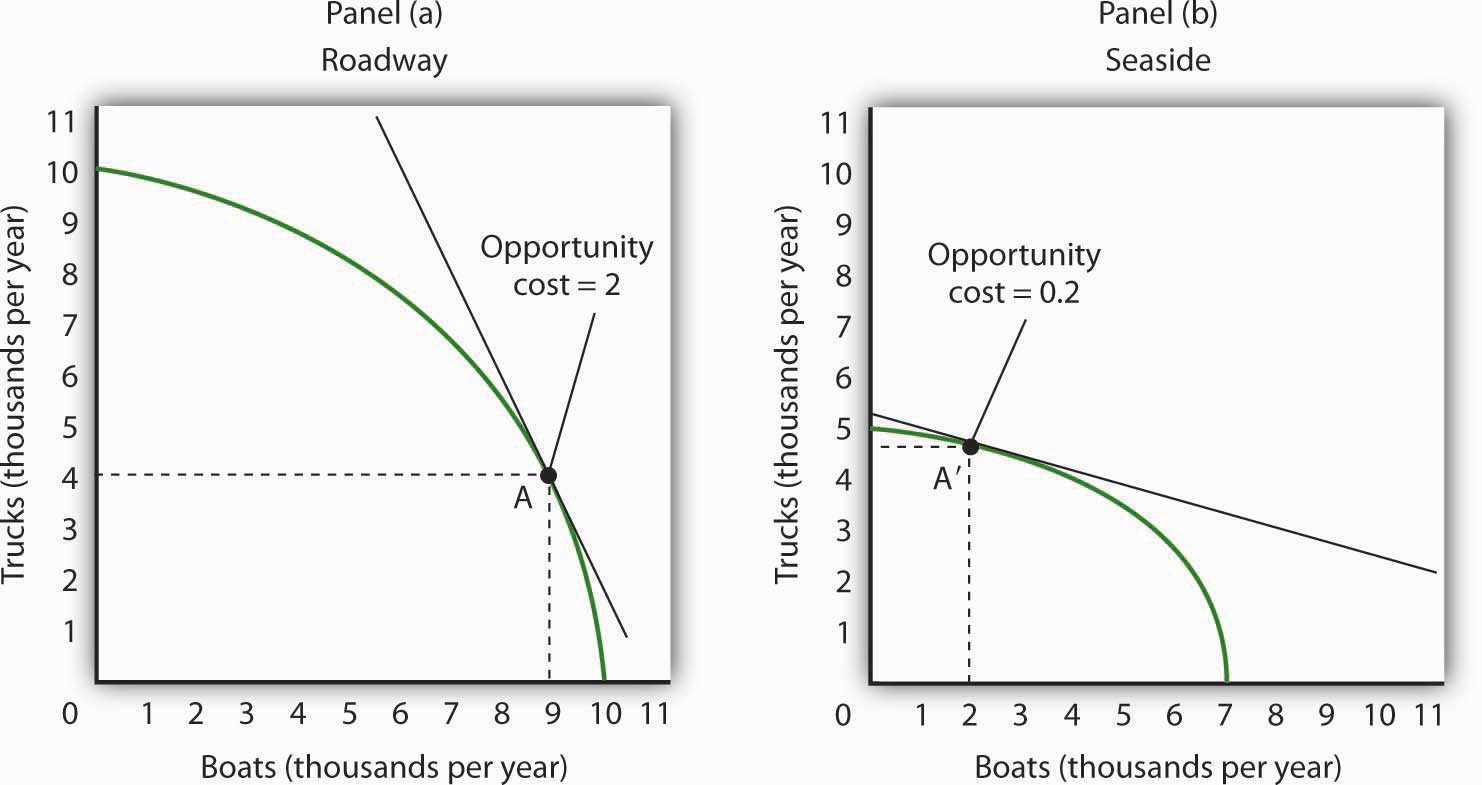
Roadway’s production possibilities curve is given in Panel (a); it is the same one we saw in Figure 17.1 "Roadway’s Production Possibilities Curve" and Figure 17.2 "Measuring Opportunity Cost in Roadway". The production possibilities curve for a second hypothetical country, Seaside, is given in Panel (b). If no trade occurs between the two countries, suppose that Roadway is at Point A and that Seaside is at Point A′. Notice that the opportunity cost of an additional boat in Roadway is two trucks, while the opportunity cost of an additional boat in Seaside is 0.2 trucks. Clearly, Seaside has a comparative advantage in the production of boats.
Each country produces two goods, boats and trucks. Suppose no trade occurs between the two countries and that they are each currently operating on their production possibilities curves at points A and A′ in Figure 17.3 "Comparative Advantage in Roadway and Seaside". We will assume that the two countries have chosen to operate at these points through the workings of demand and supply. That is, resources have been guided to their current uses as producers have responded to the demands of consumers in the two countries. In turn, consumers have responded to the prices charged by sellers of boats and trucks.
The two countries differ in their respective abilities to produce trucks and boats. As we can see by looking at the intersection of the production possibilities curves with the vertical axes in Figure 17.3 "Comparative Advantage in Roadway and Seaside", Roadway is able to produce more trucks than Seaside. If Roadway concentrated all of its resources on the production of trucks, it could produce 10,000 trucks per year. Seaside could produce only 5,000. Now look at the intersection of the production possibilities curves with the horizontal axes. If Roadway concentrated all of its resources on the production of boats, it could produce 10,000 boats. Seaside could produce only 7,000 boats. Because Roadway is capable of producing more of both goods, we can infer that it has more resources or is able to use its labor and capital resources more productively than Seaside. When an economy or individual can produce more of any good per unit of labor than another country or individual, that country or person is said to have an absolute advantage.Situation in which an economy or individual can produce more of any good per unit of labor than another country or individual.
Despite the fact that Roadway can produce more of both goods, it can still gain from trade with Seaside—and Seaside can gain from trade with Roadway. The key lies in the opportunity costs of the two goods in the two countries. The country with a lower opportunity cost for a particular good or service has a comparative advantage in producing it and will export it to the other country.
We can determine opportunity costs in the two countries by comparing the slopes of their respective production possibilities curves at the points where they are producing. At point A in Panel (a) of Figure 17.3 "Comparative Advantage in Roadway and Seaside", one additional boat costs two trucks in Roadway; that is its opportunity cost. At point A′ in Panel (b), 1 additional boat in Seaside costs only 0.2 truck. Alternatively, we can ask about the opportunity cost of an additional truck. In Roadway, an additional truck costs 0.5 boats. In Seaside, it costs five boats. Roadway thus has a comparative advantage in producing trucks; Seaside has a comparative advantage in producing boats. This situation is suggested pictorially in Figure 17.4 "A Picture of Comparative Advantage in Roadway and Seaside".
Figure 17.4 A Picture of Comparative Advantage in Roadway and Seaside
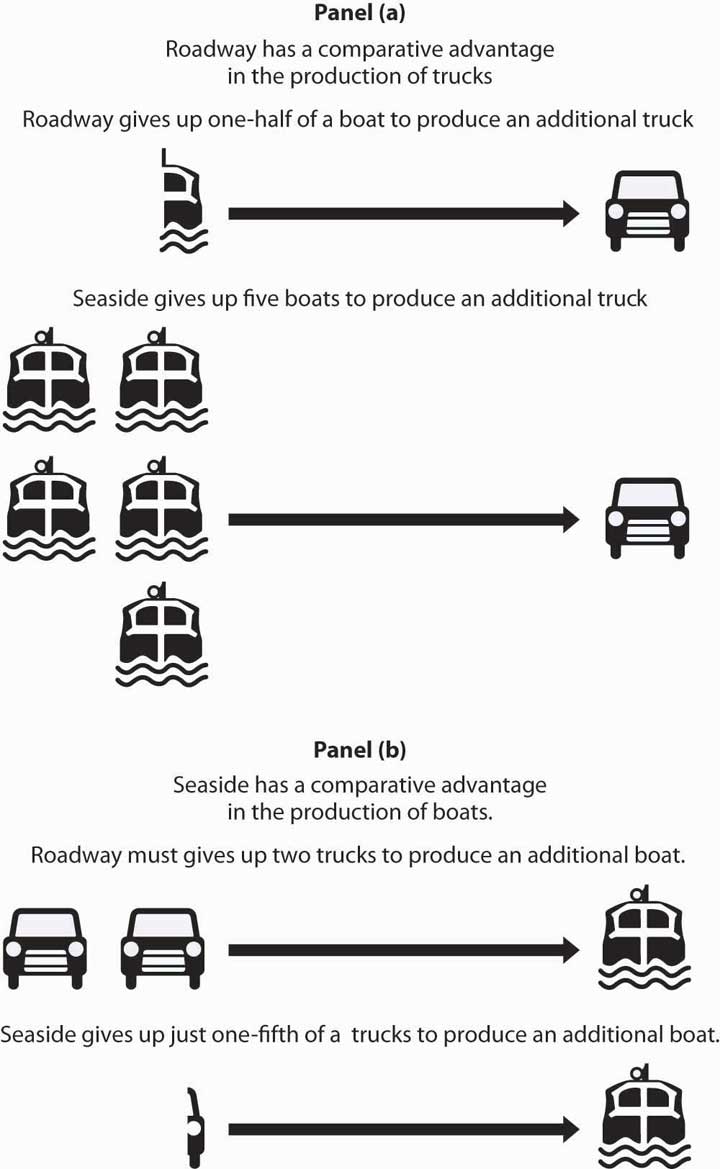
The exhibit gives a picture of Roadway’s comparative advantage in trucks and Seaside’s comparative advantage in boats.
Specialization and the Gains from Trade
We have so far assumed that no trade occurs between Roadway and Seaside. Now let us assume that trade opens up. The fact that the opportunity costs differ between the two countries suggests the possibility for mutually advantageous trade. The opportunities created by trade will induce a greater degree of specialization in both countries, specialization that reflects comparative advantage.
Trade and Specialization
Before trade, truck producers in Roadway could exchange a truck for half a boat. In Seaside, however, a truck could be exchanged for five boats. Once trade opens between the two countries, truck producers in Roadway will rush to export trucks to Seaside.
Boat producers in Seaside enjoy a similar bonanza. Before trade, one of their boats could be exchanged for one-fifth of a truck. By shipping their boats to Roadway, they can get two trucks for each boat. Boat producers in Seaside will rush to export boats to Roadway.
Once trade between Roadway and Seaside begins, the terms of tradeThe rate at which a country can trade domestic products for imported products., the rate at which a country can trade domestic products for imported products, will seek market equilibrium. The final terms of trade will be somewhere between one-half boats for one truck found in Roadway and five boats for one truck in Seaside. Suppose the terms of trade are one boat for one truck. (How the specific terms of trade are actually determined is not important for this discussion. It is enough to know that the final terms of trade will lie somewhere between Seaside’s and Roadway’s opportunity costs for boat and truck production.) Roadway’s truck producers will now get one boat per truck—a far better exchange than was available to them before trade.
Roadway’s manufacturers will move to produce more trucks and fewer boats until they reach the point on their production possibilities curve at which the terms of trade equals the opportunity cost of producing trucks. That occurs at point B in Panel (a) of Figure 17.5 "International Trade Induces Greater Specialization"; Roadway now produces 7,000 trucks and 7,000 boats per year.
Figure 17.5 International Trade Induces Greater Specialization
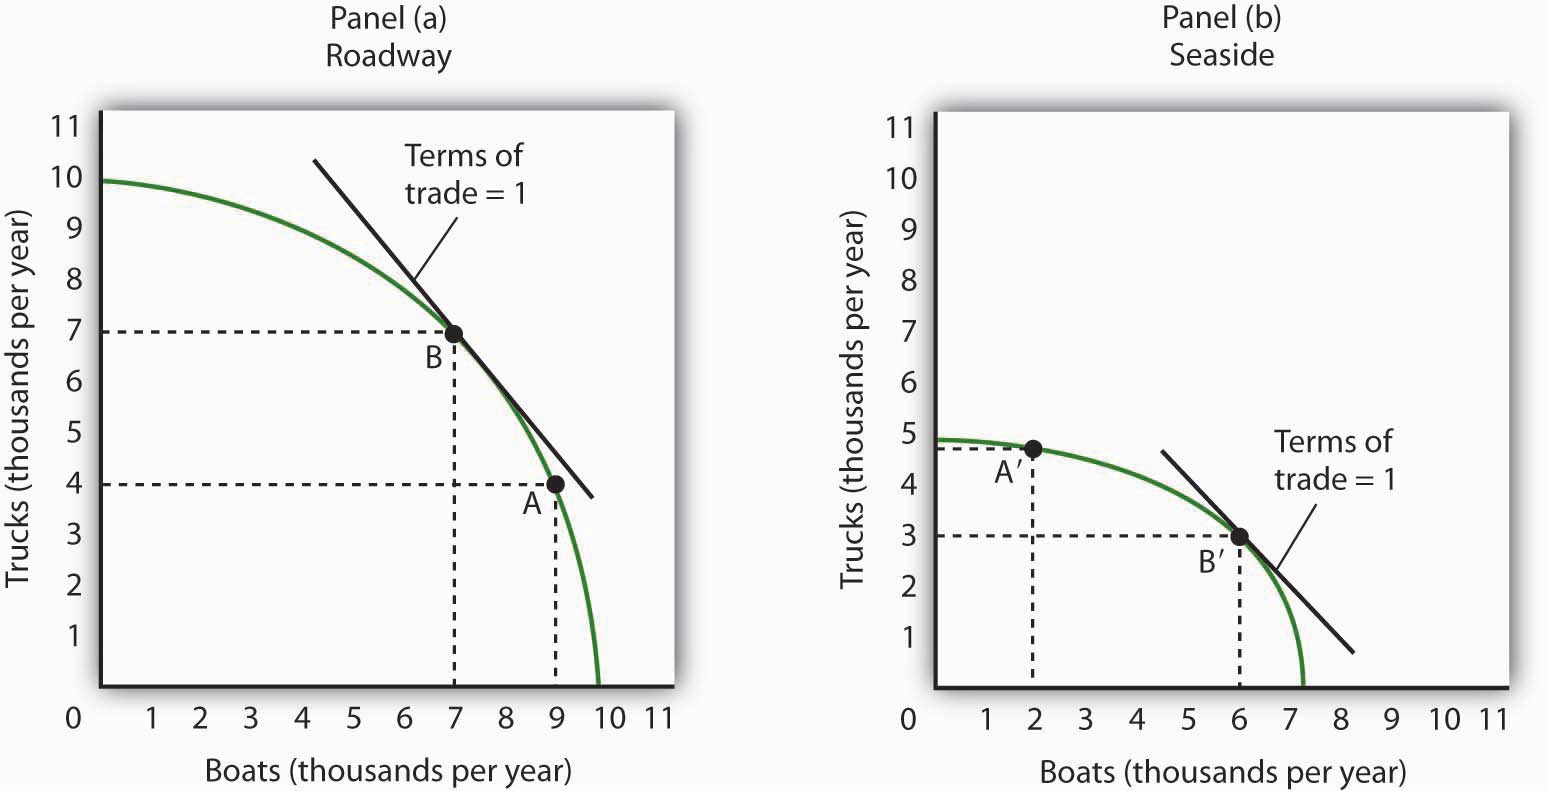
Before trade, Roadway is producing at point A in Panel (a) and Seaside is producing at point A′ in Panel (b). The terms of trade are one, meaning that one boat exchanges for one truck. Roadside moves along its production possibilities curve to point B, at which the curve has a slope of −1. Roadside will produce more trucks (and fewer boats). Seaside moves along its production possibilities curve to point B′, at which the slope equals −1. Seaside will produce more boats (and fewer trucks). Trade leads each country in the direction of producing more of the good in which it has a comparative advantage.
Similarly, Seaside will specialize more in boat production. As shown in Panel (b) of Figure 17.5 "International Trade Induces Greater Specialization", producers will shift resources out of truck production and into boat production until they reach the point on their production possibilities curve at which the terms of trade equal the opportunity cost of producing boats. This occurs at point B′; Seaside produces 3,000 trucks and 6,000 boats per year.
We see that trade between the two countries causes each country to specialize in the good in which it has a comparative advantage. Roadway produces more trucks, and Seaside produces more boats. The specialization is not, however, complete. The law of increasing opportunity cost means that, as an economy moves along its production possibilities curve, the cost of additional units rises. An economy with a comparative advantage in a particular good will expand its production of that good only up to the point where its opportunity cost equals the terms of trade.
As a result of trade, Roadway now produces more trucks and fewer boats. Seaside produces more boats and fewer trucks. Through exchange, however, both countries are likely to end up consuming more of both goods.
Figure 17.6 "The Mutual Benefits of Trade" shows one such possibility. Suppose Roadway ships 2,500 trucks per year to Seaside in exchange for 2,500 boats, as shown in the table in Figure 17.6 "The Mutual Benefits of Trade". Roadway thus emerges with 4,500 trucks (the 7,000 it produces at B minus the 2,500 it ships) and 9,500 boats. It has 500 more of each good than it did before trade. The precise amounts of each good shipped will depend on demand an supply. The essential point is that Roadway will produce more of the good—trucks—in which it has a comparative advantage. It will export that good to a country, or countries, that has a comparative advantage in something else.
Figure 17.6 The Mutual Benefits of Trade
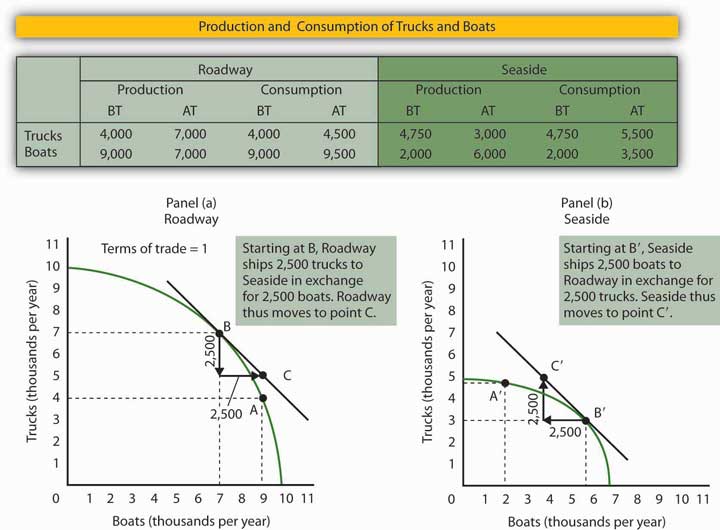
Roadway and Seaside each consume more of both goods when there is trade between them. The table shows values of production before trade (BT) and after trade (AT). Here, the terms of trade are one truck in exchange for one boat. As shown in Panel (a) and in the exhibit’s table, Roadway exports 2,500 trucks to Seaside in exchange for 2,500 boats and ends up consuming at point C, which is outside its production possibilities curve. Similarly, in Panel (b), Seaside ends up consuming at point C′, which is outside its production possibilities curve. Trade allows both countries to consume more than they are capable of producing.
How does Seaside fare? When trade began, factors of production shifted into boat production, in which Seaside had a comparative advantage. Seaside tripled its production of boats—from 2,000 per year to 6,000 per year. It sends 2,500 of those boats to Roadway, so it ends up with 3,500 boats per year. It reduces its production of trucks to 3,000 per year, but receives 2,500 more from Roadway. That leaves it with 5,500. Seaside emerges from the opening of trade with 1,500 more boats and 750 more trucks than it had before trade.
As Roadway trades trucks for boats, its production remains at point B. But it now consumes combination C; it has more of both goods than it had at A, the solution before trade. Seaside’s production remains at point B′, but it now consumes at point C′, where it has more trucks and more boats than it had before trade.
Although all countries can increase their consumption through trade, not everyone in those countries will be happy with the result. In the case of Roadway and Seaside, for example, some boat producers in Roadway will be displaced as cheaper boats arrive from Seaside. Some truck producers in Seaside will be displaced as cheaper trucks arrive from Roadway. The production possibilities model suggests that the resources displaced will ultimately find more productive uses. They will produce trucks in Roadway and boats in Seaside. But there will be a period of painful transition as workers and owners of capital and natural resources move from one activity to another. That transition will be completed when the two countries are back on their respective production possibilities curves. Full employment will be restored, which means both countries will be back at the same level of employment they had before trade.
Finally, note the fact that the two countries end up at C (Panel (a)) and C′ (Panel (b)). These points lie outside the production possibilities curves of both countries. Notice that each country produces on its production possibilities curve, but international trade allows both countries to consume a combination of goods they would be incapable of producing!
We see this same phenomenon in individual households. Each household specializes in an activity in which it has a comparative advantage. For one household, that may be landscaping, for another, it may be the practice of medicine, for another it may be the provision of childcare. Whatever the activity, specialization allows the household to earn income that can be used to purchase housing, food, clothing, and so on. Imagine for a moment how your household would fare if it had to produce every good or service it consumed. The members of such a household would work very hard, but it is inconceivable that the household could survive if it relied on itself for everything it consumed. By specializing in the activity in which each individual has a comparative advantage, people are able to consume far more than they could produce themselves.
Despite the transitional problems affecting some factors of production, the potential benefits from free trade are large. For this reason, most economists are strongly in favor of opening markets and extending international trade throughout the world. The economic case has been a powerful force in moving the world toward freer trade.
Key Takeaways
- In order to maximize the value of its output, a country must be producing a combination of goods and services that lies on its production possibilities curve.
- Suppose two countries each produce two goods and their opportunity costs differ. If this is the case, there is an opportunity for trade between the two countries that will leave both better off.
- International trade leads countries to specialize in goods and services in which they have a comparative advantage.
- The terms of trade determine the extent to which each country will specialize. Each will increase production of the good or service in which it has a comparative advantage up to the point where the opportunity cost of producing it equals the terms of trade.
- Free international trade can increase the availability of all goods and services in all the countries that participate in it. Trade allows countries to consume combinations of goods and services they would be unable to produce.
- While free trade increases the total quantity of goods and services available to each country, there are both winners and losers in the short run.
Try It!
Suppose the world consists of two countries, Alpha and Beta. Both produce only two goods, computers and washing machines. Suppose that Beta is much more populous than Alpha, but because workers in Alpha have more physical and human capital, Alpha is able to produce more of both goods than Beta.
Specifically, suppose that if Alpha devotes all its factors of production to computers, it is able to produce 10,000 per month, and if it devotes all its factors of production to washing machines, it is able to produce 10,000 per month. Suppose the equivalent amounts for Beta are 8,000 computers and 8,000 washing machines per month. Sketch typical, bowed-out production possibilities curves for the two countries. (You only have numbers for the end points of the production possibilities curves. Use them to sketch curves of a typical shape. Place washing machines on the vertical axis and computers on the horizontal axis.)
Assume the computers and washing machines produced in the two countries are identical. Assume that no trade occurs between the two countries. In Alpha, at the point on its production possibilities curve at which it is operating, the opportunity cost of an additional washing machine is 0.5 computers. At the point on its production possibilities curve at which it is operating, the opportunity cost of an additional washing machine in Beta is 3.5 computers. How many computers exchange for a washing machine in Alpha? Beta?
Now suppose trade occurs, and the terms of trade are two washing machines for one computer. How will the production of the two goods be affected in each economy? Show your results graphically and explain them.
Case in Point: The U.S. Comparative Advantage in High-Tech Capital Goods and Services
Figure 17.7

© 2010 Jupiterimages Corporation
A flight across the United States almost gives a birds-eye view of an apparent comparative advantage for the United States. One sees vast expanses of farmland. Surely agricultural goods represent an important comparative advantage for the United States.
Indeed, agricultural goods did once dominate American exports. Today, however, agricultural goods make up a small percentage of U.S. exports, though the amount of agricultural goods that the United States does export continues to grow.
Doomsayers suggest that our comparative advantage in the twenty-first century will lie in flipping hamburgers and sweeping the floors around Japanese computers. This forecast makes for good jokes, but it hardly squares with the facts. Recently America’s comparative advantages lie in certain stages of the production process and in areas of the service sector.
According to economist Catherine Mann of the Brookings Institution, “the United States has the comparative advantage in producing and exporting certain parts of the production process (the high-valued processor chips, the innovative and complex software, and the fully assembled product), but has relinquished parts of the production process to other countries where that stage of processing can be completed more cheaply (memory chips, ‘canned’ software, and most peripherals).”
In the area of services, Mann reports, the United States excels primarily in a rather obscure sounding area called “other private services,” which, she contends, corresponds roughly to new economy services. Other private services include such areas as education, financial services, and business and professional services. This category of services has grown relentlessly over the past 15 years, despite cyclical downturns in other sectors. The United States developed its comparative advantage in these services as the share of services in the U.S. economy grew over time. She predicts that, as the economies of our trading partners grow, their demand for services will also increase. So, from a policy perspective, it is important for the U.S. to promote trading policies that will keep this sector open.
Sources: Catherine L. Mann, “Is the U.S. Trade Deficit Sustainable?” Washington, D.C: Brookings Institution, 1999; Catherine L. Mann, “The U.S. Current Account, New Economy Services, and Implications for Sustainability,” Review of International Economics 12:2 (May 2004): 262–76.
Answer to Try It! Problem
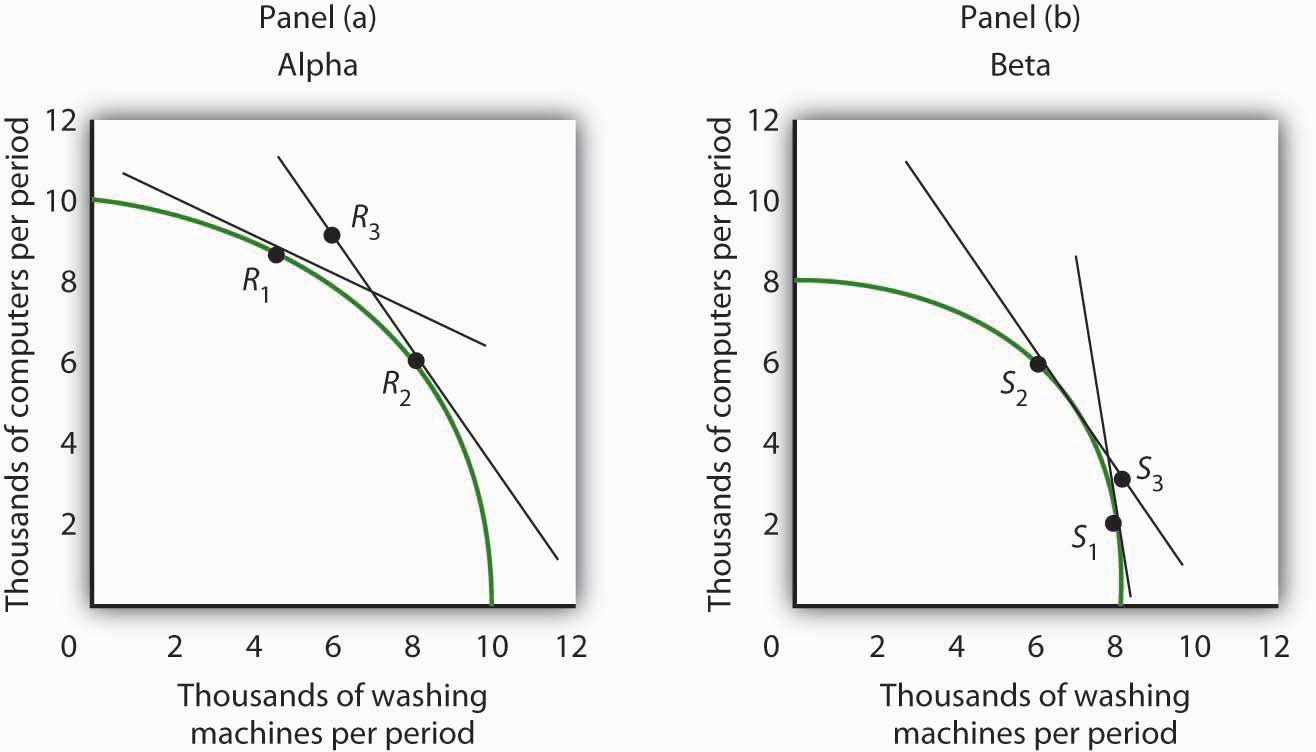
Here are sketches of possible production possibilities curves. Alpha is operating at a point such as R1, while Beta is operating at a point such as S1. In Alpha, 1 computer trades for 2 washing machines; in Beta, 3.5 computers trade for one washing machine. If trade opens between the two economies and the terms of trade are 1.5, then Alpha will produce more washing machines and fewer computers (moving to a point such as R2), while Beta will produce more computers and fewer washing machines (moving to a point such as S2). Though you were not asked to do this, the graphs demonstrate that it is possible that trade will result in both countries having more of both goods. If, for example, Alpha ships 2,000 washing machines to Beta in exchange for 3,000 computers, then the two economies will move to points R3 and S3, respectively, consuming more of both goods than they had before trade. There are many points along the tangent lines drawn at points R2 and S2 that are up to the right and therefore contain more of both goods. We have chosen points R3 and S3 at specific points, but any point along the tangent line that is up to the right from R1 and S1 would suffice to illustrate the fact that both countries can end up consuming more of both goods.
Figure 17.8
17.2 Two-Way Trade
Learning Objectives
- Distinguish between one-way trade and two-way trade.
- Explain why two-way trade may occur.
The model of trade presented thus far assumed that countries specialize in producing the good in which they have a comparative advantage and, therefore, engage in one-way trade. One-way (or interindustry) tradeSituation in which countries specialize in producing the goods in which they have a comparative advantage and then export those goods so they can import the goods in which they do not have a comparative advantage. occurs when countries specialize in producing the goods in which they have a comparative advantage and then export those goods so they can import the goods in which they do not have a comparative advantage.
However, when we look at world trade, we also see countries exchanging the same goods or goods in the same industry category. For example, the United States may both export construction materials to Canada and import them from Canada. American car buyers can choose Chevrolets, Fords, and Chryslers. They can also choose imported cars such as Toyotas. Japanese car buyers may choose to purchase Toyotas—or imported cars such as Chevrolets, Fords, and Chryslers. The United States imports cars from Japan and exports cars to it. Conversely, Japan imports cars from the United States and exports cars to it. International trade in which countries both import and export the same or similar goods is called two-way (or intraindustry) trade.International trade in which countries both import and export the same or similar goods.
Two reasons countries import and export the same goods are variations in transportation costs and seasonal effects. In the example of the United States and Canada both importing and exporting construction materials, transportation costs are the likely explanation. It may be cheaper for a contractor in northern Maine to import construction materials from the eastern part of Canada than to buy them in the United States. For a contractor in Vancouver, British Columbia, it may be cheaper to import construction materials from somewhere in the western part of the United States than to buy them in Canada. By engaging in trade, both the American and Canadian contractors save on transportation costs. Seasonal factors explain why the United States both imports fruit from and exports fruit to Chile.
Another explanation of two-way trade in similar goods lies in recognizing that not all goods are produced under conditions of perfect competition. Once this assumption is relaxed, we can explain two-way trade in terms of a key feature of monopolistic competition and some cases of oligopoly: product differentiation. Suppose two countries have similar endowments of factors of production and technologies available to them, but their products are differentiated—clocks produced by different manufacturers, for example, are different. Consumers in the United States buy some clocks produced in Switzerland, just as consumers in Switzerland purchase some clocks produced in the United States. Indeed, if two countries are similar in their relative endowments of factors of production and in the technologies available to them, two-way trade based on product differentiation is likely to be more significant than one-way trade based on comparative advantage.
In comparison to the expansion of one-way trade based on comparative advantage, expansion of two-way trade may entail lower adjustment costs. In the case of two-way trade, there is specialization within industries rather than movement of factors of production out of industries that compete with newly imported goods and into export industries. Such adjustments are likely to be faster and less painful for labor and for the owners of the capital and natural resources involved.
Because two-way trade often occurs in the context of imperfect competition, we cannot expect it to meet the efficiency standards of one-way trade based on comparative advantage and the underlying assumption of perfectly competitive markets. But, as we discussed in the chapter on imperfect competition, the inefficiency must be weighed against the benefits derived from product differentiation. People in the United States are not limited to buying only the kinds of cars produced in the United States, just as people in Japan are not limited to buying only cars produced in Japan.
Key Takeaways
- Specialization and trade according to comparative advantage leads to one-way trade.
- A large percentage of trade among countries with similar factor endowments is two-way trade, in which countries import and export the same or similar goods and services.
- Two-way trade is often explained by variations in transportation costs and seasonal factors; in similar goods it often occurs in the context of models of imperfect competition.
- Adjustment costs associated with expansion of two-way trade may be lower than for expansion of one-way trade.
Try It!
The text argues that two-way trade must be a result of transportation cost, climate, or imperfect competition. Explain why.
Case in Point: Two- Way Trade in Water: A Growth Industry
Figure 17.9

© 2010 Jupiterimages Corporation
In the 1930s, the successful introduction into the United States of French-made Perrier showed that U.S. consumers were open to a “new” bottled beverage. Since then, the U.S. bottled water business has taken off and bottled water is now the second largest commercial beverage category by volume, after carbonated soft drinks.
Seeing the increased popularity of bottled water, both PepsiCo and Coca-Cola launched their own bottled water brands, Aquafina and Dasani, respectively. Both of these brands are made from purified tap water. Dasani has minerals added back into it; Aquafina does not. Other brands of water come from springs or artesian wells. While domestic brands of water have multiplied, Americans still drink some imported brands. Representing only about 3% of the U.S. market, the volume of imported water nonetheless has about doubled in the last five years.
And U.S. bottled water companies are also eyeing markets in other countries. As New York Times columnist and book author Thomas Friedman noted as he was being shown around a customer call center in Bangalore, India, the water on the desktops of the telemarketers was none other than Coke’s Dasani.
Whether the differences in brands of water are perceived or real, it may not be too long before restaurants develop water lists next to their beer and wine lists. In the U.S. and in other countries around the world, there is likely to be a domestic section and an imported section on those lists. Two-way trade in water seems destined to be a growth industry for some time to come.
Sources: Thomas L. Friedman, “What Goes Around…” The New York Times, February 26, 2004, p. A27; Tom McGrath and Kate Dailey, “Liquid Assets,” Men’s Health 19:2 (March 2004): 142–49; Statistics from Beverage Marketing Corporation at www.bottledwater.org/public/Stats_2004.doc.
Answer to Try It! Problem
In the absence of one of these factors, there would only be one-way, or interindustry, trade, which would take place according to comparative advantage, as described in the first section of this chapter, with a country specializing in and exporting the goods in which it has a comparative advantage and importing goods in which it does not. Efficiency differences would be the only basis for trade.
17.3 Restrictions on International Trade
Learning Objectives
- Define the term protectionist policy and illustrate the general impact in a market subject to protectionist policy.
- Describe the various forms of protectionist policy.
- Discuss and assess the arguments used to justify trade restrictions.
In spite of the strong theoretical case that can be made for free international trade, every country in the world has erected at least some barriers to trade. Trade restrictions are typically undertaken in an effort to protect companies and workers in the home economy from competition by foreign firms. A protectionist policyPolicy that restricts the importation of goods and services produced in foreign countries. is one in which a country restricts the importation of goods and services produced in foreign countries. The slowdown in the U.S. economy late in 2007 and in 2008 has produced a new round of protectionist sentiment—one that became a factor in the 2008 U.S. presidential campaign.
The United States, for example, uses protectionist policies to limit the quantity of foreign-produced sugar coming into the United States. The effect of this policy is to reduce the supply of sugar in the U.S. market and increase the price of sugar in the United States. The 2008 U.S. Farm Bill sweetened things for sugar growers even more. It raised the price they are guaranteed to receive and limited imports of foreign sugar so that American growers will always have at least 85% of the domestic market. The bill for the first time set an income limit—only growers whose incomes fall below $1.5 million per year (for couples) or $750,000 for individuals will receive direct subsidies.“Who Wants to Be a Millionaire?” The Wall Street Journal, May 14, 2008, p. A20.
The U.S. price of sugar is almost triple the world price of sugar, thus reducing the quantity consumed in the United States. The program benefits growers of sugar beets and sugar cane at the expense of consumers.
Figure 17.10 The Impact of Protectionist Policies
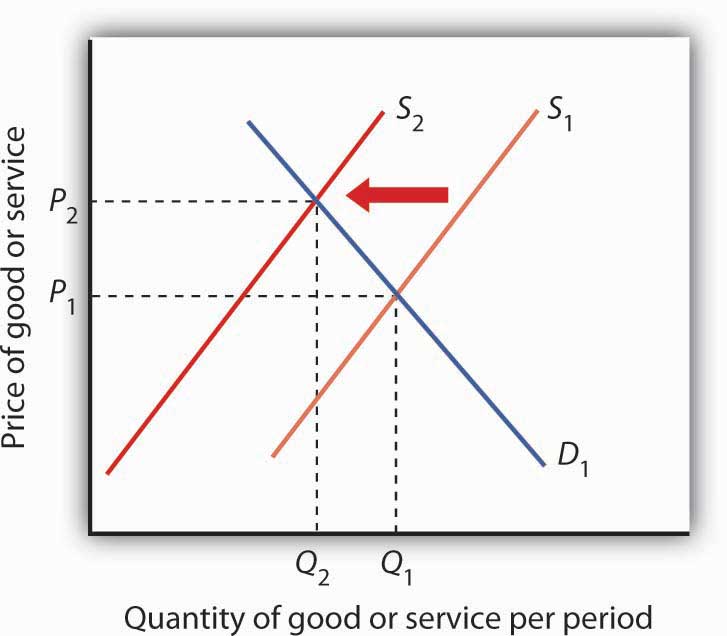
Protectionist policies reduce the quantities of foreign goods and services supplied to the country that imposes the restriction. As a result, such policies shift the supply curve to the left for the good or service whose imports are restricted. In the case shown, the supply curve shifts to S2, the equilibrium price rises to P2, and the equilibrium quantity falls to Q2.
Source: Historical Statistics, Colonial Times to 1970: Statistical Abstract of the United States 1998, Table no. 1325; Statistical Abstract of the United States, 1990; U.S. International Commission (http://dataweb.usitc.gov/prepared_reports.asp).
In general, protectionist policies imposed for a particular good always reduce its supply, raise its price, and reduce the equilibrium quantity, as shown in Figure 17.11 "U.S. Tariff Rates, 1820–2005". Protection often takes the form of an import tax or a limit on the amount that can be imported, but it can also come in the form of voluntary export restrictions and other barriers.
Tariffs
A tariffA tax on imported goods and services. is a tax on imported goods and services. The average tariff on dutiable imports in the United States (that is, those imports on which a tariff is imposed) is about 4%. Some imports have much higher tariffs. For example, the U.S. tariff on imported frozen orange juice is 35 cents per gallon (which amounts to about 40% of value). The tariff on imported canned tuna is 35%, and the tariff on imported shoes ranges between 2% and 48%.
A tariff raises the cost of selling imported goods. It thus shifts the supply curve for goods to the left, as in Figure 17.10 "The Impact of Protectionist Policies". The price of the protected good rises and the quantity available to consumers falls.
Antidumping Proceedings
One of the most common protectionist measures now in use is the antidumping proceeding. A domestic firm, faced with competition by a foreign competitor, files charges with its government that the foreign firm is dumpingThe practice of a foreign firm charging a price in other countries that is below the price it charges in its home country., or charging an “unfair” price. Under rules spelled out in international negotiations that preceded approval of the World Trade Organization, an unfair price was defined as a price below production cost or below the price the foreign firm charges for the same good in its own country. While these definitions may seem straightforward enough, they have proven to be quite troublesome. The definition of “production cost” is a thoroughly arbitrary procedure. In defining cost, the government agency invariably includes a specification of a “normal” profit. That normal profit can be absurdly high. The United States Department of Justice, which is the U.S. agency in charge of determining whether a foreign firm has charged an unfair price, has sometimes defined normal profit rates as exceeding production cost by well over 50%, a rate far higher than exists in most U.S. industry.
The practice of a foreign firm charging a price in the United States that is below the price it charges in its home country is common. The U.S. market may be more competitive, or the foreign firm may simply be trying to make its product attractive to U.S. buyers that are not yet accustomed to its product. In any event, such price discrimination behavior is not unusual and is not necessarily “unfair.”
In the United States, once the Department of Justice has determined that a foreign firm is guilty of charging an unfair price, the U.S. International Trade Commission must determine that the foreign firm has done material harm to the U.S. firm. If a U.S. firm has suffered a reduction in sales and thus in employment it will typically be found to have suffered material harm, and punitive duties will be imposed.
Quotas
A quotaA direct restriction on the total quantity of a good or service that may be imported during a specified period. is a direct restriction on the total quantity of a good or service that may be imported during a specified period. Quotas restrict total supply and therefore increase the domestic price of the good or service on which they are imposed. Quotas generally specify that an exporting country’s share of a domestic market may not exceed a certain limit.
In some cases, quotas are set to raise the domestic price to a particular level. Congress requires the Department of Agriculture, for example, to impose quotas on imported sugar to keep the wholesale price in the United States above 22 cents per pound. The world price is typically less than 10 cents per pound.
A quota restricting the quantity of a particular good imported into an economy shifts the supply curve to the left, as in Figure 17.10 "The Impact of Protectionist Policies". It raises price and reduces quantity.
An important distinction between quotas and tariffs is that quotas do not increase costs to foreign producers; tariffs do. In the short run, a tariff will reduce the profits of foreign exporters of a good or service. A quota, however, raises price but not costs of production and thus may increase profits. Because the quota imposes a limit on quantity, any profits it creates in other countries will not induce the entry of new firms that ordinarily eliminates profits in perfect competition. By definition, entry of new foreign firms to earn the profits available in the United States is blocked by the quota.
Voluntary Export Restrictions
Voluntary export restrictionsA form of trade barrier by which foreign firms agree to limit the quantity of goods exported to a particular country. are a form of trade barrier by which foreign firms agree to limit the quantity of goods exported to a particular country. They became prominent in the United States in the 1980s, when the U.S. government persuaded foreign exporters of automobiles and steel to agree to limit their exports to the United States.
Although such restrictions are called voluntary, they typically are agreed to only after pressure is applied by the country whose industries they protect. The United States, for example, has succeeded in pressuring many other countries to accept quotas limiting their exports of goods ranging from sweaters to steel.
A voluntary export restriction works precisely like an ordinary quota. It raises prices for the domestic product and reduces the quantity consumed of the good or service affected by the quota. It can also increase the profits of the firms that agree to the quota because it raises the price they receive for their products.
Other Barriers
In addition to tariffs and quotas, measures such as safety standards, labeling requirements, pollution controls, and quality restrictions all may have the effect of restricting imports.
Many restrictions aimed at protecting consumers in the domestic market create barriers as a purely unintended, and probably desirable, side effect. For example, limitations on insecticide levels in foods are often more stringent in the United States than in other countries. These standards tend to discourage the import of foreign goods, but their primary purpose appears to be to protect consumers from harmful chemicals, not to restrict trade. But other nontariff barriers seem to serve no purpose other than to keep foreign goods out. Tomatoes produced in Mexico, for example, compete with those produced in the United States. But Mexican tomatoes tend to be smaller than U.S. tomatoes. The United States once imposed size restrictions to “protect” U.S. consumers from small tomatoes. The result was a highly effective trade barrier that protected U.S. producers and raised U.S. tomato prices. Those restrictions were abolished under terms of the North American Free Trade Agreement, which has led to a large increase in U.S. imports of Mexican tomatoes and a reduction in U.S. tomato production.Ramon G. Guajardo and Homero A. Elizondo, “North American Tomato Market: A Spatial Equilibrium Perspective,” Applied Economics, 35(3) (February 2003): 315–22.
Justifications for Trade Restriction: An Evaluation
The conceptual justification for free trade is one of the oldest arguments in economics; there is no disputing the logic of the argument that free trade increases global production, worldwide consumption, and international efficiency. But critics stress that the argument is a theoretical one. In the real world, they say, there are several arguments that can be made to justify protectionist measures.
Infant Industries
One argument for trade barriers is that they serve as a kind of buffer to protect fledgling domestic industries. Initially, firms in a new industry may be too small to achieve significant economies of scale and could be clobbered by established firms in other countries. A new domestic industry with potential economies of scale is called an infant industry.A new domestic industry with potential economies of scale.
Consider the situation in which firms in a country are attempting to enter a new industry in which many large firms already exist in the international arena. The foreign firms have taken advantage of economies of scale and have therefore achieved relatively low levels of production costs. New firms, facing low levels of output and higher average costs, may find it difficult to compete. The infant industry argument suggests that by offering protection during an industry’s formative years, a tariff or quota may allow the new industry to develop and prosper.
Figure 17.11 U.S. Tariff Rates, 1820–2005
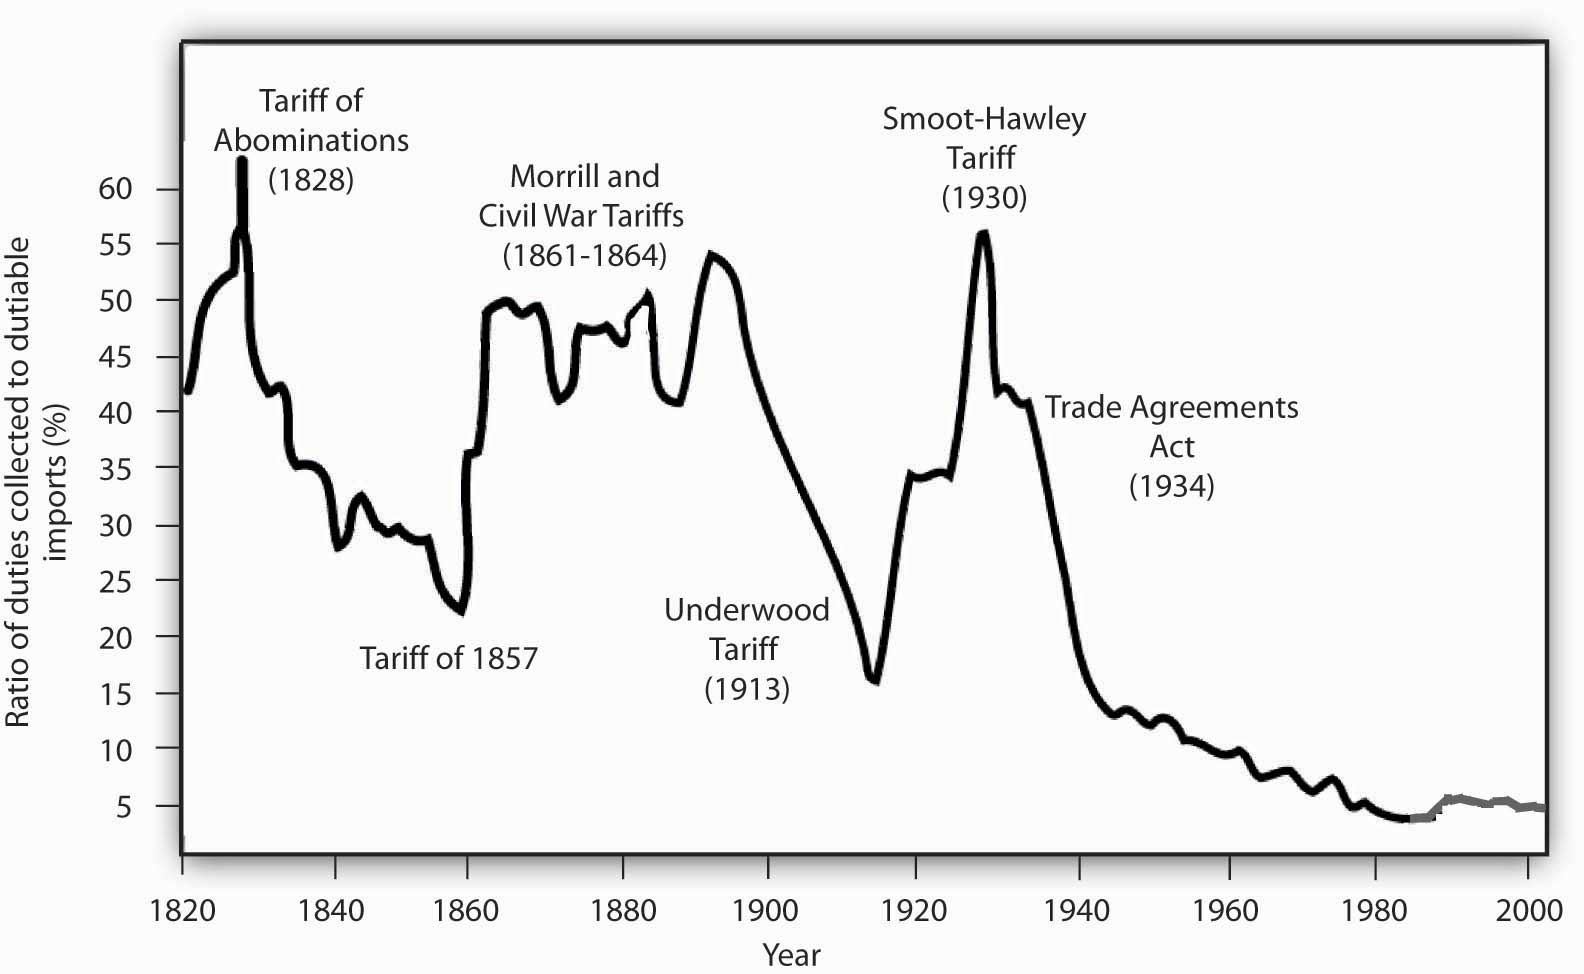
Tariff rates on “dutiable imports” have fallen dramatically over the course of U.S. history.
Sources: Historical Statistics, Colonial Times to 1970; Statistical Abstract of the United States, 1998, Table no. 1325; Statistical Abstract of the United States, 1990; U.S. International Commission http://dataweb.usitc.gov/prepared_reports.asp).
The infant industry argument played a major role in tariff policy in the early years of U.S. development. Figure 17.11 "U.S. Tariff Rates, 1820–2005" shows average tariff rates on dutiable imports in the United States since 1820. The high tariffs of the early nineteenth century were typically justified as being necessary to allow U.S. firms to gain a competitive foothold in the world economy. As domestic industries became established, tariff rates fell. Subsequent increases in tariffs were a response in part to internal crises: the Civil War and the Great Depression. Tariff rates have fallen dramatically since 1930.
Critics of the infant industry argument say that once protection is in place, it may be very difficult to remove. Inefficient firms, they contend, may be able to survive for long periods under the umbrella of infant industry protection.
Strategic Trade Policy
A new version of the infant industry argument has been used in the past few years as technological developments have spawned whole new industries and transformed existing ones. The new version of the infant industry argument assumes an imperfectly competitive market.
Suppose technological change has given rise to a new industry. Given the economies of scale in this industry, only a few firms are likely to dominate it worldwide—it will likely emerge as an oligopoly. The firms that dominate the industry are likely to earn economic profits that will persist. Furthermore, because there will be only a few firms, they will be located in only a few countries. Their governments could conceivably impose taxes on these firms’ profits that would enhance economic well-being within the country. The potential for such gains may justify government efforts to assist firms seeking to acquire a dominant position in the new industry.
Government aid could take the form of protectionist trade policies aimed at allowing these firms to expand in the face of foreign competition, assistance with research and development efforts, programs to provide workers with special skills needed by the industry, or subsidies in the form of direct payments or special tax treatment. Any such policy aimed at promoting the development of key industries that may increase a country’s domestic well-being through trade with the rest of the world is known as a strategic trade policy.A policy aimed at promoting the development of key industries that may increase a countrys domestic well-being through trade with the rest of the world.
Although strategic trade policy suggests a conceptually positive role for government in international trade, proponents of the approach note that it has dangers. Firms might use the strategic trade argument even if their development were unlikely to offer the gains specified in the theory. The successful application of the approach requires that the government correctly identify industries in which a country can, in fact, gain dominance—something that may not be possible. Various European governments provided subsidies to firms that were involved in the production of Airbus, which is now a major competitor in the airplane industry. On the other hand, Britain and France subsidized the development of the supersonic plane called the Concorde. After only a few Concordes had been produced, it became obvious that the aircraft was a financially losing proposition and production was halted. The airline has now gone out of business.
Finally, those firms whose success strategic trade policy promotes might have sufficient political clout to block the taxes that would redistribute the gains of the policies to the population in general. Thus, the promise of strategic trade policy is unlikely to be fulfilled.
National Security
It is sometimes argued that the security of the United States would be threatened if this country depended on foreign powers as the primary source of strategic materials. In time of war, the United States might be cut off from sources of foreign supply and lose some of the materials upon which U.S. industry depends.
One area where the national security argument is applied is the oil industry. Given the volatility of the political situation in the Middle East, some people say, the United States should protect the domestic oil industry in order to ensure adequate production capability in the event Middle Eastern supplies are cut off.
An alternative to tariff protection of strategic commodities is to stockpile those commodities for use in time of crisis. For example, the United States maintains a strategic petroleum reserve for use in case of a cutoff in foreign supplies or domestic crises. For example, strategic oil reserves were tapped in the wake of pipeline and refinery disruptions following Hurricane Katrina in 2005.
Job Protection
The desire to maintain existing jobs threatened by foreign competition is probably the single most important source of today’s protectionist policies. Some industries that at one time had a comparative advantage are no longer among the world’s lowest-cost producers; they struggle to stay afloat. Cost cutting leads to layoffs, and layoffs lead to demands for protection.
The model of international trade in perfect competition suggests that trade will threaten some industries. As countries specialize in activities in which they have a comparative advantage, sectors in which they do not have this advantage will shrink. Maintaining those sectors through trade barriers blocks a nation from enjoying the gains possible from free trade.
A further difficulty with the use of trade barriers to shore up employment in a particular sector is that it can be an enormously expensive strategy. Suppose enough of a foreign good is kept out of the United States to save one U.S. job. That shifts the supply curve slightly to the left, raising prices for U.S. consumers and reducing their consumer surplus. The loss to consumers is the cost per job saved. Estimates of the cost of saving one job in the steel industry through restrictions on steel imports, for example, go as high as $800,000 per year.
Cheap Foreign Labor and Outsourcing
One reason often given for the perceived need to protect American workers against free international trade is that workers must be protected against cheap foreign labor. This is an extension of the job protection argument in the previous section. From a theoretical point of view, of course, if foreign countries can produce a good at lower cost than we can, it is in our collective interest to obtain it from them. But workers counter by saying that the low wages of foreign workers means that foreign workers are exploited. To compete with foreign workers, American workers would have to submit themselves to similar exploitation. This objection, however, fails to recognize that differences in wage rates generally reflect differences in worker productivity.
Consider the following example: Suppose U.S. workers in the tool industry earn $20 per hour while Indonesian workers in the tool industry earn only $2 per hour. If we assume that the tool industry is competitive, then the wages in both countries are based on the marginal revenue product of the workers. The higher wage of U.S. workers must mean that they have a higher marginal product—they are more productive. The higher wage of U.S. workers need not mean that labor costs are higher in the United States than in Indonesia.
Further, we have seen that what matters for trade is comparative advantage, not comparative labor costs. When each nation specializes in goods and services in which it has a comparative advantage—measured in the amounts of other goods and services given up to produce them—then world production, and therefore world consumption, rises. By definition, each nation will have a comparative advantage in something.
A particularly controversial issue in industrialized economies is outsourcingSituation in which firms in a developed country transfer some of their activities abroad in order to take advantage of lower labor costs in other countries., in which firms in a developed country transfer some of their activities abroad in order to take advantage of lower labor costs in other countries. Generally speaking, the practice of outsourcing tends to reduce costs for the firms that do it. These firms often expand production and increase domestic employment, as is discussed in the accompanying Case in Point essay.
Differences in Environmental Standards
Another justification for protectionist measures is that free trade is unfair if it pits domestic firms against foreign rivals who do not have to adhere to the same regulatory standards. In the debate over NAFTA, for example, critics warned that Mexican firms, facing relatively lax pollution control standards, would have an unfair advantage over U.S. firms if restraints on trade between the two countries were removed.
Economic theory suggests, however, that differences in pollution-control policies can be an important source of comparative advantage. In general, the demand for environmental quality is positively related to income. People in higher-income countries demand higher environmental quality than do people in lower-income countries. That means that pollution has a lower cost in poorer than in richer countries. If an industry generates a great deal of pollution, it may be more efficient to locate it in a poor country than in a rich country. In effect, a poor country’s lower demand for environmental quality gives it a comparative advantage in production of goods that generate a great deal of pollution.
Provided the benefits of pollution exceed the costs in the poor country, with the costs computed based on the preferences and incomes of people in that country, it makes sense for more of the good to be produced in the poor country and less in the rich country. Such an allocation leaves people in both countries better off than they would be otherwise. Then, as freer trade leads to higher incomes in the poorer countries, people there will also demand improvements in environmental quality.
Do economists support any restriction on free international trade? Nearly all economists would say no. The gains from trade are so large, and the cost of restraining it so high, that it is hard to find any satisfactory reason to limit trade.
Key Takeaways
- Protectionist measures seek to limit the quantities of goods and services imported from foreign countries. They shift the supply curve for each of the goods or services protected to the left.
- The primary means of protection are tariffs and quotas.
- Antidumping proceedings have emerged as a common means of protection.
- Voluntary export restrictions are another means of protection; they are rarely voluntary.
- Other protectionist measures can include safety standards, restrictions on environmental quality, labeling requirements, and quality standards.
- Protectionist measures are sometimes justified using the infant industry argument, strategic trade policy, job protection, “cheap” foreign labor and outsourcing, national security, and differences in environmental standards.
Try It!
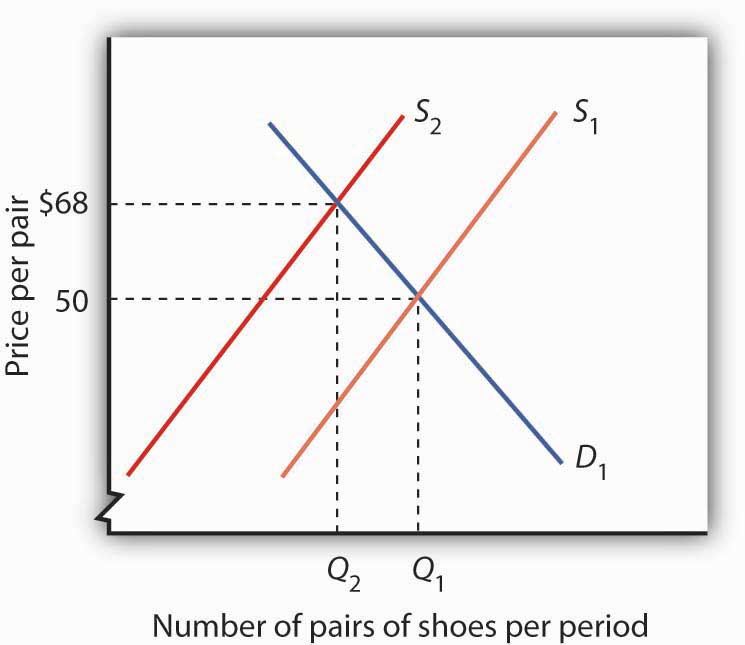
Suppose the United States imposes a quota reducing its imports of shoes by one-half (roughly 85–90% of the shoes now sold in the United States are imported). Assume that shoes are produced under conditions of perfect competition and that the equilibrium price of shoes is now $50 per pair. Illustrate and explain how this quota will affect the price and output of shoes in the United States.
Case in Point: Outsourcing and Employment
Figure 17.12
© 2010 Jupiterimages Corporation
The phenomenon of outsourcing has become common as the Internet and other innovations in communication have made it easier for firms to transfer aspects of their production overseas. At the same time, countries such as India and China have invested heavily in education and have produced a sizable workforce of professional people capable of filling relatively high level positions for firms in more developed countries.
The very idea of outsourcing rankles politicians on the left and on the right. In the United States, there have been numerous congressional hearings on outsourcing and proposals to block firms that engage in the practice from getting government contracts.
By outsourcing, firms are able to reduce their production costs. As we have seen, a reduction in production costs translates into increased output and falling prices. From a consumer’s point of view, then, outsourcing should be a very good thing. The worry many commentators express, however, is that outsourcing will decimate employment in the United States, particularly among high-level professionals. Matthew J. Slaughter, an economist at Dartmouth University, examined employment trends from 1991 to 2001 among multinational U.S. firms that had outsourced jobs. Those firms outsourced 2.8 million jobs during the period.
Were the 2.8 million jobs simply lost? Mr. Slaughter points out that there are three reasons to expect that the firms that reduced production costs by outsourcing would actually increase their domestic employment. First, by lowering cost, firms are likely to expand the quantity they produce. The foreign workers who were hired, who Mr. Slaughter refers to as “affiliate workers,” appeared to be complements to American workers rather than substitutes. If they are complements rather than substitutes, then outsourcing could lead to increased employment in the country that does the outsourcing.
A second reason outsourcing could increase employment is that by lowering production cost, firms that increase the scale of their operations through outsourcing need more domestic workers to sell the increased output, to coordinate its distribution, and to develop the infrastructure to handle all those goods.
Finally, firms that engage in outsourcing are also likely to increase the scope of their operations. They will need to hire additional people to explore other product development, to engage in research, and to seek out new markets for the firm’s output.
Thus, Mr. Slaughter argues that outsourcing may lead to increased employment because domestic workers are complements to foreign workers, because outsourcing expands the scale of a firm’s operations, and because it expands the scope of operations. What did the evidence show? Remember the 2.8 million jobs that multinational firms based in the United States outsourced between 1991 and 2001? Employment at those same U.S. firms increased by 5.5 million jobs during the period. Thus, with the phenomena of complementarity, increases in scale, and increases of scope, each job outsourced led to almost two additional jobs in the United States.
The experience of two quite dissimilar firms illustrates the phenomenon. Wal-Mart began expanding its operations internationally in about 1990. Today, it manages its global operations from its headquarters in Bentonville, Arkansas where it employs 15,000 people. Roughly 1,500 of these people coordinate the flow of goods among Wal-Mart’s stores throughout the world. Those 1,500 jobs would not exist were it not for globalization. Xilinx, the high technology research and development firm, generates sales of about $1.5 billion per year. Sixty-five percent of its sales are generated outside the United States. But 80% of its employees are in the United States.
Outsourcing, then, generates jobs. It does not destroy them. Mr. Slaughter concludes: “Instead of lamenting ongoing foreign expansion of U.S. multinationals, if history is our guide then we should be encouraging it.”
Source: Matthew J. Slaughter, “Globalization and Employment by U.S. Multinationals: A Framework and Facts,” Daily Tax Report (March 26, 2004): 1–12.
Answer to Try It! Problem
The quota shifts the supply curve to the left, increasing the price of shoes in the United States and reducing the equilibrium quantity. In the case shown, the price rises to $68. Because you are not given the precise positions of the demand and supply curves, you can only conclude that price rises; your graph may suggest a different price. The important thing is that the new price is greater than $50.
Figure 17.13
17.4 Review and Practice
Summary
In this chapter we have seen how international trade makes it possible for countries to improve on their domestic production possibilities.
A country that is operating on its production possibilities curve can obtain more of all goods by opening its markets to free international trade. Free trade allows nations to consume goods beyond their domestic production possibilities curves. If nations specialize in the production of goods and services in which they have a comparative advantage, total output increases. Free trade enhances production possibilities on a worldwide scale. It does not benefit everyone, however. Some workers and owners of other factors of production will be hurt by free trade, at least in the short run.
Contrary to the implication of the model of specialization based on comparative advantage, not all trade is one-way trade. Two-way trade in the same goods may arise from variations in transportation costs and seasonal influences. Two-way trade in similar goods is often the result of imperfect competition. Much trade among high-income countries is two-way trade.
The imposition of trade barriers such as tariffs, antidumping proceedings, quotas, or voluntary export restrictions raises the equilibrium price and reduces the equilibrium quantity of the restricted good. Although there are many arguments in favor of such restrictions on free trade, economists generally are against protectionist measures and supportive of free trade.
Concept Problems
- Explain how through trade a country can consume at levels beyond the reach of its production possibilities.
- Why do countries place restrictions on international trade?
- What is the difference between a tariff and a quota?
- The Case in Point on America’s shifting comparative advantage suggests that the United States may have a comparative advantage over other countries in the production of high-tech capital goods. What do you think might be the sources of this advantage?
- “I know a lawyer who can type 100 words per minute but pays a secretary $10 per hour to type court briefs. But the secretary can only type 50 words per minute. I have told my lawyer friend a hundred times she would be better off doing the typing herself, but she just will not listen.” Who has the better part of this disagreement, the lawyer or the friend? Explain.
- Which individuals in the United States might benefit from a tariff placed on the importation of shoes? Who might lose?
- Explain why economists argue that protectionist policies lead to the misallocation of resources in the domestic economy.
- Tomatoes grow well in Kansas. Why do the people of Kansas buy most of their tomatoes from Florida, Mexico, and California?
- Under what circumstances will a country both export and import the products of the same industry?
- Suppose the United States imposes a quota on copper imports. Who might be helped? Who might be hurt?
- Some people argue that international trade is fine, but that firms in different countries should play on a “level playing field.” They argue that if a good can be produced more cheaply abroad than at home, tariffs should be imposed on the good so that the costs of producing it are the same everywhere. What do you think of this argument?
- Suppose wages in the Philippines are one-tenth of wages in the United States. Why do all U.S. firms not just move production to the Philippines?
Numerical Problems
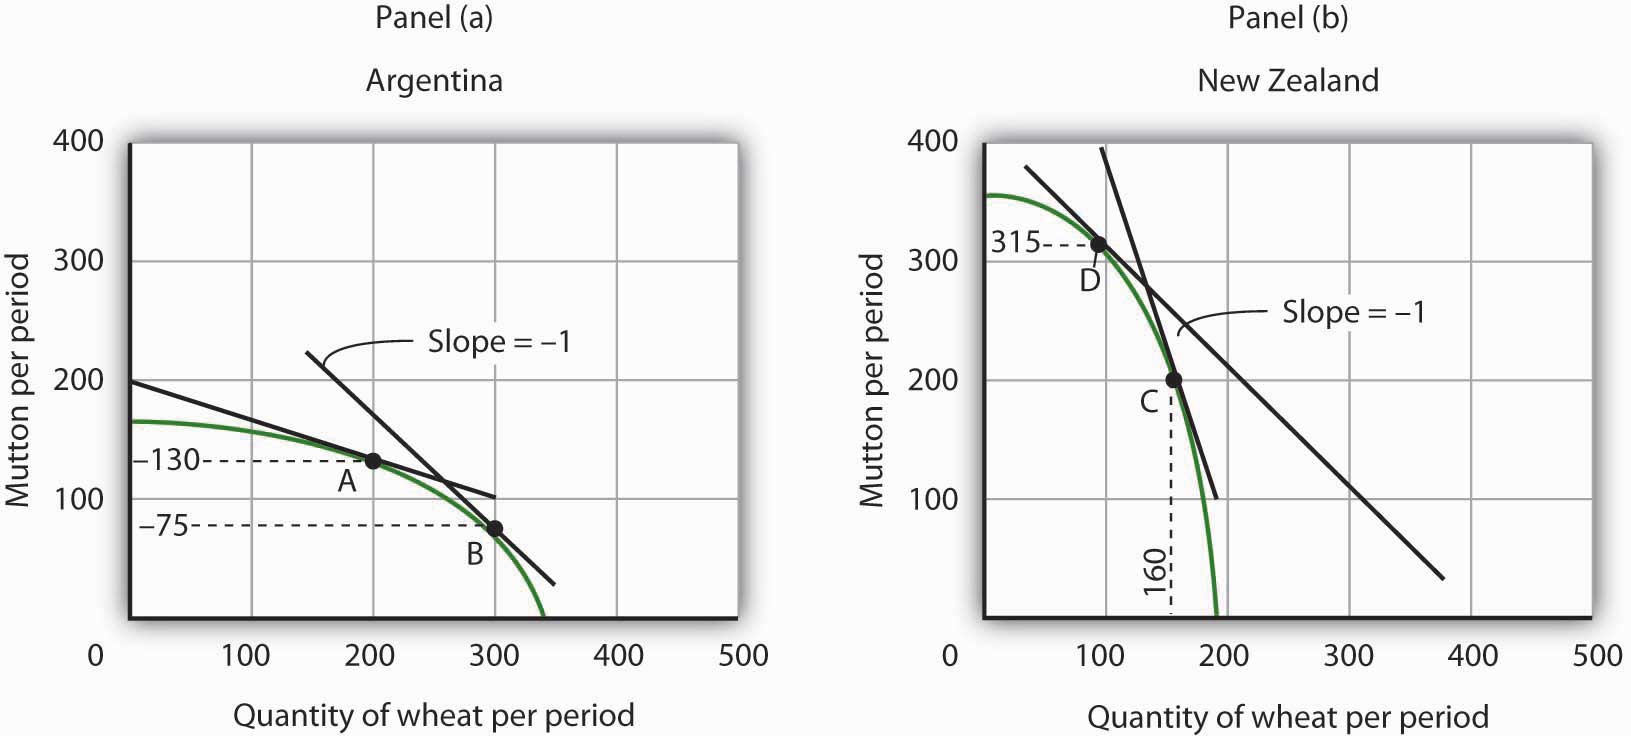
Figure 17.14
-
Argentina and New Zealand each produce wheat and mutton under conditions of perfect competition, as shown on the accompanying production possibilities curves. Assume that there is no trade between the two countries and that Argentina is now producing at point A and New Zealand at point C.
- What is the opportunity cost of producing each good in Argentina?
- What is the opportunity cost of producing each good in New Zealand?
- Which country has a comparative advantage in which good? Explain.
- Explain how international trade would affect wheat production in Argentina.
- How would international trade affect mutton production?
- Explain how international trade would affect wheat production in New Zealand. How would it affect mutton production?
- How would trade between the two countries affect consumption of wheat and mutton in each country?
- Assume that trade opens between Argentina and New Zealand and that, with trade, a pound of mutton exchanges for a bushel of wheat. Before trade, Argentina produced at point A and New Zealand produced at point C. Argentina moves to point B, while New Zealand moves to point D. Calculate and illustrate graphically an exchange between Argentina and New Zealand that would leave both countries with more of both goods than they had before trade.
-
Assume that the world market for producing radios is monopolistically competitive. Suppose that the price of a typical radio is $25.
- Why is this market likely to be characterized by two-way trade?
- Suppose that Country A levies a tax of $5 on each radio produced within its borders. Will radios continue to be produced in Country A? If they are, what will happen to their price? If they are not, who will produce them?
- If you concluded that radios will continue to be produced in Country A, explain what will happen to their price in the short run. Illustrate your answer graphically.
- What will happen to their price in the long run?
-
Suppose radio producers in Country A file a successful anti-dumping complaint against their competitors, and that the result is the imposition of a $10 per radio tariff on imported radios.
- Illustrate and explain how the $10 tariff will affect radio producers in Country A in the short run.
- Illustrate and explain how the $10 tariff will affect radio producers in Country A in the long run.
- How will the level of employment be affected in Country A?
- Explain how the tariff will affect consumers in Country A. Who will benefit from the anti-dumping action? Who will bear the burden of the action?