This is “Designing Information Systems”, section 1.2 from the book Designing Business Information Systems: Apps, Websites, and More (v. 1.0). For details on it (including licensing), click here.
For more information on the source of this book, or why it is available for free, please see the project's home page. You can browse or download additional books there. To download a .zip file containing this book to use offline, simply click here.


1.2 Designing Information Systems
Learning Objectives
- Compare and contrast usability, graphic design and analytical design.
- Outline the steps by which an information system should be designed.
Many Meanings of Design
The key to successful information systems is good design. But what makes a good design? A number of disciplines weigh in on this topic. We will look at design from a number of different perspectives. Whenever possible we will contrast good and bad designs.
Different people use the word design in different contexts. When IS professionals speak of design, they are referring to business processes. Problems must be analyzed and requirements documented before solutions are designed, developed, and implemented. After all if the design does not satisfy the business need, then what’s the point? However, satisfying the business need is really a baseline standard. The vilified hospital system described earlier meets the business need of registering patients. And yet its design is in other ways lacking. Similarly, fast food meets the need for feeding one’s hunger. However, we want to be metaphorically better than fast food in our designs.
UsabilityDescribes how easy the system is to use and navigate—especially for novice users. describes how easy the system is to navigate. The easier the system is to navigate, the less time a user will need to spend learning to use the system. A more usable system also leaves less room for error. Usability theory provides rules of thumb (heuristics) that document best practice conventions for designing a user interface. Amazon.com has one of the most usable online systems because they follow established conventions. Following conventions tremendously increases the potential acceptance of your website or app.
Graphic designDescribes the visual appeal and organization of the user interface. refers to the visual appeal and organization of the user interface. There is obviously some overlap here with usability. Usable systems typically adhere to at least some graphic design rules. However, a usable system could be bland and uninteresting. Employing graphic design principles helps ensure that the system will have visual appeal. Designs also need to fit with the overall brand of the client. Existing colors, fonts, and logos are all a part of the brand for which the system is being created.
Analytical DesignDescribes how best to represent information—especially quantitative information—so that it communicates clearly and truthfully. describes how to best represent information—especially quantitative information—to communicate clearly and truthfully. Every information systems project has quantitative dimensions associated with project management. These include estimating costs, time schedules, and so forth.
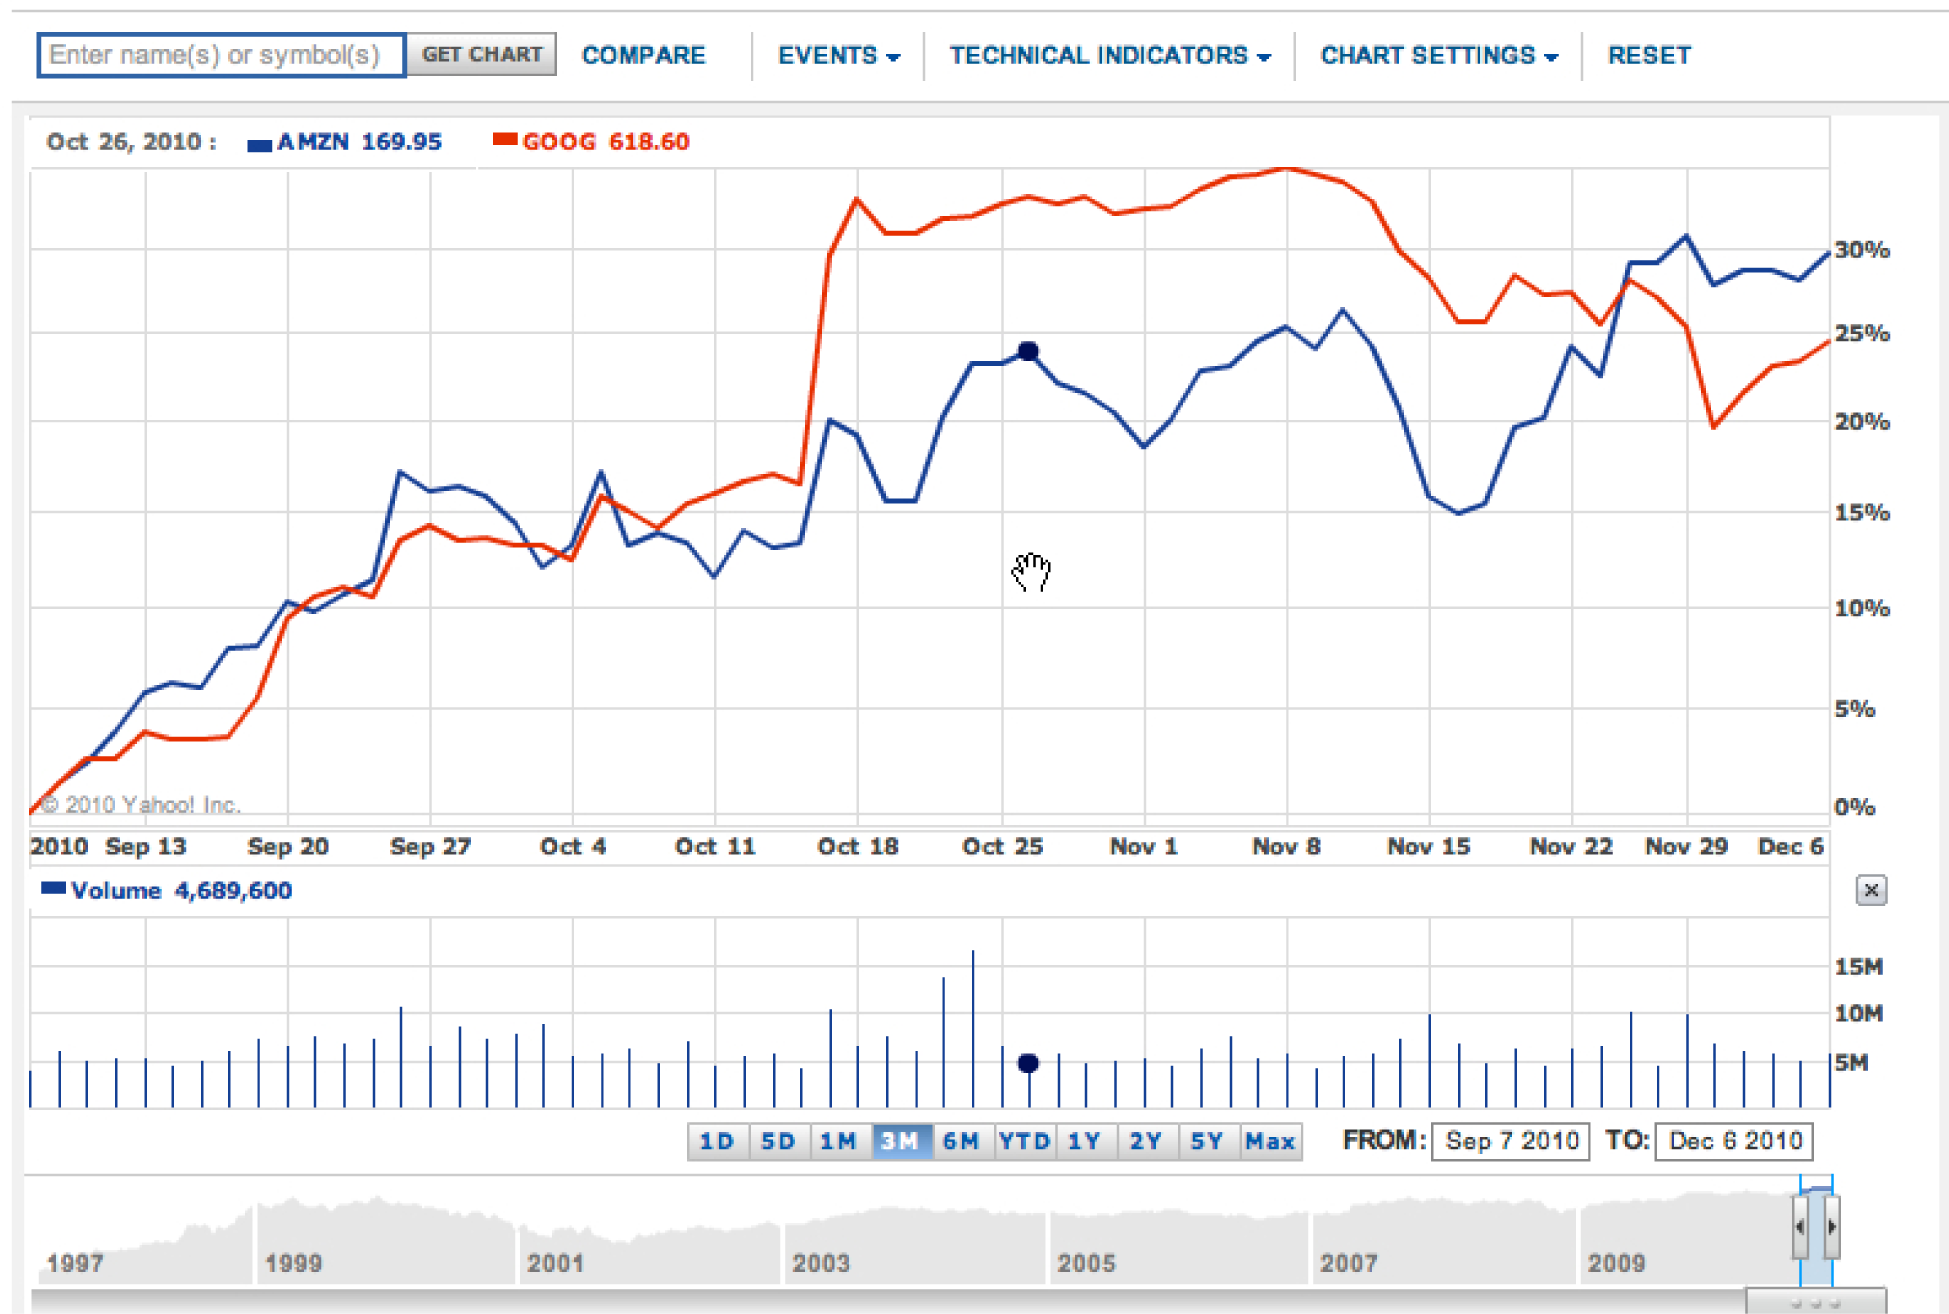
The convergence of usability, graphic design, and analytical design on Yahoo Finance. This graph shows the three month stock price for Amazon vs. Google. From a usability standpoint it could not be easier to request the graph. Type the company name and it suggests the stock ticker symbol. Also, as you move your cursor (the hand), the black dot on the line moves as well, and the numbers on the top left update to display values for the date you are passing over—very slick! The graphic design is excellent—muting the underlying grid so that the data stands out by contrast. The analytical design is also first rate. Hundreds of data points are effortlessly represented. We see the trading volume on each day. At the bottom, the stock price is placed in context over a multi year period. In sum, we have a tremendous amount of information beautifully represented without clutter. Think about this the next time you see an impoverished PowerPoint graph with four bars representing four data points.
Systems Development Life Cycle (SDLC)
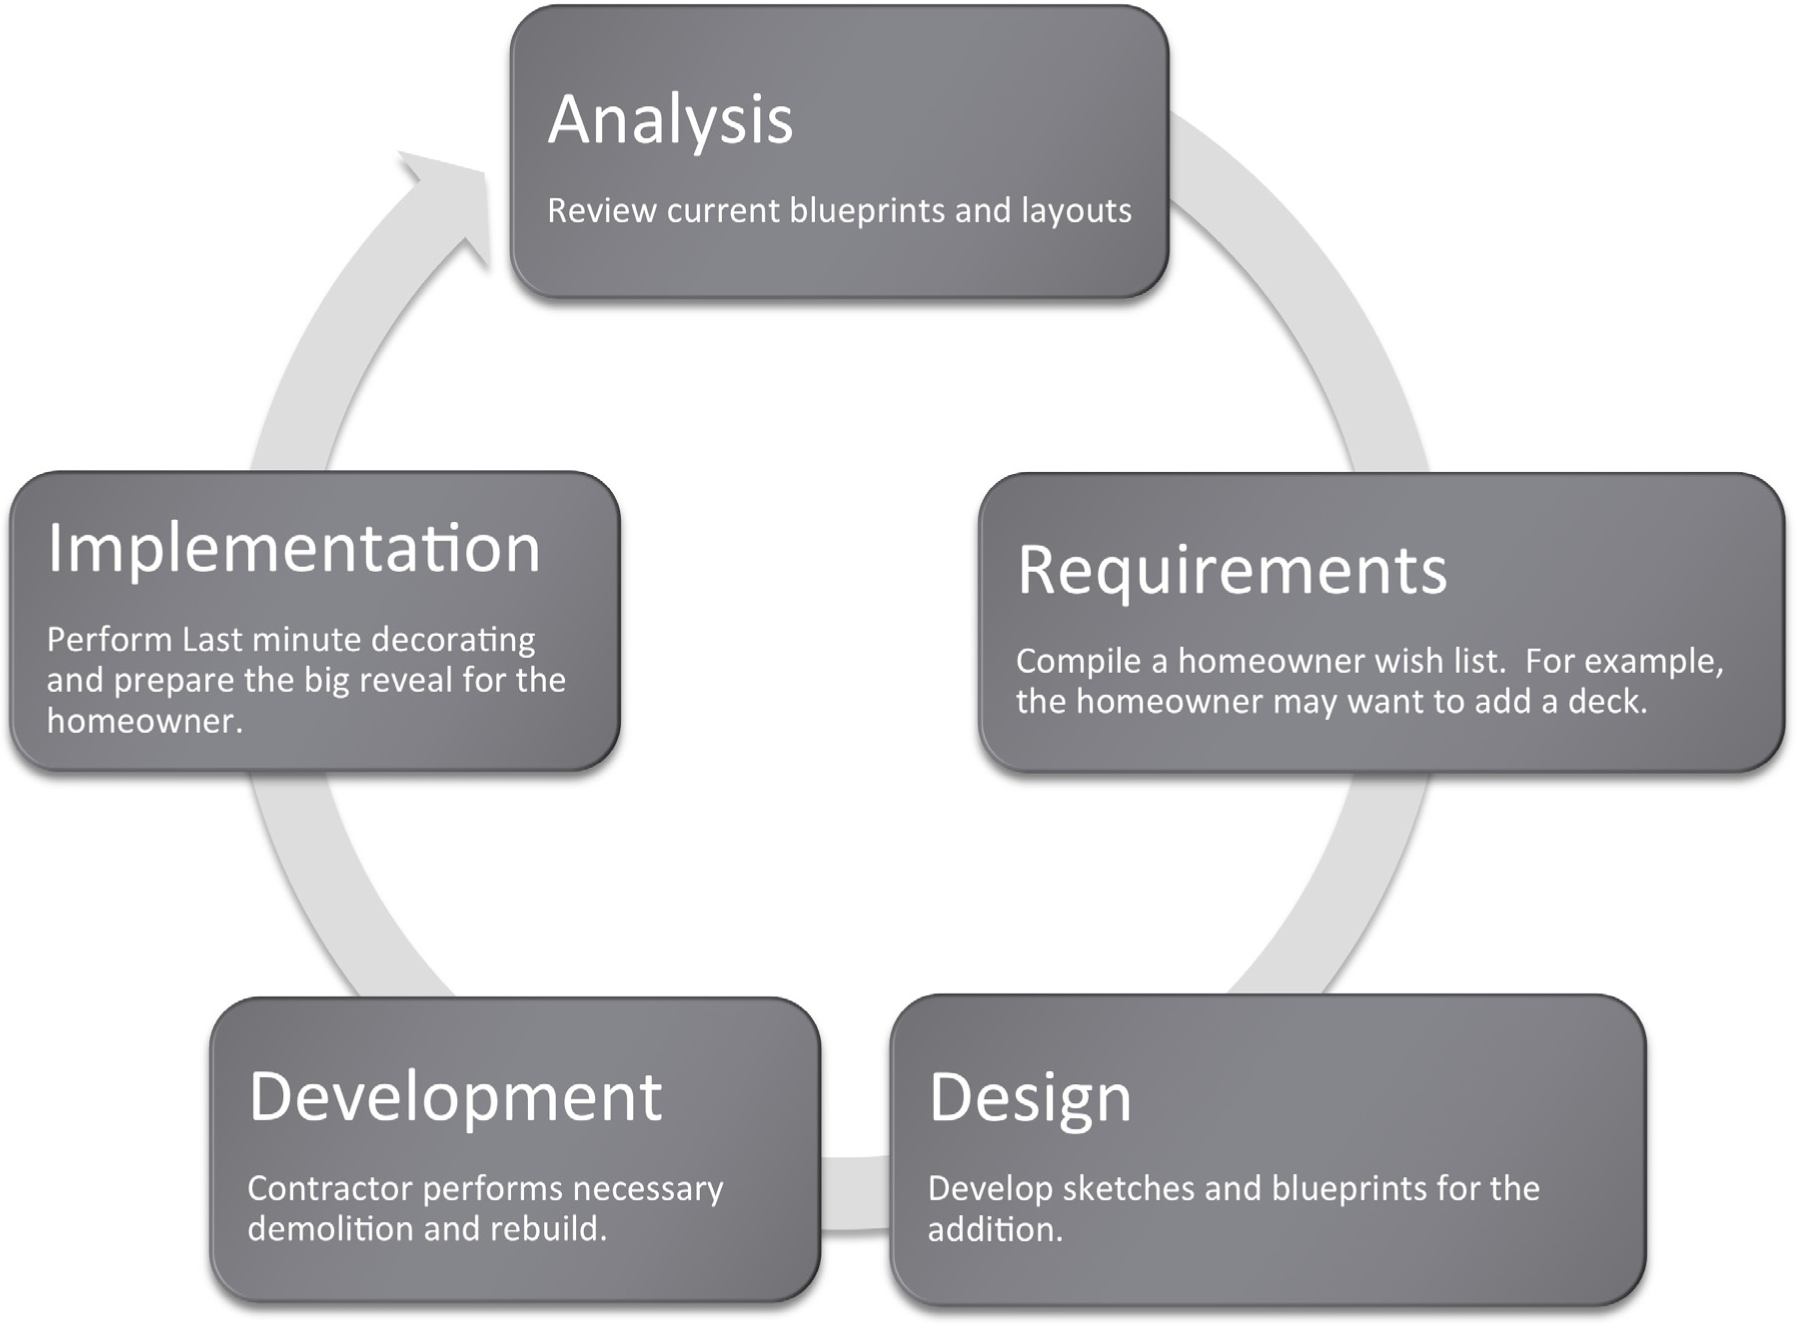
Information systems are designed using the systems development life cycle (SDLC)A method for designing information systems. The life cycle proceeds through the following stages: an analysis of the current state, development of requirements, design of a solution, development from the design and finally to implementation or roll out of the solution.. The SDLC is to a large extent common sense spelled out in stages. First, analyze the current situation. Then specify the requirements that a solution should embody. The next stage is to design a solution (no programming yet). Then the system is developed (programmed) and tested. Finally, the system goes live for the end users as it is implemented in the business setting. To review, the five phases are:
- Analysis
- Requirements (vision of future state)
- Design
- Development
- Implementation
In this course we will cover all five stages. However we will focus most heavily on the first three stages for two reasons. First, because that is where IS professionals tend to spend most of their time and second because it is much easier to make changes to a system when in the planning stages, than after code has already been generated.
It is good to frequently interact with the end user and show them screen mockupsNon-functioning pages of a website or app that are generated in a drawing program such as Photoshop, Omnigraffle, or even PowerPoint. and a systems architecture diagramA diagram that shows the organization of a website or app. A systems architecture diagram is sometimes also called a site map. of what the final system will look like. The systems architecture is a hierarchy diagram of the flow of the website or app—what the relationship between the pages of the system will be. It is sometimes called a site map. Ideally the systems architecture is done on paper with sticky notes that can be moved around at will by multiple users. A final systems architecture can be represented as a hierarchy chart in PowerPoint.
Once the systems architecture is complete, wireframesA sketch of what the website or app page will look like. A wireframe has less detail filled in than a mockup. or mockups of the individual pages may be constructed. Mockups are non-functioning pages generated in a drawing program such as PhotoShop, Omnigraffle (Mac), or even PowerPoint. PowerPoint turns out to be a fairly respectable mockup tool—especially when working off of some predefined templates.
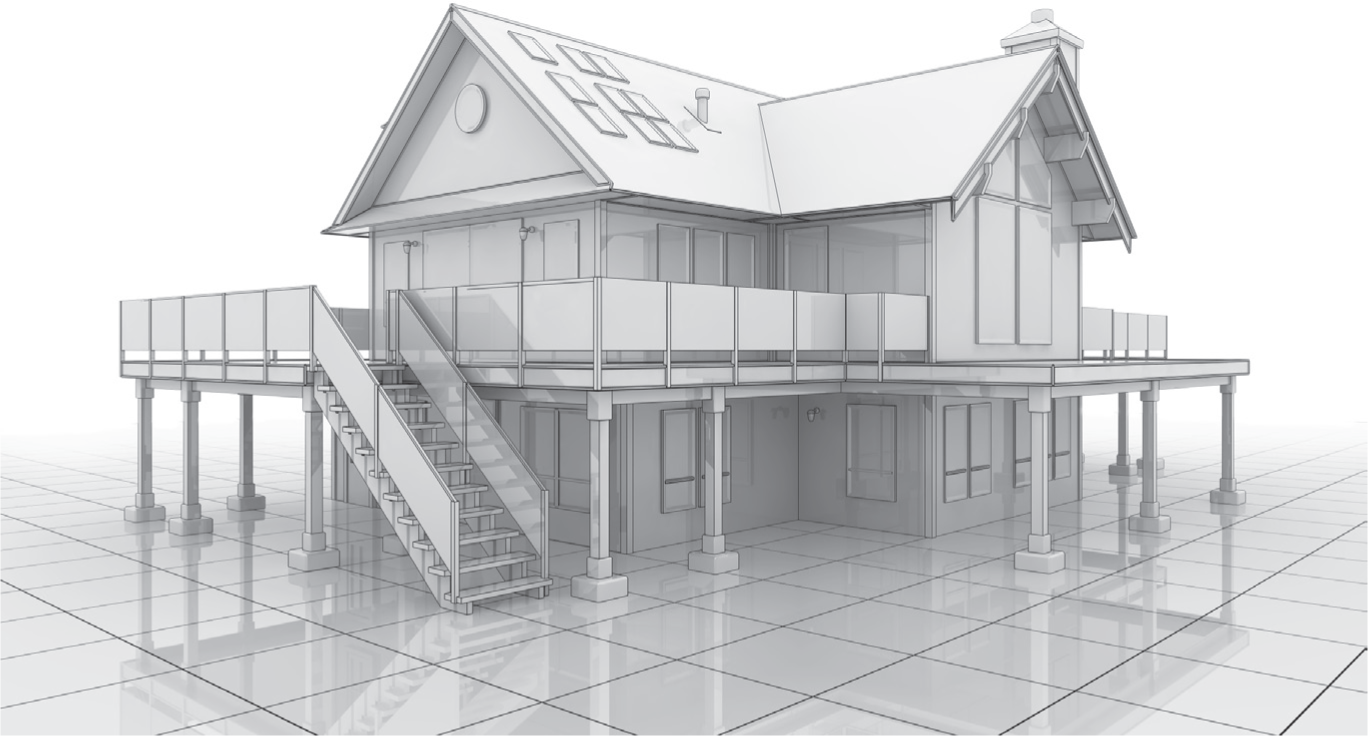
The SDLC in action. By analogy think of home improvement shows on TV. such as Curb Appeal. They typically follow a similar life cycle when improving a home. The current state of the home is analyzed in consultation with the resident. During this stage the residents reveal their requirements for a solution. For example, they might want a way to interact more with the neighbors. Next the designer produces a plan to meet those requirements. For example, a French door in the living room leading to a front deck from which to interact with the neighbors. Actually blowing a hole through the wall and installing a deck is the development stage. If the design is good and workmanship good, the owner is normally delighted with the solution. At least they seem to be on TV. The illustration below helps to tease out some of the equivalencies.
Key Takeaways
- The systems development life cycle (SDLC) is an approach for designing and developing MIS solutions. It proceeds in stages: analysis, requirements (vision of future state), design, development, and implementation.
- Information systems professionals often make the equivalent of a sketch of the design of the final system. When the sketches are crude they are called wireframes; when they are more refined they are called mockups. However, sometimes the terms are used interchangeably.
Questions and Exercises
- Watch a home improvement show such as Curb Appeal and identify all five stages of the SDLC in the show. About how much time does the show devote to each stage?
- Read and summarize an article on interface design from humanfactors.com.