This is “The Computation of Earnings per Share”, section 16.5 from the book Business Accounting (v. 2.0). For details on it (including licensing), click here.
For more information on the source of this book, or why it is available for free, please see the project's home page. You can browse or download additional books there. To download a .zip file containing this book to use offline, simply click here.


16.5 The Computation of Earnings per Share
Learning Objectives
At the end of this section students should be able to meet the following objectives:
- Compute and explain return on equity.
- Discuss the reasons that earnings per share (EPS) figures are so closely watched by investors.
- Calculate basic EPS with or without the existence of preferred stock.
- Explain the relevance of the P/E ratio.
- Identify the informational benefit provided by diluted EPS.
The Calculation of Return on Equity
Question: Throughout this textbook, various vital signs have been presented. They include ratios, numbers, percentages, and the like that are commonly studied by decision makers as an indication of current financial health and future prosperity. One common measure is return on equity (ROE)Ratio computed to measure the profitable use of a business’s resources; it is determined by dividing net income by average stockholders’ equity for the period.. How does an interested party calculate the return on equity reported by a business?
Answer: Return on equity reflects the profitability of a business based on the size of the owners’ claim to net assets. It is simply the reported net income divided by average stockholders’ equity for the period.
return on equity = net income/average stockholders’ equityFor example, PPG Industries Inc. began 2010 with total stockholders’ equity of $3,922 million. Partly because of a large acquisition of treasury stock and the payment of a $360 million cash dividend, the company ended that year with stockholders’ equity of only $3,833 million. For the year ended December 31, 2010, PPG reported net income of $880 million for a return on equity of 22.7 percent.
average stockholders’ equity: ($3,922 million + $3,833 million)/2 = $3,877.5 million return on equity: $880 million/$3,877.5 million = 22.7%As with all such vital signs, the strength or weakness of PPG’s 22.7 percent return on equity is difficult to evaluate in isolation. Comparison with other similar companies can be very helpful as is the trend for this particular company over time. For example, decision makers looking at PPG were likely to be particularly impressed with the 2010 return on equity after learning that the 2009 return on equity was 11.5 percent.
Earnings per Share and the P/E Ratio
Question: No single “vital sign” that is computed to help investors analyze a business and its financial health is more obsessively watched than earnings per share (EPS). Corporations even call press conferences to announce their latest EPS figures. According to U.S. GAAP, public companies are required to present EPS for each period that net income is reported. As just one example, Pfizer Inc. disclosed basic EPS of $1.03 on its income statement for the year ended December 31, 2010. Why is the EPS reported by a corporation so closely monitored by the investment community?
Answer: The simple reason for the public fascination with EPS is that this number is generally considered to be linked to the market price of a company’s capital stock. Therefore, constant and wide-scale speculation takes place about future EPS figures as a technique for forecasting future stock prices. If analysts merely predict an increase in EPS, this forecast alone can lead to a surge in the traded price of a company’s shares.
A price-earnings ratio (P/E ratio)A ratio computed by dividing the current market price of an entity’s stock by the latest earnings per share balance; it is used to help predict future stock prices based on anticipated EPS figures. is even computed to help quantify this relationship. The P/E ratio is the current price of the stock divided by the latest EPS figure. It enables investors to anticipate movements in the price of a stock based on projections of earnings per share. If a company’s P/E ratio is twenty and is expected to remain constant, then an increase in EPS of $1 should lead to a $20 rise in stock price.
Theories abound as to how P/E ratios should be used. Some investors only buy capital shares of companies with high P/E ratios. They believe the P/E ratio indicates businesses that the stock market has assessed as particularly strong with excellent future prospects. Other investors prefer companies with low P/E ratios because those stocks may well be undervalued by the market with more room for the price to grow.
Figure 16.13 As of November 23, 2011, the P/E ratio for Several Prominent Companies

The ongoing debate as to whether EPS and the P/E ratio are over emphasized as investing tools is a controversy better left to upper-level finance courses. The fascination is certainly real regardless of whether the perceived benefits are as great as many decision makers believe.
Calculating Earnings per Share
Question: EPS is obviously a much analyzed number in a set of financial statements. How is EPS calculated?
Answer: EPS is a common stock computation designed to measure operating results after all other claims have been satisfied. In simplest form, EPS (often referred to as basic EPSA figure that must be reported by corporations that have their stock publicly traded; it is net income less preferred stock dividends divided by the weighted-average number of shares of common stock outstanding during the period.) is the net income for the period divided by the weighted average number of outstanding shares of common stock. The computation allocates a company’s income equally to each of its shares.
To illustrate, assume the Maris Company reports its most recent net income as $700,000. If the company has a weighted average of 200,000 shares of common stock outstanding for this period of time, EPS is $700,000/200,000 or $3.50 per share. Furthermore, if the market price of Maris Company stock is $35, then the P/E ratio is 35/3.50, or ten.
Because EPS only relates to common stock, this computation is altered slightly if any preferred stock shares are also outstanding. Preferred stock is normally entitled to a specified dividend before common stock has any claim. However, most preferred stocks get nothing other than that dividend. Therefore, in determining basic EPS, any preferred stock dividend must be removed to arrive at the portion of income that is attributed to the ownership of common stock.
Basic EPS (net income – preferred stock dividend)/average number of common shares outstandingTest Yourself
Question:
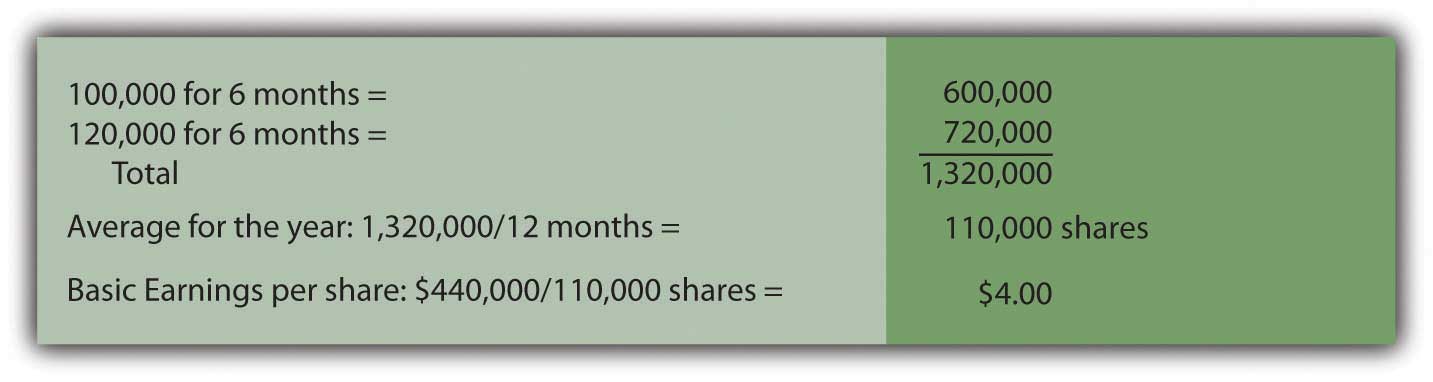
Daryl Corporation’s net income for the current year is reported as $450,000. Preferred stock dividends for the same period amount to $10,000. On January 1, 100,000 shares of common stock were outstanding. On July 1, 20,000 additional shares of common stock were issued. What is Daryl’s EPS?
- $3.67
- $4.00
- $4.40
- $4.50
Answer:
The correct answer is choice b: $4.00.
Explanation:
The income attributed to common stock is $440,000, the reported balance of $450,000 less the $10,000 preferred stock dividend. The weighted average number of outstanding common shares for this year was 110,000. The company had 100,000 shares of common stock outstanding during the first six months and 120,000 shares for the second six months.
Figure 16.14
Test Yourself
Question:
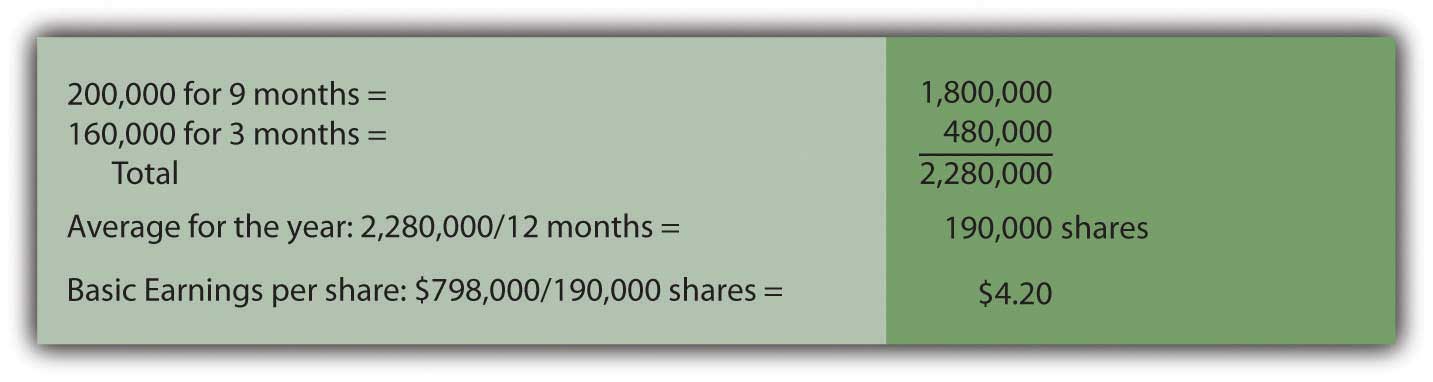
The latest income statement for the St. John Corporation reports net income of $828,000. Preferred dividends for the period were $30,000. On January 1, 200,000 shares of common stock were outstanding. However, on October 1, 40,000 shares of this common stock were repurchased as treasury stock. What is St. John’s basic EPS?
- $3.28
- $3.78
- $4.20
- $4.73
Answer:
The correct answer is choice c: $4.20.
Explanation:
The income attributed to common stock is $798,000, the reported balance of $828,000 for the period less the $30,000 preferred stock dividend. The weighted average number of outstanding common shares for this year was 190,000. The company had 200,000 shares of common stock outstanding during the first nine months of the year but only 160,000 shares for the final three months (as a result of buying back the shares of treasury stock).
Figure 16.15
Diluted Earnings per Share
Question: For the year ended March 31, 2011, the McKesson Corporation reported basic EPS of $4.65 per share. However, this company also reported a second figure, diluted EPS, which was only $4.57 per share. What is the meaning of diluted EPS? Why is diluted EPS also reported by some businesses along with basic EPS?
Answer: All publicly traded companies must disclose basic EPS. Income reported for the period (after removal of any preferred stock dividends) is allocated evenly over the weighted average number of shares of outstanding common stock. Basic EPS is a mechanically derived figure based on the historically reported income and number of shares outstanding.
Many corporations also have other contractual obligations outstanding that could become common stock and, therefore, potentially affect this computation. Stock options, convertible bonds, and convertible preferred stock can each be exchanged in some manner for common stock shares. The decision to convert is usually up to the holder and out of the control of the company. If these conversions ever take place, the additional shares could cause EPS to drop—possibly by a significant amount. This potential reduction should be brought to the attention of investors.
Diluted EPSHypothetical computation that reduces basic earnings per share to reflect the possible decrease if outstanding convertible items are actually turned into common stock; it includes the potential impact of stock options, convertible bonds, convertible preferred stock, and the like to warn decision makers of the “worst case scenario” if those convertibles are ever turned into common stock. serves as a warning to decision makers of the possible impact that the existence of convertibles can have on ownership. It provides a “worst case scenario” by setting up a hypothetical computation to give weight to the possibility of such conversions. Because of the complicated steps that are involved, the actual mechanical process is better left to an intermediate accounting course. However, an understanding of the purpose of reporting diluted EPS is worthwhile at the introductory level.
Stock options, convertible bonds, convertible preferred stocks, and the like could become common stock and reduce a company’s reported EPS. Thus, U.S. GAAP requires that this possible impact is calculated and shown by the reporting of a lower diluted EPS. For the McKesson Corporation, if all other transactions stayed the same except that its convertible items were exchanged for common stock, basic EPS would fall from $4.65 to $4.57. That is the possible dilution that could be caused by the presence of items convertible into common stock. For an investor or potential investor, that is information of interest. Including this figure alerts decision makers to the possibility of such conversions and helps them quantify the potential impact.
Key Takeaway
Return on equity (ROE) is a percentage often computed by financial analysts to help evaluate the profitability of a business. It is net income divided by the average stockholders’ equity for that period of time. Likewise, the reporting of earnings per share (EPS) draws an especially wide circle of interest. EPS is considered by most decision makers who are looking at a particular business. Basic EPS must be reported by every publicly traded company for each year in which net income is reported. It is the net income for the period divided by the weighted average number of common stock shares outstanding. Because EPS is only determined for common stock, any preferred stock dividends must be removed from net income as a preliminary step in this computation. The resulting EPS figure is viewed as having a major impact on the movement of the company’s stock price. The price-earnings (P/E) ratio even quantifies that effect. If a corporation also has items such as stock options or convertible bonds that can be turned into common stock, their conversion could potentially have an adverse impact on EPS. Thus, if a company has any convertibles outstanding, diluted EPS must also be reported to help investors understand the possible negative impact that might result from future conversions.
Talking with a Real Investing Pro (Continued)
Following is a continuation of our interview with Kevin G. Burns.
Question: Investors in the United States seem to have an obsession about the reporting of earnings per share (EPS). Even slight movements in projected EPS figures can create significant swings in the market price of a company’s stock. Do you think there is an overemphasis on EPS in the public’s investing decisions? How closely do you pay attention to the EPS figures that are reported by the businesses that you are following?
Kevin Burns: This is a very good question. By now students should realize that accounting is really all about estimates. Although investors would like accounting to be objectively exact, reporting such estimates really requires an awful lot of subjectivity. For example, for many years, General Electric would almost always report EPS a penny or two above market expectations. This was quarter after quarter like clockwork. It got to the point where if the company didn’t “beat” the estimates on the street by a penny or two, the market was disappointed. It is absurd to believe that this is meaningful. This is especially true when earnings can also be managed simply by delaying or speeding up a major transaction from one time period to another. I believe that EPS, although important, is not the ultimate piece of information that some investors seem to think. I am much more concerned about asset values, growth prospects, and what a company does with the cash it is able to generate.
Video Clip
(click to see video)Professor Joe Hoyle talks about the five most important points in Chapter 16 "In a Set of Financial Statements, What Information Is Conveyed about Shareholders’ Equity?".