This is “Why Does a Company Need a Cost Flow Assumption in Reporting Inventory?”, chapter 9 from the book Business Accounting (v. 2.0). For details on it (including licensing), click here.
For more information on the source of this book, or why it is available for free, please see the project's home page. You can browse or download additional books there. To download a .zip file containing this book to use offline, simply click here.


Chapter 9 Why Does a Company Need a Cost Flow Assumption in Reporting Inventory?
Video Clip
(click to see video)In this video, Professor Joe Hoyle introduces the essential points covered in Chapter 9 "Why Does a Company Need a Cost Flow Assumption in Reporting Inventory?".
9.1 The Necessity of Adopting a Cost Flow Assumption
Learning Objectives
At the end of this section, students should be able to meet the following objectives:
- Understand that accounting rules tend to be standardized so that companies must often report events according to one set method.
- Know that the selection of a particular cost flow assumption is necessary when inventory items are bought at more than one cost.
- Apply each of the following cost flow assumptions to determine reported balances for ending inventory and cost of goods sold: specific identification, FIFO, LIFO, and averaging.
Accounting for Inventory When Costs Vary Over Time
Question: In the coverage of financial accounting to this point, general standardization has been evident. Most transactions are reported in an identical fashion by all companies. This defined structure (created by U.S. GAAP or IFRS) helps ensure understandable communication. It also enhances the ability of decision makers to compare results from one year to the next and from one company to another. For example, inventory—except in unusual circumstances—appears on a balance sheet at historical cost unless its value is lower. Consequently, experienced decision makers should be well aware of the normal meaning of a reported inventory figure.
However, an examination of the notes to financial statements for several well-known businesses shows an interesting inconsistency in the reporting of inventory (emphasis added).
Mitsui & Co. (U.S.A.)—as of March 31, 2011: “Commodities and materials for resale are stated at the lower of cost or market. Cost is determined using the specific identification method or average cost.”
Johnson & Johnson—as of January 2, 2011: “Inventories are stated at the lower of cost or market determined by the first-in, first-out method.”
Safeway Inc.—as of January 1, 2011: “Merchandise inventory of $1,685 million at year-end 2010 and $1,629 million at year-end 2009 is valued at the lower of cost on a last-in, first-out (“LIFO”) basis or market value.”
Bristol-Myers Squibb—as of December 31, 2010: “Inventories are stated at the lower of average cost or market.”
“Specific-identification method,” “first-in, first-out method,” “last-in, first-out basis,” “average cost”—these are cost flow assumptions. What information do these terms provide about reported inventory balances? Why are such methods necessary? Why are all four of these businesses using different cost flow assumptions? In the financial reporting of inventory, what is the significance of disclosing that a company applies “first-in, first-out,” “last-in, first-out,” or the like?
Answer: In the previous chapter, the cost of all inventory items was kept constant over time. The first bicycle cost $260 and every bicycle purchased thereafter also had a cost of $260. This consistency helped simplify the introductory presentation of accounting issues in the coverage of inventory. However, such stability is hardly a realistic assumption. For example, the retail price of gasoline has moved up and down like a yo-yo in recent years. The costs of some commodities, such as bread and soft drinks, have increased gradually for many decades. In other industries, prices actually tend to fall over time. New technology products often start with a high price that drops as the manufacturing process ramps up and becomes more efficient. Several years ago, personal computers cost tens of thousands of dollars and now sell for hundreds.
A key event in accounting for inventory is the transfer of cost from the inventory T-account to cost of goods sold as the result of a sale. The inventory balance is reduced and the related expense is increased. For large organizations, such transactions take place thousands of times each day. If each item has an identical cost, no problem exists. This established amount is reclassified from asset to expense to reflect the sale (either at the time of sale in a perpetual system or when financial statements are produced in a periodic system).
However, if inventory items are acquired at different costs, a problem is created: Which of these costs is moved from asset to expense to reflect a sale? To resolve that question, a cost flow assumption must be selected by company officials to identify the cost that remains in inventory and the cost that moves to cost of goods sold. This choice can have a significant and ongoing impact on both income statement and balance sheet figures. Investors and creditors cannot properly analyze the reported net income and inventory balance of a company such as ExxonMobil without knowing the cost flow assumption that has been utilized.
Applying Cost Flow Assumptions
Question: To illustrate, assume a men’s retail clothing store holds $120 in cash. Numbers will be kept artificially low in this example so that the impact of the various cost flow assumptions is easier to visualize. On December 2, Year One, one blue dress shirt is bought for $50 in cash and added to inventory. Later, near the end of the year, this style of shirt suddenly becomes especially popular and prices skyrocket. On December 29, Year One, the store manager buys a second shirt exactly like the first but this time at a cost of $70. Cash on hand has been depleted ($120 less $50 and $70), but the company holds two shirts in its inventory.
On December 31, Year One, a customer buys one of these two shirts by paying cash of $110. Regardless of the cost flow assumption, the company retains one blue dress shirt in inventory at the end of the year and cash of $110. It also reports sales revenue of $110. Those facts are not in dispute.
From an accounting perspective, only two questions must be resolved: (1) what is the cost of goods sold reported for the one shirt that was sold, and (2) what is the cost remaining in inventory for the one item still on hand?
Should the $50 or $70 cost be reclassified to cost of goods sold? Should the $50 or $70 cost remain in ending inventory? In financial accounting, the importance of the answers to those questions cannot be overemphasized. If the shirts are truly identical, answers cannot be determined by any type of inspection; thus, a cost flow assumption is necessary. What are the various cost flow assumptions, and how are they applied to inventory?
Answer:
Specific Identification. In a literal sense, specific identificationInventory cost flow method in which a company physically identifies both its remaining inventory and the inventory that was sold to customers. is not a cost flow assumption. Companies that use this method are not making an assumption because they know which item was sold. In some way, the inventory conveyed to the customer can be identified so that the actual cost is reclassified to expense to reflect the sale.
For some types of inventory, such as automobiles held by a car dealer, specific identification is relatively easy to apply. Each vehicle tends to be somewhat unique and can be tracked through identification numbers. Unfortunately, for many other types of inventory, no practical method exists for determining the physical flow of specific goods from seller to buyer.
Thus, if the men’s retail store maintains a system where individual shirts are coded when acquired, it will be possible to know whether the $50 shirt or the $70 shirt was actually conveyed to the first customer. That cost can then be moved from inventory to cost of goods sold.
However, for identical items like shirts, cans of tuna fish, bags of coffee beans, hammers, packs of notebook paper and the like, the idea of maintaining such precise records is ludicrous. What informational benefit could be gained by knowing whether the first blue shirt was sold or the second? In most cases, unless merchandise items are both expensive and unique, the cost of creating such a meticulous record-keeping system far outweighs any potential advantages.
First-in, first-out (FIFO). The FIFOInventory cost flow assumption based on the oldest costs being transferred first from inventory to cost of goods sold so that the most recent costs remain in ending inventory. cost flow assumption is based on the premise that selling the oldest item first is most likely to mirror reality. Stores do not want inventory to lose freshness. The oldest items are often displayed on top in hopes that they will sell before becoming stale or damaged. Therefore, although the identity of the actual item sold is rarely known, the assumption is made in applying FIFO that the first (or oldest) cost is moved from inventory to cost of goods sold when a sale occurs.
Note that it is not the oldest item that is necessarily sold but rather the oldest cost that is reclassified first. No attempt is made to determine which shirt was purchased by the customer. Consequently, an assumption is necessary.
Here, because the first shirt cost $50, the entry in Figure 9.1 "Journal Entry—Reclassification of the Cost of One Piece of Inventory Using FIFO" is made to reduce the inventory and record the expense.
Figure 9.1 Journal Entry—Reclassification of the Cost of One Piece of Inventory Using FIFO
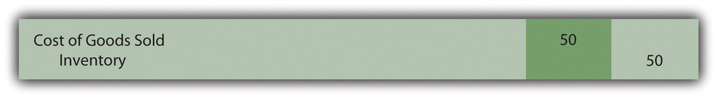
After the sale is recorded, the following financial information is reported by the retail story but only if FIFO is applied. Two shirts were bought for ($50 and $70), and one shirt was sold for $110.
| FIFO | |
|---|---|
| Cost of Goods Sold (one unit sold—the cost of the first one) | $50 |
| Gross Profit ($110 sales price less $50 cost) | $60 |
| Ending Inventory (one unit remains—the cost of the last one) | $70 |
In a period of rising prices, the earliest (cheapest) cost moves to cost of goods sold and the latest (more expensive) cost remains in ending inventory. For this reason, in inflationary times, FIFO is associated with a higher reported net income as well as a higher reported inventory total on the company’s balance sheet. Not surprisingly, these characteristics help make FIFO a popular choice.
Test Yourself
Question:
A hardware store buys a lawn mower on Monday for $120, another identical model on Tuesday for $125, another on Wednesday for $132, and a final one on Thursday for $135. One is then sold on Friday for $180 in cash. The company uses the FIFO cost flow assumption for inventory. Because an identification number was left on the lawn mower bought on Tuesday, company officials know that this lawn mower was actually the one sold to the customer. In the accounting system, that specific cost is moved from inventory to cost of goods sold. Which of the following is true?
- Reported inventory is too high by $5.
- Gross profit is too high by $5.
- Working capital is too low by $5.
- Net income is correctly stated.
Answer:
The correct answer is choice c: Working capital is too low by $5.
Explanation:
Because FIFO is applied, the first cost ($120) should be moved from inventory to cost of goods sold instead of $125 (the cost of the Tuesday purchase). Cost of goods sold is too high by $5 and inventory is too low by the same amount. Working capital (current assets less current liabilities) is understated because the inventory balance within the current assets is too low. Because the expense is too high, both gross profit and net income are understated (too low).
Last-in, first-out (LIFO). LIFOInventory cost flow assumption based on the most recent costs being transferred first from inventory to cost of goods sold so that the oldest costs remain in ending inventory. is the opposite of FIFO: The most recent costs are moved to expense as sales are made.
Theoretically, the LIFO assumption is often justified as more in line with the matching principle. Shirt One was bought on December 2 whereas Shirt Two was not acquired until December 29. The sales revenue was generated on December 31. Proponents of LIFO argue that matching the December 29 cost with the December 31 revenue is more appropriate than using a cost incurred several weeks earlier. According to this reasoning, income is more properly determined with LIFO because a relatively current cost is shown as cost of goods sold rather than a figure that is out-of-date.
The difference in reported figures is especially apparent in periods of high inflation which makes this accounting decision even more important. “By matching current costs against current sales, LIFO produces a truer picture of income; that is, the quality of income produced by the use of LIFO is higher because it more nearly approximates disposable income.”Clayton T. Rumble, “So You Still Have Not Adopted LIFO,” Management Accountant, October 1983, 50. Note 1 to the 2010 financial statements for ConocoPhillips reiterates that point: “LIFO is used to better match current inventory costs with current revenues.”
The last cost incurred in buying blue shirts was $70 so this amount is reclassified to expense at the time of the first sale as shown in Figure 9.2 "Journal Entry—Reclassification of the Cost of One Piece of Inventory Using LIFO".
Figure 9.2 Journal Entry—Reclassification of the Cost of One Piece of Inventory Using LIFO
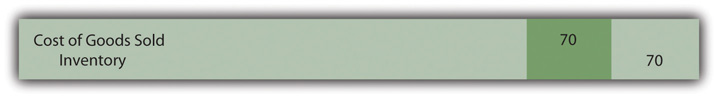
Although the physical results of these transaction are the same (one unit was sold, one unit was retained, and the company holds $110 in cash), the financial picture painted using the LIFO cost flow assumption is quite different from that shown previously in the FIFO example.
| LIFO | |
|---|---|
| Cost of Goods Sold (one unit sold—the cost of the last one) | $70 |
| Gross Profit ($110 sales price less $70 cost) | $40 |
| Ending Inventory (one unit remains—the cost of the first one) | $50 |
Characteristics commonly associated with LIFO can be seen in this example. When prices rise, LIFO companies report lower net income (the most recent and, thus, the most costly purchases are moved to expense) and a lower inventory account on the balance sheet (the earlier, cheaper costs remain in the inventory T-account). As will be discussed in a subsequent section, LIFO is popular in the United States because it helps reduce the amount many companies must pay in income taxes.
Test Yourself
Question:
A hardware store buys a lawn mower on Monday for $120, another identical model on Tuesday for $125, another on Wednesday for $132, and a final one on Thursday for $135. One is sold on Friday for $180 in cash. The company applied FIFO although company officials had originally argued for the use of LIFO. Which of the following statements are true?
- If the company had applied LIFO, its net income would have been $10 lower than is being reported.
- If the company had applied LIFO, gross profit would have been $15 lower than is being reported.
- If the company had applied LIFO, inventory on the balance sheet would have been $15 higher than is being reported.
- If the company had applied LIFO, cost of goods sold would have been $10 higher than is being reported.
Answer:
The correct answer is choice b: If the company had applied LIFO, gross profit would have been $15 lower than is being reported.
Explanation:
In FIFO, the $120 cost is removed from inventory and added to cost of goods sold because it is the first cost acquired. Under LIFO, the $135 cost of the last lawn mower would have been reclassified. Thus, in using LIFO, cost of goods sold is $15 higher so that both gross profit and net income are $15 lower. Because the higher (later) cost is removed from inventory, this asset balance will be $15 lower under LIFO.
Averaging. Because the identity of the items conveyed to buyers is unknown, this final cost flow assumption holds that averagingInventory cost flow assumption based on the average cost being transferred from inventory to cost of goods sold so that this same average cost remains in ending inventory. all costs is the most logical solution. Why choose any individual cost if no evidence exists of its validity? The first item received might have been sold or the last. Selecting either is an arbitrary decision. If items with varying costs are held, using an average provides a very appealing logic. In the shirt example, the two units cost a total of $120 ($50 plus $70) so the average is $60 ($120/2 units).
Figure 9.3 Journal Entry—Reclassification of the Cost of One Piece of Inventory Using Averaging
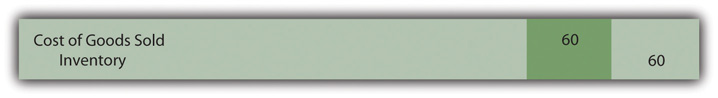
Although no shirt actually cost $60, this average serves as the basis for reporting both cost of goods sold and the item still on hand. Therefore, all costs are included in arriving at each of these figures.
| Averaging | |
|---|---|
| Cost of Goods Sold (one unit sold—the cost of the average one) | $60 |
| Gross Profit ($110 sales price less $60 cost) | $50 |
| Ending Inventory (one unit remains—the cost of the last one) | $60 |
Averaging has many supporters. However, it can be a rather complicated system to implement especially if inventory costs change frequently. In addition, it does not offer the benefits that make FIFO (higher reported income) and LIFO (lower taxes in the United States) so appealing. Company officials often arrive at practical accounting decisions based more on an evaluation of advantages and disadvantages rather than on theoretical merit.
Test Yourself
Question:
A hardware store buys a lawn mower on Monday for $120, another identical model on Tuesday for $125, another on Wednesday for $132, and a final one on Thursday for $135. One is sold on Friday for $180 in cash. Company officials are trying to decide whether to select FIFO, LIFO, or averaging as the cost flow assumption. Which of the following statements is true?
- Gross profit under FIFO is $7 higher than under averaging.
- Gross profit under averaging is $7 higher than under LIFO.
- Gross profit under averaging is $7 lower than under FIFO.
- Gross profit under LIFO is $7 lower than under FIFO.
Answer:
The correct answer is choice b: Gross profit under averaging is $7 higher than under LIFO.
Explanation:
With FIFO, $120 (the first cost) is moved out of inventory and into cost of goods sold. Gross profit is $60 ($180 less $120). For LIFO, $135 (the last cost) is transferred to expense to gross profit is $45 ($180 less $135). In averaging, an average of $128 is calculated ([$120 + $125 + $132 + $135]/4 units). That cost is then reclassified from inventory to cost of goods sold so that gross profit is $52 ($180 less $128). FIFO is $8 higher than averaging; averaging is $7 higher than LIFO.
Key Takeaway
U.S. GAAP tends to apply standard reporting rules to many transactions to make resulting financial statements more easily understood by decision makers. The application of an inventory cost flow assumption is one area where significant variation does exist. A company can choose to use specific identification, first-in, first-out (FIFO), last-in, first-out (LIFO), or averaging. In each of these assumptions, a different cost is moved from inventory to cost of goods sold to reflect the sale of merchandise. The reported inventory balance as well as the expense on the income statement (and, hence, net income) are dependent on the cost flow assumption that is selected. In periods of inflation, FIFO reports a higher net income than LIFO and a larger inventory balance. Consequently, LIFO is popular because it is often used to reduce income tax costs.
9.2 The Selection of a Cost Flow Assumption for Reporting Purposes
Learning Objectives
At the end of this section, students should be able to meet the following objectives:
- Appreciate that reported inventory and cost of goods sold balances are not intended to be right or wrong but rather in conformity with U.S. GAAP, which permits the use of several different cost flow assumptions.
- Recognize that three cost flow assumptions (FIFO, LIFO, and averaging) are particularly popular in the United States.
- Understand the meaning of the LIFO conformity rule and realize that use of LIFO in the United States largely stems from the presence of this tax law.
- Know that U.S. companies prepare financial statements according to U.S. GAAP but their income tax returns are based on the Internal Revenue Code so that significant differences often exist.
Presenting Inventory Balances Fairly
Question: FIFO, LIFO, and averaging can present radically different portraits of identical events. Is the gross profit for this men’s clothing store really $60 (FIFO), $40 (LIFO), or $50 (averaging) following the sale of one blue dress shirt? Analyzing inventory numbers presented by most companies can be difficult if not impossible without understanding the implications of the cost flow assumption that was applied. Which cost flow assumption is viewed as most appropriate in producing fairly presented financial statements?
Answer: Because specific identification reclassifies the cost of the actual unit that was sold, finding theoretical fault with that approach is difficult. Unfortunately, specific identification is nearly impossible to apply unless easily distinguishable differences exist between similar inventory items. For a vast majority of companies, that leaves FIFO, LIFO, and averaging. Arguments over their merits and their problems have raged for decades. Ultimately, information in financial statements must be presented fairly based on the cost flow assumption that is utilized.
In a previous chapter, an important clarification was made about the report of the independent auditor. It never assures decision makers that financial statements are “presented fairly.” That is a hopelessly abstract concept like truth and beauty. Instead, the auditor states that the statements “present fairly…in conformity with accounting principles generally accepted in the United States of America.” That is a substantially more objective standard. Thus, for this men’s clothing store, all the numbers in Figure 9.4 "Results of Possible Cost Flows Assumptions Used by Clothing Store" are presented fairly but only in conformity with the specific cost flow assumption that was applied.
Figure 9.4 Results of Possible Cost Flows Assumptions Used by Clothing Store

Most Popular Cost Flow Assumptions
Question: Since company officials are allowed to select a cost flow assumption, which of these methods is most typically found in the financial reporting of companies operating in the United States?
Answer: To help interested parties gauge the usage of various accounting methods and procedures, a survey is carried out annually of the financial statements of 500 large companies. The resulting information allows accountants, auditors, and decision makers to weigh the validity of a particular presentation. For 2009, this survey found the following frequency for the various cost flow assumptions. Some companies actually use multiple assumptions: one for a particular portion of its inventory and a different one for the remainder. Thus, the total here is above 500 even though 98 of the surveyed companies did not report having inventory or mention a cost flow assumption (inventory was probably an immaterial amount). As will be discussed later in this chapter, applying multiple assumptions is especially common when a U.S. company owns subsidiaries that are located internationally.
| Inventory Cost Flow Assumptions—500 Companies SurveyedMatthew C. Calderisi, senior editor, Doug Bowman, senior technical manager, and David Cohen, developmental editor, Accounting Trends & Techniques, 64th edition (New York: American Institute of Certified Public Accountants, 2010), 169. | |
|---|---|
| First-in, First-out (FIFO) | 325 |
| Last-in, First-out (LIFO) | 176 |
| Averaging | 147 |
| Other | 18 |
Interestingly, individual cost flow assumptions tend to be more prevalent in certain industries. In this same survey, 92 percent of the financial statements issued by food and drug stores made use of LIFO whereas only 11 percent of the companies labeled as “computers, office equipment” had adopted this same approach. This difference is likely caused by the presence of inflation or deflation in those industries. Prices of food and drugs tend to escalate consistently over time while computer prices often fall as technology advances.
The LIFO Conformity Rule
Question: In periods of inflation, FIFO reports a higher gross profit (and, hence, net income) and a higher inventory balance than does LIFO. Averaging presents figures that normally fall between these two extremes. Such results are widely expected by the readers of financial statements who understand the impact of the various cost flow assumptions.
In the United States, all of these methods are permitted for financial reporting. Why is FIFO not the obvious choice for every organization that anticipates inflation in its inventory costs? Officials must prefer to report figures that make the company look stronger and more profitable. With every rise in prices, FIFO shows a higher income because the earlier (cheaper) costs are transferred to cost of goods sold. Likewise, FIFO reports a higher total for ending inventory because the later (higher) cost figures are retained in the inventory T-account. The company is no different physically as a result of this decision but FIFO makes it look better. Why does any company voluntarily choose LIFO, an approach that reduces reported income and total assets when prices rise?
Answer: LIFO might well have faded into oblivion because of its negative impact on key reported figures (during inflationary periods) except for a U.S. income tax requirement known as the LIFO conformity ruleA United States income tax rule that requires LIFO to be used for financial reporting purposes if it is adopted for taxation purposes.. Although this tax regulation is not part of U.S. GAAP and looks rather innocuous, it has a huge impact on the way inventory and cost of goods sold are reported in this country.
If costs are increasing, companies prefer to apply LIFO for tax purposes because this assumption reduces reported income and, hence, required cash payments to the government. In the United States, LIFO has come to be universally equated with the saving of tax dollars. When LIFO was first proposed as a tax method in the 1930s, the United States Treasury Department appointed a panel of three experts to consider its validity. The members of this group were split over a final resolution. They eventually agreed to recommend that LIFO be allowed for income tax purposes but only if the company was also willing to use LIFO for financial reporting. At that point, tax rules bled over into U.S. GAAP.
The rationale behind this compromise was that companies were allowed the option but probably would not choose LIFO for their tax returns because of the potential negative effect on the figures reported to investors, creditors, and others. During inflationary periods, companies that apply LIFO do not look as financially healthy as those that adopt FIFO. Eventually this recommendation was put into law and the LIFO conformity rule was born. It is a federal law and not an accounting principle. If LIFO is used on a company’s income tax return, it must also be applied on the financial statements.
However, as the previous statistics on usage point out, this requirement did not prove to be the deterrent that was anticipated. Actual use of LIFO has remained popular for decades. For many companies, the money saved in income tax dollars more than outweighs the problem of having to report numbers that make the company look weaker. Figure 9.5 "Advantages and Disadvantages of FIFO and LIFO" shows that both methods have advantages and disadvantages. Company officials must weigh the options and make a decision.
As discussed later in this chapter, IFRS does not permit the use of LIFO. Therefore, if IFRS is ever mandated in the United States, a significant tax advantage will be lost unless the LIFO conformity rule is abolished.
Figure 9.5 Advantages and Disadvantages of FIFO and LIFO

*Assumes a rise in prices over time.
Test Yourself
Question:
The Cucina Company buys and sells widgets in a highly inflationary market. Prices tend to go up quickly. An analyst is studying the company and notes that LIFO has been selected as the company’s cost flow assumption. Which of the following is not likely to be true?
- Cost of goods sold will come closest to reflecting current costs.
- The inventory balance will be below market value for the items being held.
- The company will have more cash because tax payments will be lower.
- Net income will be inflated.
Answer:
The correct answer is choice d: Net income will be inflated.
Explanation:
With LIFO, the latest costs are moved to cost of goods sold; thus, this expense is more reflective of current prices. These costs are high during inflation so the resulting gross profit and net income are lower. That allows the company to save tax dollars since payments are reduced. The earliest (cheapest) costs remain in inventory, which means this asset is reported at below its current value. LIFO, during inflation, is known for low inventory costs, low income, and low tax payments.
Two Sets of Books
Question: The LIFO conformity rule requires companies that apply LIFO for income tax purposes to also use that same cost flow assumption in conveying financial information to investors and creditors. Are the balances submitted to the government for income tax purposes not always the same as that presented to decision makers in a set of financial statements? Reporting different numbers to different parties seems unethical.
Answer: In both jokes and editorials, businesses are often derisively accused of “keeping two sets of books.” The implication is that one is skewed toward making the company look good (for external reporting purposes) whereas the other makes the company look bad (for taxation purposes). However, the existence of separate accounting records is a practical necessity. One set is based on applicable tax laws while the other enables the company to prepare financial statements according to U.S. GAAP. With two different sets of rules, the outcomes have to look different.
In filing income taxes with the United States government, a company must follow the regulations of the Internal Revenue Code.Many states and some cities also charge a tax on income. Those governments have their own unique set of laws although they often resemble the tax laws applied by the federal government. Those laws have several underlying objectives that influence their development.
First, income tax laws are designed to raise money for the operation of the federal government. Without adequate funding, the government could not provide hospitals, build roads, maintain a military and the like.
Second, income tax laws enable the government to help regulate the health of the economy. Simply by raising or lowering tax rates, the government can take money out of the economy (and slow public spending) or leave money in the economy (and increase public spending). For example, in a recent year, a significant tax break was passed by Congress to aid first-time home buyers. This move was designed to stimulate the housing market by encouraging individuals to consider making a purchase.
Third, income tax laws enable the government to assist certain members of society who are viewed as deserving help. For example, taxpayers who encounter high medical costs or casualty losses are entitled to a tax break. Donations conveyed to an approved charity can also reduce a taxpayer’s tax bill. The rules and regulations were designed to provide assistance for specified needs.
In contrast, in the United States, external financial reporting is governed by U.S. GAAP, a system designed to achieve the fair presentation of accounting information. That is the reason U.S. GAAP exists. Because the goals are different, financial data reported according to U.S. GAAP will not necessarily correspond to the tax figures submitted by the same company to the Internal Revenue Service (IRS). At places, though, agreement can be found between the two sets of rules. For example, both normally recognize a cash sale of merchandise as revenue at the time of sale. However, many differences do exist between the two. A loss on the sale of an investment in equity securities is just one example of a transaction that is handled quite differently for taxes and financial reporting.
Although separately developed, financial statements and income tax returns are tied together at one significant spot: the LIFO conformity rule. If a company chooses to use LIFO in filing its United States income tax return, it must do the same for financial reporting. Without that legal requirement, many companies would likely use FIFO in creating their financial statements and LIFO for their income tax returns. Much of the popularity of LIFO is undoubtedly derived from this tax requirement rather than from any theoretical merit.
Key Takeaway
Information found in financial statements is required to be presented fairly in conformity with U.S. GAAP. Because several inventory cost flow assumptions are allowed, reported numbers can vary significantly from one company to another and still be appropriate. FIFO, LIFO, and averaging are all popular in the United States. Understanding and comparing financial statements is quite difficult without knowing the implications of the method selected. LIFO, for example, tends to produce low net income figures in a period of inflation. This cost flow assumption probably would not be used extensively except for the LIFO conformity rule. That tax law prohibits the use of LIFO for tax purposes unless also applied on the company’s financial statements. Typically, financial reporting and the preparation of income tax returns are unrelated because two sets of rules are used with radically differing objectives. However, the LIFO conformity rule joins these two at this one key spot.
9.3 Problems with Applying LIFO
Learning Objectives
At the end of this section, students should be able to meet the following objectives:
- Recognize that theoretical and practical problems with LIFO have led the creators of IFRS rules to prohibit its use.
- Explain that the most obvious problem associated with LIFO is an inventory balance that can show costs from years (or even decades) earlier, costs that are totally irrelevant today.
- Identify the cause of a LIFO liquidation and the reason that it is viewed as a theoretical concern by accountants.
Reporting Ending Inventory Using LIFO
Question: As a result of the LIFO conformity rule in the tax laws, this cost flow assumption is widely used in the United States. LIFO, though, is not allowed in many other areas of the world. It is not simply unpopular in those locations; its application is strictly forbidden by IFRS. Thus, international companies are often forced to resort to alternatives in reporting their foreign subsidiaries. For example, a note to the 2010 financial statements of American Biltrite Inc. explains that “cost is determined by the last-in, first-out (LIFO) method for approximately 47% of the Company’s domestic inventories. The use of LIFO results in a better matching of costs and revenues. Cost is determined by the first-in, first-out (FIFO) method for the Company’s foreign inventories.”
Why is LIFO not accepted in most countries outside the United States?
Answer: Although LIFO can be supported as providing a better matching of expenses (cost of goods sold) with revenues, a number of serious problems arise from its application. The most common accusation made against LIFO is that it often presents a balance sheet figure that is out-of-date and completely useless. When applying this assumption, the latest costs are moved to cost of goods sold so that earlier costs remain in the inventory account—possibly for years and even decades. After some period of time, this asset balance is likely to report a number that has no relevance to today’s prices.
For example, in its 2010 financial statements, ExxonMobil reported inventory on its balance sheet of approximately $13.0 billion based on applying the LIFO cost flow assumption. In the notes to those financial statements, the company disclosed that the current cost to acquire this same inventory was actually $21.3 billion higher than the number being reported. The asset was shown as $13.0 billion but the price to obtain that merchandise on the balance sheet date was $34.3 billion ($13.0 billion plus $21.3). What is the possible informational value of reporting an asset (one that is being held for sale) at an amount more than $21 billion below its current replacement cost?As will be seen in the next chapter, similar arguments are made in connection with property and equipment—the reported amount and the value can vary greatly. However, those assets are not normally held for resale purpose so that their current worth is of less interest to decision makers. That is the essential problem attributed to LIFO.
To illustrate, assume that a convenience store begins operations and has a tank that holds ten thousand gallons of gasoline. On January 1, 1972, the tank is filled at a cost of $1 per gallon. Almost immediately the price of gasoline jumps to $2 per gallon. During the remainder of 1972, the store buys and sells gas. The tank is filled one final time at the very end of the year bringing total purchases to one million gallons. The first 10,000 gallons were bought at $1.00 per gallon; the next one million gallons cost $2.00 per gallon.
LIFO and FIFO report these results as follows:
| LIFO | |
|---|---|
| Cost of Goods Sold—1,000,000 gallons at last cost of $2 per gallon | $2,000,000 |
| Ending Inventory—10,000 gallons at first cost of $1 per gallon | 10,000 |
| FIFO | |
|---|---|
| Cost of Goods Sold—first 10,000 gallons at $1 per gallon and next 990,000 gallons at $2 per gallon | $1,990,000 |
| Ending Inventory—10,000 gallons at last cost of $2 per gallon | 20,000 |
After just this initial period, the ending inventory balance shown for LIFO (10,000 gallons at $1 per gallon) already differs significantly from the current cost of $2 per gallon.
If this convenience store continues to finish each year with a full tank of 10,000 gallons (certainly not an unreasonable assumption), LIFO will report this inventory at $1 per gallon for the following decades regardless of current prices. The most recent costs get transferred to cost of goods sold every period leaving the first costs ($1 per gallon) in inventory. The tendency to report this asset at a cost expended years in the past is the single biggest reason that LIFO is viewed as an illegitimate cost flow assumption in many countries. That same sentiment would probably exist in the United States except for the LIFO conformity rule.
Test Yourself
Question:
The Lenoir Corporation sells paperback books and boasts in its ads that it holds over one million volumes. Prices have risen over the years and, at the present time, books like those obtained by Lenoir cost between $4 and $5 each. Sandy Sanghvi is thinking about buying shares of the ownership stock of Lenoir and picks up a set of financial statements to help evaluate the company. The inventory figure on the company’s balance sheet is reported as $832,000 based on the application of LIFO. Which of the following is Sanghvi most likely to assume?
- Lenoir has many subsidiaries in countries outside of the United States.
- Lenoir officials prefer to minimize tax payments rather than looking especially healthy in an economic sense.
- Lenoir’s net income is likely to be slightly inflated because of the impact of inflation.
- Lenoir is likely to use different cost flow assumptions for financial reporting and income tax purposes.
Answer:
The correct answer is choice b: Lenoir officials prefer to minimize tax payments rather than looking especially healthy in an economic sense.
Explanation:
Knowledge of financial accounting provides a decision maker with an understanding of many aspects of the information reported by a company. Here, the inventory balance is significantly below current cost, which is common for LIFO, an assumption that often serves to reduce taxable income in order to decrease tax payments. Because of the LIFO conformity rule, use of that assumption for tax purposes requires that it also be adopted for financial reporting purposes. It is normally not used by foreign companies.
LIFO Liquidation
Question: In discussions of financial reporting, LIFO is also criticized because of the possibility of an event known as a LIFO liquidationA decrease in the quantity of inventory on hand when LIFO is applied so that costs incurred in a previous period are mismatched with revenues of the current period; if inflation has occurred, it can cause a significant increase in reported net income.. What is a LIFO liquidation and why does it create a theoretical problem for accountants?
Answer: As demonstrated above, costs from much earlier years often remain in the inventory T-account over a long period of time if LIFO is applied. With that cost flow assumption, a convenience store that opens in 1972 and ends each year with a full tank of 10,000 gallons of gasoline reports ending inventory at 1972 costs for years or even decades. Every balance sheet will show inventory as $10,000 (10,000 gallons in ending inventory at $1.00 per gallon).
However, if the quantity of inventory is ever allowed to decrease (accidentally or on purpose), some or all of those 1972 costs move to cost of goods sold. For example, if the convenience store ends 2012 with less than 10,000 gallons of gasoline, the reduction means that costs sitting in the inventory T-account since 1972 are recognized as an expense in the current year. Costs from 40 years earlier are matched with revenue in 2012. That is a LIFO liquidation and it can artificially inflate reported earnings if those earlier costs are especially low.
To illustrate, assume that this convenience store starts 2012 with 10,000 gallons of gasoline. LIFO has been applied over the years so that this inventory is reported at the 1972 cost of $1.00 per gallon. In 2012, gasoline costs the store $3.35 per gallon to buy and is then sold to the public for $3.50 per gallon creating a gross profit of $0.15 per gallon. That is the amount of income the store is making this year.
At the beginning of 2012, the convenience store sells its entire stock of 10,000 gallons of gasoline at the market price of $3.50 and then ceases to carry this product (perhaps the owners want to focus on groceries or automobile parts). Without any replacement of the inventory, the cost of the gasoline bought in 1972 for $1.00 per gallon is shifted from inventory to cost of goods sold in 2012. Instead of recognizing the normal profit margin of $0.15 per gallon or $1,500 for the 10,000 gallons, the store reports gross profit of $2.50 per gallon ($3.50 sales price minus $1.00 cost of goods sold) or $25,000 in total. The reported profit ($25,000) does not reflect the reality of current market conditions. This LIFO liquidation allows the store to look overly profitable.
In a LIFO liquidation, costs from an earlier period are matched with revenues of the present year. Revenue is measured in 2012 dollars but cost of goods sold is stated in 1972 prices. Although the reported figures are technically correct, the implication that this store earned a gross profit of $2.50 per gallon is misleading.
To warn decision makers of the impact that a LIFO liquidation has on reported net income, disclosure in the notes to the financial statements is needed whenever costs are mismatched in this manner. According to a note in the 2010 financial statements for Alcoa Inc. (all numbers in millions), “During the three-year period ended December 31, 2010, reductions in LIFO inventory quantities caused partial liquidations of the lower cost LIFO inventory base. These liquidations resulted in the recognition of income of $27 ($17 after-tax) in 2010, $175 ($114 after-tax) in 2009, and $38 ($25 after-tax) in 2008.”
Test Yourself
Question:
Margaret Besseler is studying the financial statements produced by Associated Chemicals of Rochester. Besseler notices that the footnotes indicate that a LIFO liquidation took place during the most recent year. Which of the following is least likely to be true?
- Inventory quantities decreased during the year.
- Reported net income was inflated by the LIFO liquidation.
- The company converted from the use of LIFO to that of FIFO (or some other cost flow assumption).
- Cost of goods sold was below the current cost of the inventory sold.
Answer:
The correct answer is choice c: The company converted from the use of LIFO to that of FIFO (or some other cost flow assumption).
Explanation:
A LIFO liquidation is a decrease in the quantity of inventory held by a company that applies LIFO so that a cost (often a much cheaper cost) from an earlier time period is moved from inventory to cost of goods sold. That artificially reduces this expense and, hence, increases both reported gross profit and net income. A LIFO liquidation is viewed unfavorably by accountants because an old, out-of-date (often much cheaper) cost is matched with current revenues.
Talking with an Independent Auditor about International Financial Reporting Standards (Continued)
Following is a continuation of our interview with Robert A. Vallejo, partner with the accounting firm PricewaterhouseCoopers.
Question: Companies in the United States are allowed to choose FIFO, LIFO, or averaging as an inventory cost flow assumption. Over the years, many U.S. companies have adopted LIFO, in part because of the possibility of reducing income taxes during a period of inflation. However, IFRS rules do not recognize LIFO as appropriate. Why does such strong resistance to LIFO exist outside the United States? If the United States adopts IFRS will all of these companies that now use LIFO have to switch their accounting systems to FIFO or averaging? How much trouble will that be?
Rob Vallejo: The International Accounting Standards Board revised International Accounting Standard No. 2, Inventories (IAS 2), in 2003. The issue of accounting for inventories using a LIFO costing method was debated and I would encourage anyone seeking additional information to read their basis for conclusion which accompanies IAS 2. The IASB did not believe that the LIFO costing method was a reliable representation of actual inventory flows. In other words, in most industries, older inventory is sold to customers before newer inventory. The standard specifically precludes the use of LIFO, but allows for the use of the FIFO or weighted average costing methods as the board members view these as better representations of actual inventory flows.
Therefore, when U.S. companies have to adopt IFRS, the inventory balances and the related impact on shareholders’ equity will be restated as if FIFO or average costing had been used for all periods presented. Most companies keep their books on a FIFO or weighted average cost basis and then apply a LIFO adjustment, so the switch to an alternative method should not be a big issue in a mechanical sense. However, the reason most companies apply the LIFO costing method relates to U.S. tax law. Companies that want to apply LIFO for income tax purposes are required to also present their financial information under the LIFO method. The big question still being debated is whether or not U.S. tax law will change to accommodate the move to IFRS. This is very important to U.S. companies, as generally, applying LIFO has had a cumulative impact of deferring the payment of income taxes. If companies must change to FIFO or weighted average costing methods for tax purposes, that could mean substantial cash payments to the IRS. This continues to be a very hot topic for accountants and U.S. government officials, as the cash tax implications are significant for many companies.
Key Takeaway
LIFO is used by many companies in the United States because of the LIFO conformity rule. However, troubling theoretical problems do exist. These concerns are so serious that LIFO is prohibited in many places in the world because of the rules established by IFRS. The most recent costs are reclassified to cost of goods sold so earlier costs remain in the inventory account. Consequently, this asset can continue to show inventory costs from years or even decades earlier—a number that would be of little use to any decision maker. In addition, if these earlier costs are ever transferred to cost of goods sold because of shrinkage in the quantity of inventory, a LIFO liquidation is said to occur. Although revenues are from the current year, the related cost of goods sold reflects very old cost numbers. Reported net income is artificially inflated. Thus, information about LIFO liquidations appears in the notes to the financial statements so readers can weigh the impact.
9.4 Merging Periodic and Perpetual Inventory Systems with a Cost Flow Assumption
Learning Objectives
At the end of this section, students should be able to meet the following objectives:
- Merge a cost flow assumption (FIFO, LIFO, and averaging) with a method of monitoring inventory (periodic or perpetual) to arrive at six different systems for determining reported inventory figures.
- Understand that a cost flow assumption is only applied when determining the cost of ending inventory in a periodic system but is used for each reclassification from inventory to cost of goods sold in a perpetual system.
- Calculate ending inventory and cost of goods sold using both a periodic and a perpetual FIFO system.
- Recognize that periodic and perpetual FIFO systems will arrive at identical account balances.
Cost Flow Assumptions and Inventory Systems
Question: In the previous chapter, periodic and perpetual inventory systems were introduced. FIFO, LIFO, and averaging have now been presented. How does all of this material come together for reporting purposes? How does the application of a cost flow assumption impact the operation of a periodic or a perpetual inventory system?
Answer: Each company that holds inventory must develop a mechanism to both (a) monitor the balances and (b) allow for the creation of financial statements. If a periodic system is used, officials simply wait until financial statements are to be produced before taking a physical count. Then, a formula (beginning inventory plus all purchase costs less ending inventory) is applied to derive cost of goods sold.
In contrast, a perpetual system maintains an ongoing record of the goods that remain on hand and those that have been sold. As noted, both of these systems have advantages and disadvantages.
Companies also select a cost flow assumption to specify the cost that is transferred from inventory to cost of goods sold (and, hence, the cost that remains in the inventory T-account). For a periodic system, the cost flow assumption is only applied when the physical inventory count is taken and the cost of the ending inventory is determined. In a perpetual system, the cost flow assumption is used each time a sale is made to identify the cost to be reclassified to cost of goods sold. That can occur thousands of times each day.
Therefore, companies normally choose one of six systems to monitor their merchandise balances and determine the cost assignment between ending inventory and cost of goods sold:
- Periodic FIFO
- Perpetual FIFO
- Periodic LIFO
- Perpetual LIFO
- Periodic averaging (also called weighted averaging)
- Perpetual averaging (also called moving averaging)
Periodic and Perpetual FIFO
Question: To illustrate, assume that the Mayberry Home Improvement Store starts the new year with four bathtubs (Model WET-5) in its inventory, costing $110 each ($440 in total) when bought on December 9 of the previous period. The following events then take place during the current year.
- On February 2, three of these bathtubs are sold for $200 each. (revenue $600)
- On February 6, three new bathtubs of this model are bought for $120 each. (cost $360)
- On June 8, three of these bathtubs are sold for $250 each. (revenue $750)
- On June 13, three new bathtubs of this model are bought for $130 each. (cost $390)
- On September 9, two of these bathtubs are sold for $300 each. (revenue $600)
- On September 22, two new bathtub of this model are bought for $149. (cost $298)
At the end of the year, on December 31, a physical inventory is taken that finds that four bathtubs, Model WET-5, are in stock (4 – 3 + 3 – 3 + 3 – 2 + 2). None were stolen, lost, or damaged during the period. How does a periodic FIFO system differ from a perpetual FIFO system in maintaining accounting records and reporting inventory totals?
Answer: Regardless of the inventory system in use, several pieces of information are established in this example. These figures are factual, not impacted by accounting.
The Facts—Purchase and Sale of WET-5 Bathtubs
- Revenue: Eight units were sold for $1,950 ($600 + $750 + $600)
- Beginning Inventory: Four units costing $110 each or $440 in total
- Purchases: Eight units were bought during the year costing a total of $1,048 ($360 + $390 + $298)
- Ending Inventory: Four units are still held according to the physical inventory
Periodic FIFO. In a periodic system, the cost of all new purchases is the focus of the record keeping. Then, at the end of the period, the accountant must count and also determine the cost of the items held in ending inventory. When using FIFO, the first costs are transferred to cost of goods sold so the cost of the last four bathtubs remain in the inventory T-account. That is the FIFO assumption. The first costs are now in cost of goods sold while the most recent costs remain in the asset account.
In this illustration, the last four costs (starting at the end of the period and moving forward) are two units at $149 each and two units at $130 each for a total of $558. Only after that cost is assigned to the ending inventory units can cost of goods sold be calculated as shown in Figure 9.6 "Periodic FIFO—Bathtub Model WET-5".
Figure 9.6 Periodic FIFO—Bathtub Model WET-5
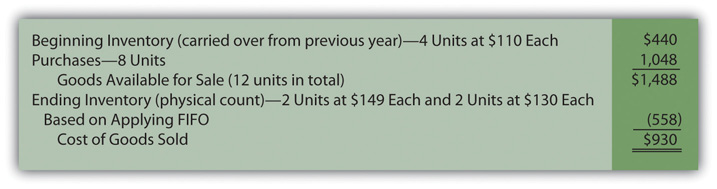
Under FIFO, the last costs for the period remain in ending inventory; the first costs have all been transferred to cost of goods sold. Based on the application of FIFO, Mayberry reports gross profit from the sale of bathtubs during this year of $1,020 (revenue of $1,950 minus the cost of goods sold figure of $930 calculated in Figure 9.6 "Periodic FIFO—Bathtub Model WET-5").
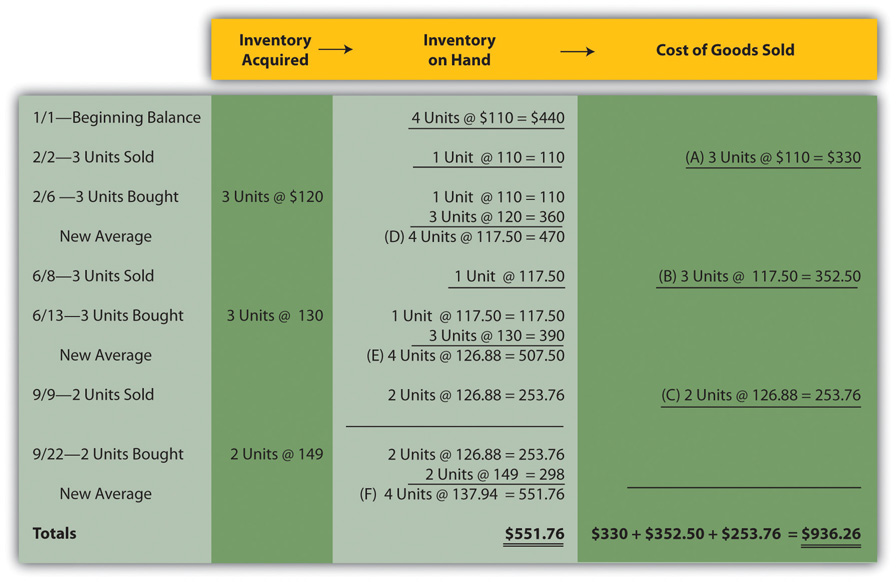
Perpetual FIFO. Perpetual accounting systems are constructed so that costs can be moved from inventory to cost of goods sold at the time of each new sale. With modern computer processing, that is a relatively simple task. In Figure 9.7 "Perpetual FIFO—Bathtub Model WET-5", one format is shown that provides the information needed for this store about the cost and quantity of its inventory of bathtubs. In this figure, at points A, B, and C, costs are moved from inventory on hand to cost of goods sold based on FIFO. The cost of the first goods in the “inventory on hand” is reclassified to cost of goods sold at each of those three points in time.
Figure 9.7 Perpetual FIFO—Bathtub Model WET-5
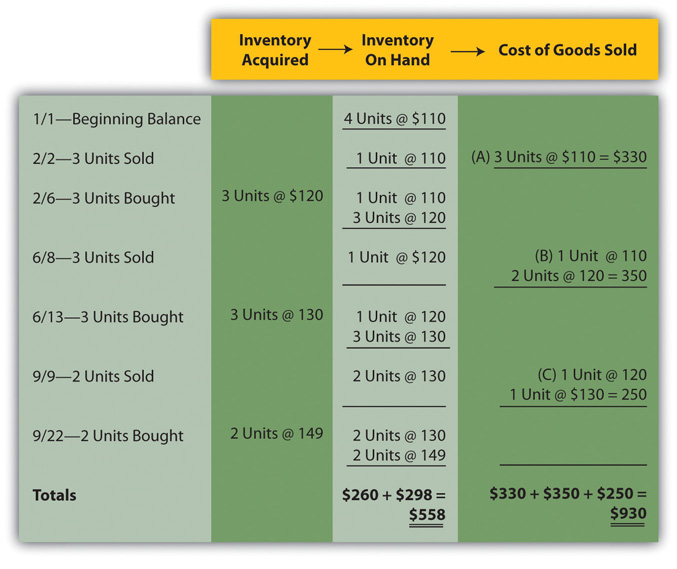
On this perpetual inventory spreadsheet, the final cell in the “inventory on hand” column ($558 or two units @ $130 and two units at $149) provides the cost of the ending inventory to be reported on the balance sheet. However, it is the summation of the entire “cost of goods sold” column that arrives at the expense for the period ($930 or $330 + $350 + $250).
One important characteristic of FIFO should be noted here. Under both periodic and perpetual FIFO, ending inventory is $558 and cost of goods sold is $930. The reported numbers are identical. The first cost for the period is always the first cost regardless of when the assignment to expense is made. Thus, the resulting amounts are the same when using either FIFO system.
For that reason, many companies that apply FIFO maintain perpetual records to track the units on hand throughout the period but ignore the costs. Later, when financial statements are prepared, a periodic computation is used to determine the cost of ending inventory in order to calculate cost of goods sold. That allows these companies to monitor their inventory quantities every day without the expense and effort of identifying the specific cost associated with each new sale.
Test Yourself
Question:
The Hastings Widget Company starts the year with 27,000 widgets costing $2 each. During the year, the company bought another 450,000 widgets for a total of $1,243,000. Within these figures was the acquisition of 20,000 widgets for $3.10 each on December 26 and 15,000 widgets for $3.00 each on December 18. Those were the last two purchases of the year. On December 31, the company took a physical count and found 22,000 widgets still on hand. If a FIFO cost flow assumption is applied, what is cost of goods sold?
- $1,229,000
- $1,233,200
- $1,243,000
- $1,245,800
Answer:
The correct answer is choice a: $1,229,000.
Explanation:
Beginning inventory is $54,000 (27,000 units at $2 each) while purchases are $1,243,000, a total cost of $1,297,000. With FIFO, the remaining 22,000 units had the cost of the last purchases: 20,000 at $3.10 ($62,000) plus 2,000 bought for $3.00 each ($6,000). Ending inventory cost $68,000 ($62,000 + $6,000). Subtracting this cost from the goods available gives cost of goods sold of $1,229,000 ($1,297,000 less $68,000). The use of periodic or perpetual has no impact since FIFO was used.
Key Takeaway
Companies that sell inventory will choose a cost flow assumption such as FIFO, LIFO, or averaging. In addition, a monitoring system (either periodic or perpetual) must be installed to record inventory balances . Six combinations (periodic FIFO, perpetual FIFO, periodic LIFO, and the like) can result from these two decisions. With any periodic system, the cost flow assumption is only used to determine the cost of ending inventory units so that cost of goods sold for the period can be calculated. For a perpetual inventory system, the reclassification of costs from asset to expense is performed each time that a sale is made and is based on the selected cost flow assumption. Periodic FIFO and perpetual FIFO systems arrive at the same reported balances because the earliest cost is always the first to be transferred regardless of the method applied.
9.5 Applying LIFO and Averaging to Determine Reported Inventory Balances
Learning Objectives
At the end of this section, students should be able to meet the following objectives:
- Determine ending inventory and cost of goods sold using a periodic LIFO system.
- Monitor inventory on an ongoing basis through a perpetual LIFO system.
- Understand the reason that periodic LIFO and perpetual LIFO usually arrive at different figures.
- Use a weighted average system to determine the cost of ending inventory and cost of goods sold.
- Calculate reported inventory balances by applying a moving average inventory system.
Applying LIFO
Question: LIFO reverses the FIFO cost flow assumption so that the last costs incurred are the first reclassified to cost of goods sold. How is LIFO applied to the inventory of an actual business? If the Mayberry Home Improvement Store adopted LIFO, how would the reported figures for its inventory have been affected by this decision?
Answer: Periodic LIFO. In a periodic system, only the computation of the ending inventory is directly affected by the choice of a cost flow assumption.Because ending inventory for one period becomes the beginning inventory for the next, application of a cost flow assumption does change that figure also. However, the impact is only indirect because the number is simply carried forward from the previous period. No current computation of beginning inventory is made based on the cost flow assumption in use. Thus, for this illustration, beginning inventory remains $440 (4 units at $110 each), and the number of units purchased is still eight with a cost of $1,048. The figure that changes is the cost of the ending inventory. Four bathtubs remain in stock at the end of the year. According to LIFO, the last (most recent) costs are transferred to cost of goods sold. Only the cost of the first four units remains in ending inventory. That is $110 per unit or $440 in total.
Figure 9.8 Periodic LIFO—Bathtub Model WET-5
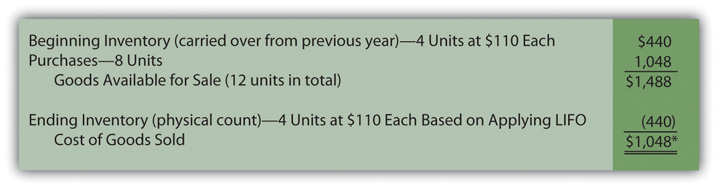
*If the number of units bought during a period equals the number of units sold (as is seen in this example), the quantity of inventory remains unchanged. In a periodic LIFO system, beginning inventory ($440) is then the same as ending inventory ($440) so that cost of goods sold ($1,048) equals the amount spent during the period to purchase inventory ($1,048). For that reason, company officials can easily keep track of gross profit during the year by subtracting purchases from revenues.
If Mayberry Home Improvement Store uses a periodic LIFO system, gross profit for the year will be reported as $902 (revenue of $1,950 less cost of goods sold of $1,048).
Note here that the anticipated characteristics of LIFO are present. Ending inventory of $440 is lower than that reported by FIFO ($558). Cost of goods sold ($1,048) is higher than under FIFO ($930) so that reported gross profit (and, hence, net income) is lower by $118 ($1,020 for FIFO versus $902 for LIFO).
Test Yourself
Question:
The Lowenstein Widget Company starts the year with 24,000 widgets costing $3 each. During the year, the company bought another 320,000 widgets for a total of $1,243,000. Within these figures was the acquisition of 20,000 widgets for $4.10 each on December 26 and 15,000 widgets for $4.00 each on December 18. Those were the last two purchases of the year. On December 31, the company took a physical count and found 21,000 widgets still on hand. If a periodic LIFO cost flow assumption is applied, what amount is reported on the income statement for cost of goods sold?
- $1,249,000
- $1,252,000
- $1,256,000
- $1,264,000
Answer:
The correct answer is choice b: $1,252,000.
Explanation:
Beginning inventory is $72,000 (24,000 units at $3 each) and purchases total $1,243,000. Cost of goods available is the total or $1,315,000. With LIFO, the 21,000 units on hand had the $3 cost of the first items. Total cost for ending inventory is $63,000. Subtracting this balance from goods of available for sale ($1,315,000 less $63,000) gives cost of goods sold of $1,252,000. A LIFO liquidation took place since the inventory declined. That has no impact on the answer but is disclosed.
Perpetual LIFO. The mechanical structure for a perpetual LIFO system is the same as that demonstrated previously for perpetual FIFO except that the most recent costs are moved into cost of goods sold at the time of each sale (points A, B, and C).
Figure 9.9 Perpetual LIFO—Bathtub Model WET-5
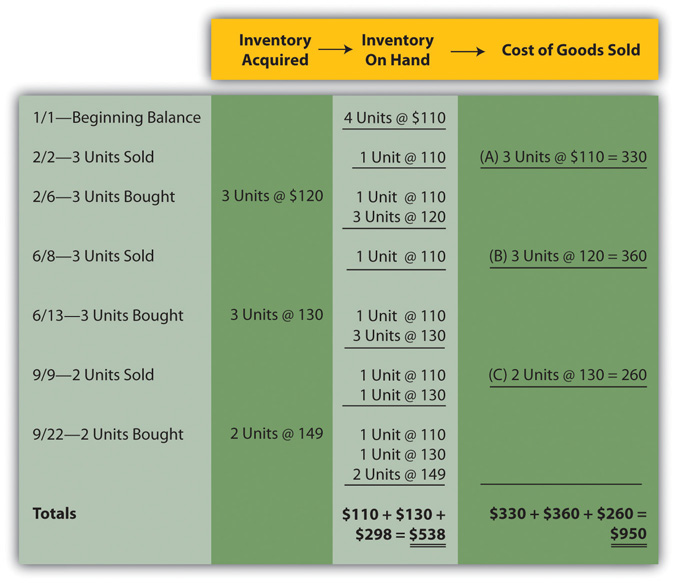
Once again, the last cell at the bottom of the “inventory on hand” column contains the asset figure to be reported on the balance sheet (a total of $538) while the summation of the “cost of goods sold” column provides the amount to be shown on the income statement ($950).
As can be seen here, periodic and perpetual LIFO do not necessarily produce identical numbers.
periodic LIFO: ending inventory $440 and cost of goods sold $1,048 perpetual LIFO: ending inventory $538 and cost of goods sold $950Although periodic and perpetual FIFO always arrive at the same results, balances reported by periodic and perpetual LIFO frequently differ. The first cost incurred in a period (the cost transferred to expense under FIFO) is the same regardless of the date of sale. However, the identity of the last or most recent cost (expensed according to LIFO) depends on the perspective.
To illustrate, note that two bathtubs were sold on September 9 by the Mayberry Home Improvement Store. Perpetual LIFO immediately determines the cost of this sale and reclassifies the amount to expense. On that date, the cost of the most recent two units ($130 each) came from the June 13 purchase. In contrast, a periodic LIFO system makes this same determination but not until December 31. As viewed from year’s end, the last bathtubs had a cost of $149 each. Although these items were bought on September 22, after the final sale, their costs are included in cost of goods sold when applying periodic LIFO.
Two bathtubs were sold on September 9, but the identity of the specific costs to be transferred (when using LIFO) depends on the date on which the determination is made. A periodic system views the costs from the perspective of the end of the year. A perpetual system determines the expense immediately when each sale is made.
Test Yourself
Question:
A company starts the year with 100 units of inventory costing $9 each. Those units are all sold on June 23. Another 100 are bought on July 6 for $11 each. On November 18, 70 of these units are sold. On December 16, fifty units are bought for $15 each bringing the total to eighty (100 – 100 + 100 – 70 + 50). If a perpetual LIFO system is used, what is the cost of these eighty units in ending inventory?
- $720
- $960
- $1,080
- $1,200
Answer:
The correct answer is choice c: $1,080.
Explanation:
In a perpetual LIFO system, the entire opening cost is transferred to cost of goods sold on June 23. On November 18, the cost of seventy units bought on July 6 is also transferred. That leaves thirty units at $11 each ($330) plus the December 16 purchase of fifty units at $15 each or $750. Ending inventory then has a total of $1,080 ($330 plus $750). The reclassification takes place each time at the point of the sale.
In practice, many companies are unlikely to use perpetual LIFO inventory systems. They are costly to maintain and, as has been discussed previously, provide figures of dubious usefulness. For that reason, companies often choose to maintain a perpetual FIFO system for internal decision making and then use the periodic LIFO formula at the end of the year to convert the numbers for external reporting purposes.
For example, The Kroger Co. presented the following balances on its January 29, 2011, balance sheet:
- FIFO inventory: $5,793 million
- LIFO reserve: (827) million
Kroger apparently monitors its inventory on a daily basis using FIFO and arrived at a final cost of $5,793 million. However, at the end of that year, the company took a physical inventory and applied the LIFO cost flow assumption to arrive at a reported balance that was $827 million lower. The reduced figure was used for reporting purposes because of the LIFO conformity rule. However, investors and creditors could still see that ending inventory actually had a current cost of $5,793 million.
Applying Averaging as a Cost Flow Assumption
Question: Not surprisingly, averaging follows a path similar to that of the previous examples. Costs are either moved to cost of goods sold at the end of the year (periodic or weighted average) or at the time of each new sale (perpetual or moving average). The only added variable to this process is the calculation of average cost. In the operation of an averaging system, when and how is the average cost of inventory determined?
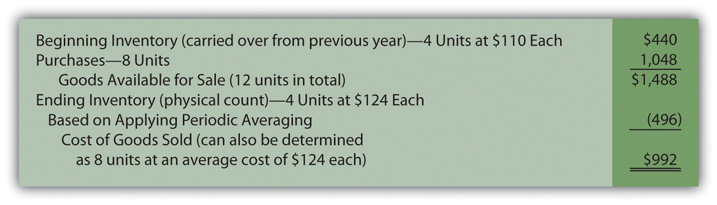
Answer: Periodic (weighted) average. In the problem being examined here, Mayberry Home Improvement Store eventually held twelve bathtubs. Four of these units were on hand at the start of the year and the other eight were acquired during the period. The beginning inventory cost $440 and the new purchases were bought for a total of $1,048.
These twelve units had a total cost of $1,488 ($440 + $1,048) or $124 per bathtub ($1,488/12 units). When applying a weighted average system, this single average for the entire period is the basis for both the ending inventory and cost of goods sold to be reported in the financial statements. No item actually cost $124 but that average is applied to all units.
Figure 9.10 Periodic (Weighted) Average—Bathtub Model WET-5
Perpetual (moving) average. In this final approach to maintaining and reporting inventory, each time that a company buys inventory at a new price, the average cost is recalculated. Therefore, a moving average system must be programmed to update the average whenever additional merchandise is acquired.
In Figure 9.11 "Perpetual (Moving) Average—Bathtub Model WET-5", a new average is computed at points D, E, and F. This figure is found by dividing the number of units on hand after the new purchase into the total cost of those items. For example, at point D, the company now has four bathtubs. One cost $110 while the other three were newly acquired for $120 each or $360 in total. Total cost was $470 ($110 + $360) for these four units for an updated average of $117.50 ($470/4 units). That average is used until the next purchase is made on June 13. The applicable average at the time of sale is transferred from inventory to cost of goods sold at points A ($110.00), B ($117.50), and C ($126.88).
Figure 9.11 Perpetual (Moving) Average—Bathtub Model WET-5
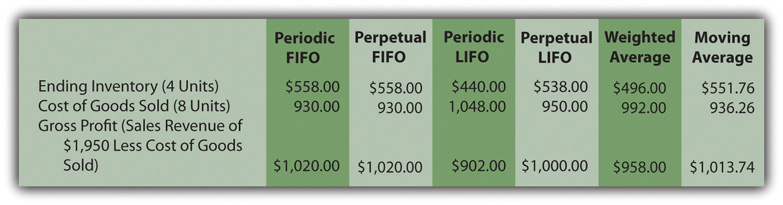
Summary. The six inventory systems shown here for Mayberry Home Improvement Store provide a number of distinct pictures of ending inventory and cost of goods sold. As stated earlier, these numbers are all fairly presented but only in conformity with the specified principles being applied. Interestingly, gross profit ranges from $902.00 to $1,020.00 based on the system applied by management.
Figure 9.12 Reported Balances for Six Inventory Systems
Test Yourself
Question:
A company begins the new year with twenty-five units of inventory costing $12 each. In February, fifteen of these units are sold. At the beginning of May, fifty new units are acquired at $15 each. Finally, in August, forty more units are sold. On December 31, a physical inventory count is taken and twenty units are still on hand. Thus, no units were lost or stolen (25 units – 15 sold + 50 bought – 40 sold = 20 units remaining). If a weighted average system is used, what is the cost to be reported for those twenty units of inventory?
- $250
- $260
- $270
- $280
Answer:
The correct answer is choice d: $280.
Explanation:
In a weighted (or periodic) averaging system, the average for the year is not determined until financial statements are to be produced. Beginning inventory was $300 (twenty-five units for $12 each) and purchases were $750 (fifty units for $15 each) for a total of seventy-five units costing $1,050 ($300 + $750). That gives an average of $14 per unit ($1,050 cost/75 units). With this assumption, the cost assigned to the ending inventory of 20 units is $280 (20 units at $14 each).
Test Yourself
Question:
A company begins the new year with twenty-five units of inventory costing $12 each. In February, fifteen of these units are sold. At the beginning of May, fifty new units are acquired at $15 each. Finally, in August, forty more units are sold. On December 31, a physical inventory count is taken and twenty units are still on hand. Thus, no units were lost or stolen (25 units – 15 sold + 50 bought – 40 sold = 20 units remaining). If a moving average system is used, what is the cost to be reported for those twenty units?
- $260
- $270
- $280
- $290
Answer:
The correct answer is choice d: $290.
Explanation:
In a moving average system, a new average is determined at the time of each purchase. The company starts with twenty-five units and sells fifteen. That leaves ten with a unit cost of $12 or $120 in total. Then, fifty are bought (bringing the total to sixty) with a cost of $15 each or $750 (bringing total cost up to $120 + $750 or $870). The average has now “moved” to $14.50 ($870 cost for sixty units). Eventually, twenty units remain. The ending inventory is $290 (twenty units at $14.50 each).
Key Takeaway
A periodic LIFO inventory system begins by computing the cost of ending inventory at the end of each year and then uses that figure to calculate cost of goods sold. Perpetual LIFO also transfers the most recent cost from inventory to cost of goods sold but makes that reclassification at the time of the sale. Companies frequently maintain inventory records on a FIFO basis for internal decision making and then use a periodic LIFO calculation to convert for year-end reporting. A weighted average inventory system determines a single average for the entire period and applies that to both ending inventory and cost of goods sold. A moving average system computes a new average cost each time that additional merchandise is acquired. This average is used to reclassify costs from inventory to cost of goods sold at the time of sale until the next purchase is made (and a new average is computed).
9.6 Analyzing Reported Inventory Figures
Learning Objectives
At the end of this section, students should be able to meet the following objectives:
- Use information found in the financial statement disclosure notes to convert LIFO income statement numbers into their FIFO or current cost equivalents.
- Compute a company’s gross profit percentage and explain the relevance of this figure.
- Calculate the average number of days that inventory is held and provide reasons why companies worry if this figure starts to rise unexpectedly.
- Determine the inventory turnover and explain its meaning.
Making Comparisons When LIFO Is Applied
Question: The point has been made several times in this chapter that LIFO provides a lower reported net income than does FIFO when prices are rising. In addition, the inventory figure shown on the balance sheet will be below current cost if LIFO is applied during inflation. Comparison between companies that are similar can become difficult, if not impossible, when one uses LIFO and the other FIFO.
For example, Rite Aid, the drug store giant, applies LIFO while its rival CVS Caremark applies FIFO to the inventory held in its pharmacies. How can an investor or creditor possibly evaluate these two companies to assess which has the brightest financial future? In this situation, the utility of the available information seems limited. How do experienced decision makers manage to compare companies that apply LIFO to other companies that do not?
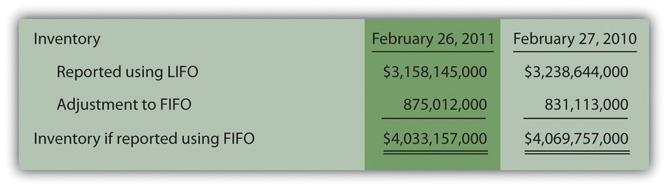
Answer: Significant variations in reported balances frequently result from the application of different cost flow assumptions. Because of the potential detrimental effects, companies that use LIFO often provide additional information to help interested parties understand the impact of this choice. For example, in discussing the use of LIFO, a note to the financial statements for Rite Aid explains (numbers are in thousands): “At February 26, 2011 and February 27, 2010, inventories were $875,012 and $831,113, respectively, lower than the amounts that would have been reported using the first-in, first-out (‘‘FIFO’’) method.”
Here, the reader is informed that the company’s reported inventory balance would be nearly $900 million higher if FIFO was applied. That one sentence allows for a better comparison with a company like CVS Caremark that uses FIFO. The dampening impact of LIFO on reported assets can be removed by the reader as shown in Figure 9.13 "Adjusted Rite Aid’s Inventory Balances from LIFO to FIFO". Restatement of financial statements in this manner is a common technique relied on by investment analysts around the world to make available information more usable.
Figure 9.13 Adjusted Rite Aid’s Inventory Balances from LIFO to FIFO
Adjusting Rite Aid’s inventory balance from LIFO to FIFO is not difficult because the relevant information is available. However, restating the company’s income statement to numbers in line with FIFO is a bit more challenging. Rite Aid reported an overall net loss for the year ended February 26, 2011, of $555,424,000. How would this number have been different with the application of FIFO?
As seen in the periodic inventory formula, beginning inventory is added to purchases in determining cost of goods sold while ending inventory is subtracted. With the LIFO figures reported by Rite Aid, $3,238,644,000 (beginning inventory) was added in arriving at this expense and then $3,158,145,000 (ending inventory) was subtracted. Together, the net effect is an addition of $80,499,000 in computing cost of goods sold for the year ended February 26, 2011. The resulting expense was $80,499,000 higher than the amount of inventory purchased.
If FIFO had been used by Rite Aid, $4,069,757,000 (beginning inventory) would have been added with $4,033,157,000 (ending inventory) subtracted. These two balances produce a net effect on cost of goods sold of adding $36,600,000.
LIFO: cost of goods sold = purchases + $80.499 million FIFO: cost of goods sold = purchases + $36.600 millionUnder LIFO, cost of goods sold is the purchases for the period plus $80,499,000. Using FIFO, cost of goods sold is the purchases plus only $36,600,000. The purchase figure is the same in both equations. Thus, cost of goods sold will be $43,899,000 lower according to FIFO ($80,499,000 less $36,600,000) so that net income is $43,899,000 higher. If FIFO had been used, Rite Aid’s net loss for the period would have been $511,525,000 instead of $555,424,000. Knowledgeable decision makers can easily make this adjustment to help in evaluating a company. They can determine the amount of net income to be reported if FIFO had been selected and can use that figure for comparison purposes.
Test Yourself
Question:
Two companies in the same industry each report sales of $1 million. Company F reports a gross profit of $400,000 while Company L reports a gross profit of only $300,000. A potential investor is looking at both companies and believes Company F is better because of the higher gross profit. However, according to the footnotes, Company F applied FIFO and Company L applied LIFO so that the two gross profit figures are not directly comparable. Company L reported inventory of $200,000 on January 1 and $208,000 at December 31. However, if FIFO had been used, those figures would have $450,000 (January 1) and $553,000 (December 31). Which of the following statements is true?
- Under FIFO, Company L would still have a lower gross profit than Company F by $5,000.
- Under FIFO, Company L would have a higher gross profit than Company F by $5,000.
- Under FIFO, Company L would still have a lower gross profit than Company F by $3,000.
- Under FIFO, Company L would have a higher gross profit than Company F by $3,000.
Answer:
The correct answer is choice a: Under FIFO, Company L would still have a lower gross profit than Company F by $5,000.
Explanation:
In computing cost of goods sold under LIFO, $200,000 (beginning inventory) is added and $208,000 (ending inventory) is subtracted for a net decrease of $8,000. Had FIFO been used, $450,000 (beginning inventory) is added and $553,000 (ending inventory) is subtracted for a net decrease of $103,000. In using FIFO, computation of this expense has a $95,000 ($103,000 less $8,000) larger decrease. Thus, cost of goods sold for Company L is smaller by $95,000. If that change is applied, gross profit reported by Company L goes up from $300,000 to $395,000. That adjusted figure is still $5,000 lower than the number reported by Company F.
Analyzing Vital Signs for Inventory
Question: When examining receivables in a previous chapter, the assertion was made that companies have vital signs that can be studied as an indication of financial well-being. These are ratios or other computed amounts considered to be of particular significance. In that coverage, the age of receivables and the receivable turnover were both calculated and explained. For inventory, do similar vital signs exist that decision makers should consider? What vital signs should be determined in connection with inventory when analyzing the financial health and future prospects of a company?
Answer: No definitive list of ratios and relevant amounts can be identified because different people tend to have their own personal preferences. However, several figures are widely computed and discussed in connection with inventory and cost of goods sold when the financial condition of a company and the likelihood of its prosperity are being evaluated.
Gross profit percentage. The first of these vital signs is the gross profit percentageFormula measuring profitability calculated by dividing gross profit (sales less cost of goods sold) by sales., which is found by dividing the gross profitDifference between sales and cost of goods sold; also called gross margin or markup. for the period by net salesSales less sales returns and discounts..
sales – sales returns and discounts = net sales net sales – cost of goods sold = gross profit gross profit/net sales = gross profit percentageAs has been mentioned, gross profit is also commonly referred to as gross margin or markup. In simplest terms, it is the difference between the amount paid to buy (or manufacture) inventory and the amount received from an eventual sale. The gross profit percentage is often used to compare one company to another or one time period to the next. If one book store manages to earn a gross profit percentage of 35 percent and another only 25 percent, questions should be raised about this difference and which percentage is better? One company is making more profit on each sale but, possibly because of higher sales prices, it might be making significantly fewer sales.
For the year ended January 29, 2011, Macy’s Inc. reported a gross profit percentage of 40.7 percent and reported net income for the year of $847 million on sales of approximately $25 billion. At the same time, Walmart earned a gross profit percentage of only 24.7 percent but managed to generate net income of nearly $17 billion on sales of just under $419 billion. With these companies, a clear difference in pricing strategy can be seen.
The gross profit percentage is also watched closely from one year to the next. For example, if this figure falls from 37 percent to 34 percent, analysts will be quite interested in the reason. A mere 1 percent drop in the gross profit percentage for Walmart in the previous year would have reduced gross profit by over $4 billion ($419 billion × 1 percent).
Such changes have a cause and any individual studying the company needs to consider the possibilities.
- Are costs rising more quickly than the sales price of the merchandise?
- Has a change occurred in the types of inventory being sold?
- Was the reduction in the gross profit offset by an increase in sales?
Amazon.com Inc., for example, reports that its gross profit was 22.6 percent in 2009 and 22.3 percent in 2010. That is certainly one piece of information to be included in a detailed investigation of this company.
Number of days inventory is held. A second vital sign is the number of days inventory is heldMeasures the average number of days that a company takes to sell its inventory items; computed by dividing average inventory for the period by the cost of inventory sold per day. on average. Companies want to turn their merchandise into cash as quickly as possible. Holding inventory for a length of time can lead to several unfortunate repercussions. The longer it sits in stock the more likely the goods are to get damaged, stolen, or go out of fashion. Such losses can be avoided through quick sales. Furthermore, as long as merchandise is sitting on the shelves, it is not earning any profit. Money is tied up with no return until a sale takes place.
Consequently, decision makers (both internal and external to the company) watch this figure closely. A change (especially any lengthening of the time required to sell merchandise) is often a warning of problems.
The number of days inventory is held is found in two steps. First, the cost of inventory that is sold each day on the average is determined.Some analysts prefer to use 360 instead of 365 days to make this computation simpler.
cost of goods sold/365 days = cost of inventory sold per daySecond, this daily cost figure is divided into the average amount of inventory held during the period. The average amount of inventory can be based on beginning and ending totals, monthly balances, or other available figures.
average inventory/cost of inventory sold per day = number of days inventory is heldIf a company sells inventory costing $40,000 each day and holds an average inventory during the period of $520,000, the average item takes thirteen days ($520,000/$40,000) to be sold. Again, the significance of that figure depends on the type of inventory, a comparison to results reported by similar companies, and any change seen in recent periods of time.
Inventory turnover. A third vital sign that is often analyzed is the inventory turnoverRatio used to measure the speed at which a company sells inventory; computed by dividing cost of goods sold by average inventory for the period., which is simply another way to measure the speed by which a company sells inventory.
cost of goods sold/average inventory = inventory turnoverThe resulting turnover figure indicates the number of times during the period that an amount equal to the average inventory was sold. The larger the turnover number, the faster inventory is selling. For example, Best Buy Co. Inc. recognized cost of goods sold for the year ending February 26, 2011, of $37,611 million. The company also reported beginning inventory for that period of $5,486 million and ending inventory of $5,897 million. Hence, the inventory turnover for this retail electronics giant was 6.61 times during that year.
($5,486 + $5,897)/2 = average inventory of $5,691.5 million $37,611/$5,691.5 = inventory turnover of 6.61 timesTest Yourself
Question:
The Hayweather Company starts the year with inventory costing $130,000 and ends the year with inventory costing $150,000. During the period, purchases amounted to $695,250. What was the average number of days required to sell an item of the company’s inventory?
- 68.9 days
- 72.4 days
- 75.7 days
- 80.8 days
Answer:
The correct answer is choice c: 75.7 days.
Explanation:
Cost of goods sold for Hayweather was $675,250 ($130,000 beginning inventory plus $695,250 in purchases less $150,000 ending inventory). That means the company sells inventory costing $1,850 ($675,250/365 days) on the average each day. Average inventory for the period is $140,000 ([$130,000 + $150,000]/2). The average age of the inventory is 75.7 days ($140,000/$1,850).
Test Yourself
Question:
The Ostrich Company starts the year with inventory costing $150,000 and ends the year with inventory costing $130,000. During the period, purchases amounted to $1,030,000. What was the inventory turnover for this period?
- 6.8 times
- 7.1 times
- 7.5 times
- 7.9 times
Answer:
The correct answer is choice c: 7.5 times.
Explanation:
Inventory turnover is cost of goods sold divided by the average inventory (which is $140,000 here). Cost of goods sold for Ostrich was $1,050,000 ($150,000 beginning inventory plus $1,030,000 in purchases less $130,000 ending inventory). Therefore, inventory turnover for the period is 7.5 times ($1,050,000/$140,000).
Key Takeaway
Companies that apply LIFO (probably for income tax reasons) often hope decision makers will convert their reported numbers to FIFO for comparison purposes. Disclosure of FIFO figures can be included in the notes to the financial statements to make this conversion possible. In addition, analysts frequently determine several amounts and ratios to help illuminate trends and events happening inside a company. The gross profit percentage reflects the average markup on each sale. It demonstrates pricing policies and fluctuations often indicate policy changes or shifts in the market. The average number of days in inventory and the inventory turnover both help decision makers learn the length of time a company takes to sell its merchandise. Traditionally, a slowing down of sales is bad because inventory is more likely to become damaged, lost, or stolen. Plus, inventory generates no profit until sold.
Talking with a Real Investing Pro (Continued)
Following is a continuation of our interview with Kevin G. Burns.
Question: Companies that sell inventory instead of services must select a cost flow assumption for reporting purposes. Many companies use FIFO but a number of other companies use LIFO. What are your thoughts when you are analyzing two similar companies and discover that one has applied FIFO while the other LIFO?
Kevin Burns: Truthfully, it is easy to get distracted by issues such as FIFO and LIFO that probably make no difference in the long run. I rarely like to trade stocks quickly. For example, assume a company sells a commodity of some type (jewelry, for example). The commodity fluctuates dramatically in price so that when the price is falling you have paid more for the item than the market will now pay you for the finished good. When prices are rising, you reap the benefit by selling at an even greater price than you expected. So if you have two companies dealing with the same issues and one uses LIFO and the other FIFO, the reported results could be dramatically different. However, the underlying facts do not change. Over an extended period of time, the two companies probably end up in the same position regardless of whether they apply LIFO or FIFO. I am much more interested in how they are investing their cash inflows and the quality of the management. On the other hand, a person who trades stocks quickly could well be interested in reported results that might impact stock prices for a short period of time. For example, the trader may well wish to see a company use FIFO as reported profits will be higher for the short term if there is inflation and may believe that he can capitalize on that short-term phenomenon.
Video Clip
(click to see video)Professor Joe Hoyle talks about the five most important points in Chapter 9 "Why Does a Company Need a Cost Flow Assumption in Reporting Inventory?".
9.7 End-of-Chapter Exercises
Questions
- In the financial accounting for inventory, what is a cost flow assumption?
- In calculating cost of goods sold for a company, under what condition is a cost flow assumption not needed?
- A hardware store buys a refrigerator for $700. Later, the same store buys another refrigerator for $730 and then a final item for $790. Eventually, one of these refrigerators is sold for $1,200. If specific identification is used, how is cost of goods sold determined?
- A hardware store buys a refrigerator for $700. Later, the same store buys another refrigerator for $730 and then a final item for $790. Eventually, one of these refrigerators is sold for $1,200. If FIFO is used, how is cost of goods sold determined?
- A hardware store buys a refrigerator for $700. Later, the same store buys another refrigerator for $730 and then a final item for $790. Eventually, one of these refrigerators is sold for $1,200. If LIFO is used, how is cost of goods sold determined?
- A hardware store buys a refrigerator for $700. Later, the same store buys another refrigerator for $730 and then a final item for $790. Eventually, one of these refrigerators is sold for $1,200. If averaging is used, how is cost of goods sold determined?
- What characteristics are attributed to FIFO and to LIFO in a period of inflation?
- Tax laws are designed to raise revenues so that a government can afford to operate. What are the other major uses made of income tax laws?
- The Hawkins Company maintains one set of financial records for financial reporting purposes. Separate records are also kept for tax compliance purposes. Why is that necessary?
- What is the LIFO conformity rule? What is the practical impact of the LIFO conformity rule?
- IFRS does not permit the use of LIFO. What are the theoretical problems associated with the application of LIFO?
- A grocery store has been in operation for several decades. One rack contains 100 loaves of bread. Each evening a local bakery restocks this rack so that the store always starts the next day with 100 loaves of bread. If the company uses LIFO, what is reported for this inventory?
- Notes to the financial statements of the KaiKayle Corporation indicate that a LIFO liquidation occurred last year. What does this mean? What is the financial impact of that event?
- The Petrakellon Company reports FIFO inventory of $900,000 but also reports a $300,000 negative figure labeled as a “LIFO reserve.” What information do these balances convey to a decision maker?
- In a periodic inventory system, when is the cost flow assumption applied? In a perpetual inventory system, when is the cost flow assumption applied?
- A company maintains a perpetual FIFO inventory system and determines its cost of goods as $874,400. Why would cost of goods sold be the same if the company had used a periodic FIFO inventory system?
- A company buys two units of inventory for $80 each. It sells one for $200. The company then buys three more units for $90 each. What is cost of goods sold if a periodic LIFO system is in use? What is cost of goods sold if a perpetual LIFO system is in use?
- A company is using averaging to determine cost of goods sold. In a periodic (weighted) averaging system, when is the average cost determined? In a perpetual (moving) averaging system, when is the average cost determined?
- The Pitt Corporation reports cost of goods sold as $300,000 using LIFO. Beginning inventory was $44,000 and ending inventory was $48,000. However, if FIFO had been used, beginning inventory would have been $76,000 and ending inventory would have been $114,000. What would cost of goods sold have been for the Pitt Corporation if FIFO had been used?
- How is the gross profit percentage calculated and what does it tell a user about a company?
- How is the number of days in inventory calculated and why would a decision maker want to know this number? What is the problem if the number begins to increase?
- The Boston Company starts the current year with inventory of $300,000. During the year, purchases of $800,000 are made. A physical count at the end of the year finds that $400,000 is still on hand. What is the inventory turnover for this period?
-
The Ames Company has exactly $60 in cash. The company buys three pieces of inventory which are all exactly the same. Because it is a highly inflationary market, the first one cost $16, the second cost $19, and the third cost $25. Shortly thereafter, one of these three is sold for $40. Answer each of the following questions.
- If FIFO is applied, how many units are now on hand?
- If LIFO is applied, how many units are now on hand?
- If FIFO is applied, how much cash is the company holding?
- If LIFO is applied how much cash is the company holding?
- If FIFO is applied, what appears on the income statement and the balance sheet?
- If LIFO is applied, what appears on the income statement and the balance sheet?
True or False
- ____ Using the LIFO cost flow assumption will always result in a lower net income than using the FIFO cost flow assumption.
- ____ LIFO tends to provide a better matching of expenses with revenues than does FIFO.
- ____ The LIFO conformity rule states that if a company uses LIFO on its financial statements it must also use LIFO on its federal income tax return.
- ____ It is impossible for decision makers to compare a company that uses LIFO with one that uses FIFO.
- ____ A jewelry store or boat dealership would normally be able to use the specific identification method.
- ____ The underlying rationale for FIFO is that the earliest inventory purchased would normally be sold first by a company.
- ____ A company starts Year Two with 3,000 pieces of inventory costing $9 each. In Year Two, 1,000 units are sold and then 2,000 more units are bought for $12 each. Later, another 1,000 units are sold and 2,000 more units are bought for $14 each. On the last day of the year, one final unit is purchased for $16. If a perpetual LIFO system is used, this December 31 transaction has no impact on reported net income.
- ____ A company starts Year Two with 3,000 pieces of inventory costing $9 each. In Year Two, 1,000 units are sold and then 2,000 more units are bought for $12 each. Later, another 1,000 units are sold and 2,000 more units are bought for $14 each. If a FIFO system is in use, the 5,000 units on hand at the end of the year have a reported cost of $58,000.
- ____ A company starts Year Two with 3,000 pieces of inventory costing $9 each. In Year Two, 1,000 units are sold and then 2,000 more units are bought for $12 each. Later, another 1,000 units are sold and 2,000 more units are bought for $14 each. On the last day of the year, one final unit is bought for $16. If a periodic LIFO system is used, this December 31 transaction reduces reported gross profit by $2.
- ____ A decision maker is analyzing a set of financial statements and finds a note about a LIFO liquidation that occurred during a long period of inflation. From this information, the decision maker knows that the company has manipulated its inventory balances to reduce the amount of income taxes to be paid in the current year.
- ____ A company applies a periodic FIFO system and buys and sells inventory all during the year. Early in the year, the company bought some inventory and paid an additional $21,000 in connection with the purchase. The cost was recorded in the inventory account but should have been expensed. Despite this error, reported net income for that year does not require adjustment.
- ____ The gross profit percentage can help decision makers determine how long it takes a company to sell inventory after the purchase date.
- ____ A company starts Year Two with 3,000 pieces of inventory costing $9 each. In Year Two, 1,000 units are sold and then 2,000 more units are bought for $12 each. Later, another 3,000 units are sold and 2,000 more units are bought for $14 each. If a periodic FIFO system is used, the number of days that inventory is held on the average is 285.6.
- ____ A company starts Year Two with 4,000 pieces of inventory costing $8 each. In Year Two, 1,000 units are sold and then 3,000 more units are bought for $10 each. Later, another 5,000 units are sold and 2,000 more units are bought for $14 each. If a periodic LIFO system is used, the number of days that inventory is held on the average is 136.8.
- ____ A company starts Year Two with 10,000 pieces of inventory costing $10 each. During the year, the company buys 40,000 additional pieces of inventory for $15 each. At the end of the year, a physical inventory is taken and 11,000 units are still on hand. If periodic LIFO is used, the inventory turnover for Year Two is 6.44 times.
- ____ A company starts Year Two with 10,000 pieces of inventory costing $10 each. During the year, the company buys 40,000 additional pieces of inventory for $15 each. At the end of the year, a physical inventory is taken and 11,000 units are still on hand. If periodic FIFO is used, the inventory turnover for Year Two is 4.04 times.
Multiple Choice
-
Which of the following provides the best matching of expenses with related revenues?
- Specific Identification
- FIFO
- LIFO
- Averaging
-
Milby Corporation purchased three hats to sell during the year. The first, purchased in February, cost $5. The second, purchased in April, cost $6. The third, purchased in July, cost $8. If Milby sells two hats during the year and uses the FIFO method, what is cost of goods sold for the year?
- $11
- $13
- $14
- $19
-
Which of the following is not a typical reason that a company would choose to use LIFO for financial reporting when prices are rising?
- The company wishes to use LIFO for tax purposes.
- The company wants net income to be as high as possible to impress investors.
- The company would like to match the most current costs with current revenues.
- The company operates in an industry with a high rate of inflation.
-
Traylor Corporation began the year with three items in beginning inventory, each costing $4. During the year Traylor purchased five more items at a cost of $5 each and then two more items at a cost of $6.50 each. Traylor sold eight items for $9 each. If Traylor uses a periodic LIFO system, what would be Traylor’s gross profit for this year?
- $30
- $35
- $42
- $72
-
The Greene Company uses a periodic LIFO system for its inventory and starts off the current year with 10 units costing $8 each. Seven units are sold for $16 each, followed by the purchase of 10 additional units at $10 each. Then, 7 more units are sold for $20 each. Finally, 10 units are bought for $13 each. On December 31 of that year, a customer offers to buy one of the units still in inventory but is only willing to pay $12. If Greene takes that offer, what is the impact of that sale on reported net income?
- Net income will not change.
- Net income will go down by $1.
- Net income will go up by $2.
- Net income will go up by $4.
-
The Bleu Company uses a perpetual LIFO system for its inventory and starts off the current year with 10 units costing $8 each. Seven units are sold for $16 each, followed by the purchase of 10 additional units at $10 each. Then, 7 more units are sold for $20 each. Finally, 10 units are bought for $13 each. On December 31 of that year, a customer offers to buy one of the units still in inventory but is only willing to pay $12. If Bleu takes that offer, what is the impact of that sale on reported net income?
- Net income will not change.
- Net income will go down by $1.
- Net income will go up by $2.
- Net income will go up by $4.
-
The Whyte Company uses a FIFO system for its inventory and starts off the current year with 10 units costing $8 each. Seven units are sold for $16 each, followed by the purchase of 10 additional units at $10 each. Then, 7 more units are sold for $20 each. Finally, 10 units are bought for $13 each. On December 31 of that year, a customer offers to buy one of the units still in inventory but is only willing to pay $12. If Whyte takes that offer, what is the impact of that sale on reported net income?
- Net income will not change.
- Net income will go down by $1.
- Net income will go up by $2.
- Net income will go up by $4.
-
The Osborne Company starts the current year with 30 units of inventory costing $20 each. A few weeks later, 20 of these units are sold for $40 each. Then, 20 units are bought to restock inventory at $24.50 each. Later, 20 more units are sold for $50 each and the company buys 20 new units but again at $24.50 each. Late in the year, 20 final units are sold for $60 each. What is the reported cost of the ending inventory if a moving average (perpetual) system is used?
- $220
- $226
- $230
- $240
-
A decision maker is studying a company that has applied LIFO for over 20 years during a period of inflation. The decision maker is looking at the most recent financial statements and notices a note that indicates that a LIFO liquidation occurred. What information is most likely being conveyed by this note?
- Inventory on the balance sheet is worth more than is reported.
- Inventory on the balance sheet is worth less than is reported.
- The company may be reporting an artificially high net income.
- The company has attempted to reduce its income tax payment by a significant amount this year.
-
Buffalo Inc. buys inventory items for $300 each and sells them for $400 each. During the year, the company bought and sold hundreds of these items. The company uses a perpetual system. One unit was sold near the end of the year. The recording was a debit to cash for $400, a credit to inventory for $300, and a credit to gain on sale of inventory for $100. No other entry or correction was made. Which of the following statements is true about Buffalo’s reported information for the period?
- Gross profit was correct, net income was overstated, and inventory was understated.
- Gross profit was understated, net income was understated, and inventory was correct.
- Gross profit was understated, net income was correct, and inventory was correct.
-
Gross profit was correct, net income was understated, and inventory was overstated.
The following information pertains to multiple-choice questions 11, 12, 13, and 14: A company produces financial statements each year. It is started in Year One and has the following transactions:
- Bought 10 units of inventory for $12 each
- Sold 8 units of inventory
- Bought 10 units of inventory for $13 each
- Sold 8 units of inventory
- Bought 10 units of inventory for $15 each
- Sold 8 units of inventory
- Bought 10 units of inventory for $16 each
-
Based on the previous information, the company holds 16 units at the end of Year Two. What is reported for this inventory if a FIFO system is used?
- $206
- $230
- $240
- $250
-
Based on the previous information, the company holds 16 units at the end of Year Two. What is reported for this inventory if a periodic LIFO system is used?
- $206
- $230
- $240
- $250
-
Based on the previous information, the company holds 16 units at the end of Year Two. What is reported for this inventory if a perpetual LIFO system is used?
- $206
- $230
- $240
- $250
-
Based on the previous information, the company holds 16 units at the end of Year Two. What is reported for this inventory if a weighted average (periodic) system is used?
- $206
- $230
- $240
- $250
-
A company buys and sells inventory and ends each year with approximately 50 units kept in stock at all time. It pays $10 per unit in Year One, $8 per unit in Year Two, and $7 per unit in Year Three. Which of the following statements is true about the Year Three financial statements if LIFO is used rather than FIFO?
- Cost of goods sold will be lower
- Net income will be lower
- Income tax expense will be lower
- Ending inventory will be lower
-
During the year, Hostel Company had net sales of $4,300,000 and cost of goods sold of $2,800,000. Beginning inventory was $230,000 and ending inventory was $390,000. Which of the following would be Hostel’s inventory turnover for the year?
- 4.84 times
- 7.18 times
- 9.03 times
- 13.87 times
-
During the year, the Brighton Corporation had net sales of $4,800,000 and inventory purchases of $3,600,000. Beginning inventory for the year was $280,000 and ending inventory was $320,000. Which of the following would be Brighton’s inventory turnover for the year?
- 10.67 times
- 11.87 times
- 13.33 times
- 14.67 times
-
Ace Company starts the year with 30,000 units costing $8 each. During the year, Ace bought 100,000 more units at $12 each. A count of the ending inventory finds 40,000 units on hand. If the company uses periodic FIFO, what is the inventory turnover for the year?
- 2.67 times
- 3.00 times
- 3.20 times
- 3.67 times
-
During the year, the Trenton Company had net sales of $3,200,000 and cost of goods sold of $2,920,000. Beginning inventory was $250,000 and ending inventory was $390,000. What was the average number of days during the year that Trenton held its inventory items?
- 40 days
- 45 days
- 52 days
- 54 days
-
During the year, the Wyglio Corporation had net sales of $5,100,000 and inventory purchases of $4,340,000. Beginning inventory for the year was $320,000 and ending inventory was $280,000. What was the average number of days during the year that Wyglio held its inventory items?
- 22 days
- 24 days
- 25 days
- 28 days
Video Problems
Professor Joe Hoyle discusses the answers to these two problems at the links that are indicated. After formulating your answers, watch each video to see how Professor Hoyle answers these questions.
-
Your roommate is an English major. The roommate’s parents own a chain of ice cream shops throughout Florida. One day, while walking over to the science building for a general education class, your roommate poses this question: “Dairy prices have been going up over the last couple of years which has caused a steady rise in the price of the ice cream that my parents buy. I was talking with them recently and they were telling me that they use an accounting system called last-in, first-out in recording their inventory. This makes no sense to me. Everyone knows that all stores always sell their oldest ice cream first so it won’t begin to melt and start losing flavor. I don’t understand how they could possibly be using a last-in, first-out system. In this case, the accounting sounds like a work of fiction. What is going on?” How would you respond?
-
Your uncle and two friends started a small office supply store several years ago. The company has expanded and now has several large locations. Your uncle knows that you are taking a financial accounting class and asks you the following question: “When we first got started, our accountant told us to use LIFO for our inventory. We were paying her a lot of money so we followed that advice. One of our biggest customers is owned by a company located in Italy. Recently, the manager for that company was telling me that their accounting is based on IFRS rather than U.S. GAAP and that IFRS apparently believes that LIFO is theoretically flawed. Why are we using a flawed system? I don’t even what impact LIFO has on our financial statements. I know that we started out this year with 100,000 units that cost $5 each and then we bought another 400,000 units for $8.00. At the end of the year, because of our sales during the period, we only had 100,000 units left. What difference did LIFO make?” How would you respond?
Problems
-
SuperDuper Company sells top of the line skateboards. SuperDuper is concerned about maintaining high earnings and has chosen to use the periodic FIFO method of inventory costing. At the beginning of the year, SuperDuper had 5,000 skateboards in inventory, each costing $20. In April, SuperDuper purchased 2,000 skateboards at a cost of $22 and in August, purchased 4,000 more at a cost of $23. During the year, SuperDuper sold 9,000 skateboards for $40 each.
- Record each purchase SuperDuper made.
- Assuming there is no breakage or theft, how many skateboards are on hand at the end of the year?
- Determine SuperDuper’s cost of goods sold using FIFO.
- Assume the same facts as problem 1, except that SuperDuper is more concerned with minimizing taxes and uses periodic LIFO. Determine SuperDuper’s cost of goods sold.
- Assume the same facts as problem 1, except that SuperDuper has decided to use averaging as a compromise between FIFO and LIFO. Determine SuperDuper’s cost of goods sold.
- Ulysses Company uses the LIFO cost flow assumption. This year, the company reported beginning inventory of $20,000,000 and ending inventory of $21,500,000. If FIFO were used to value inventory, beginning inventory would have been $23,000,000 (current cost at that time) and ending inventory would have been $28,700,000 (also current cost). Cost of goods sold using LIFO was $34,900,000. Determine the reported cost of goods sold if Ulysses had used FIFO.
-
A company starts operations on October 1, Year One, holding 400 units of inventory which fills its store. This inventory cost $10 per unit. After that, enough inventory is bought on the last day of each month to bring the quantity on hand back to exactly 400 units. In October, 140 units were sold; in November, 150 units were sold; and in December, 180 units were sold. On October 31, the company bought units for $12 each; on November 30, the company bought units for $13 each; on December 31, the company bought units for $15 each.
- What is the company’s cost of goods sold if a periodic LIFO system is used?
- What is the company’s cost of goods sold if a perpetual LIFO system is used?
-
Paula’s Parkas sells NorthPlace jackets. At the beginning of the year, Paula’s had 20 jackets in stock, each costing $35 and selling for $60. The following table details the purchases and sales made during January:
Figure 9.14
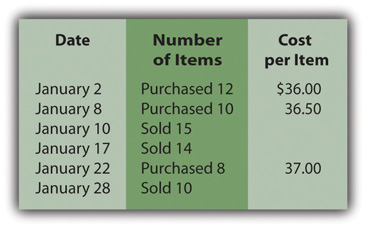
Assume that Paula’s Parkas uses the perpetual FIFO method to maintain its inventory records.
- Determine Paula’s Parkas cost of goods sold and ending inventory for January.
- Determine Parka’s gross profit for January.
-
Assume the same facts as in problem 6 except that Paula’s Parkas uses the perpetual LIFO method.
- Determine Paula’s Parkas cost of goods sold and ending inventory for January.
- Determine Parka’s gross profit for January.
-
Assume the same facts as in problem 6 above except that Paula’s Parkas uses the moving average method.
- Determine Paula’s Parkas cost of goods sold and ending inventory for January.
- Determine Parka’s gross profit for January.
-
In Year One, the Major Corporation had the following inventory transactions:
- March 1: Buy 1,000 units at $7 each.
- May 1: Sell 800 units for $12 each.
- August 1: Buy 1,000 units at $8 each.
- October 1: Sell 700 units for $14 each.
- December 1: Buy 1,000 units for $10 each.
In Year Two, the company had the following inventory transactions:
- April 1: Sell 700 units for $17 each.
- June 1: Buy 1,000 units for $11 each.
- September 1: Sell 900 units for $20 each.
- November 1: Buy 1,000 units for $12 each.
-
December 1: Sell 700 units for $22 each.
- What amount of gross profit should this company recognize in Year One and also in Year Two if a periodic LIFO system is in use?
- What amount of gross profit should this company recognize in Year One and also in Year Two if a perpetual LIFO system is in use?
-
A company starts the year with 20 units of inventory costing $20 each. In January, 10 of these units are sold for $40 each. Then, 10 new units are bought for $22 each. Shortly thereafter, 10 units are sold for $50 each. Then, 10 units are bought for $27 each. Finally, near the end of the year, 10 units are sold for $60 each.
- What is reported as the cost of ending inventory if a weighted average (periodic) system is in use?
- What is reported as the cost of ending inventory if a moving average (perpetual) system is in use?
-
The Quiqqley Company is started in Year One and buys 400 pieces of inventory for $4 each on June 1. The company sells 300 of these units on September 1 for $20 each. The company buys another 400 units for $7 each on November 1 and finishes Year One with 500 units in stock.
In Year Two, on February 1, the company sells 300 units for $20 each. On July 1, Year Two, the company buys 200 more units for $9 each. On August 1, Year Two, the company sells 100 units for $25 each. Finally, on December 1, Year Two, the company buys another 100 units for $10 each.
- Assume the company uses a perpetual FIFO system. What is the cost of goods sold figure to be reported for Year Two?
- Assume the company uses a perpetual LIFO system. What is the cost of goods sold figure to be reported for Year Two?
- A company applies LIFO and reports net income for Year Four of $328,000. Reported inventory at January 1 was $32,000 and at December 31 was $35,000. A note to the financial statements indicates that the beginning inventory would have been $52,000 and ending inventory would have been $78,000 if FIFO had been used. What would this company have reported as its net income for Year Four if FIFO has been applied as the cost flow assumption?
- The Montana Company and the Florida Company are identical in every way. They have exactly the same transactions. In Year One, they both started with 10,000 units of inventory costing $6 per unit. During Year One, they both bought 20,000 additional units for $8 per unit and sold 20,000 units. During Year Two, they both bought 30,000 units for $9 per unit and sold 30,000 units. The Montana Company uses a periodic FIFO system and the Florida Company uses a periodic LIFO system. If the Montana Company reports net income in Year Two of $100,000, what will the Florida Company report as its net income?
-
The Furn Store sells home furnishings, including bean bag chairs. Furn currently uses the periodic FIFO method of inventory costing, but is considering implementing a perpetual system. It will cost a good deal of money to start and maintain, so Furn would like to see the difference, if any, between the two and is using its bean bag chair inventory to do so. Here is the first quarter information for bean bag chairs:
Figure 9.15
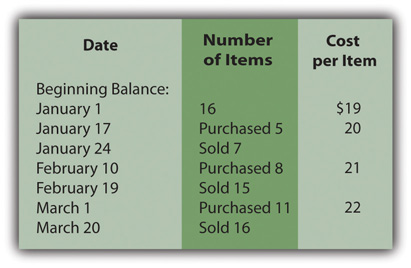
Each bean bag chair sells for $40.
- Determine Furn’s cost of goods sold and ending inventory under periodic FIFO.
- Determine Furn’s cost of goods sold and ending inventory under perpetual FIFO.
-
Rollrbladz Inc. is trying to decide between a periodic or perpetual LIFO system. Management would like to see the effect of each on cost of goods sold and ending inventory for the year. The following is information concerning purchases and sales of its specialty line of rollerblades:
Figure 9.16
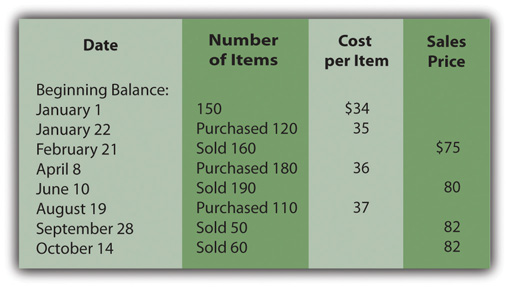
- Determine Rollrbladz’s cost of goods sold and ending inventory under periodic LIFO.
- Determine Rollrbladz’s cost of goods sold and ending inventory under perpetual LIFO.
-
Highlander Corporation sells swords for decorative purposes. It would like to know the difference in cost of goods sold and ending inventory if it uses the weighted average method or the moving average method. Use the following information to help determine these amounts for the second quarter.
Figure 9.17
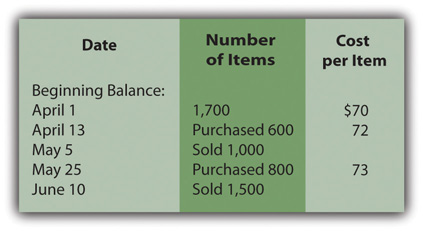
Swords retail for $120 each.
- Determine Highlander’s cost of goods sold and ending inventory under weighted average.
- Determine Highlander’s cost of goods sold and ending inventory under moving average.
- During the year, the California Corporation had net sales of $11,000,000 and inventory purchases of $7,500,000. Beginning inventory for the year was $1,030,000 but ending inventory was only $500,000 because the company wanted to reduce the amount of money tied up in inventory. What was the average number of days during the year that California held its inventory items before making a sale?
- Deuce Company starts the year with 80,000 units costing $10 each. During the year, Deuce bought 100,000 more units at $12 each and then another 120,000 at $13 each. A count of the ending inventory finds 70,000 units on hand. If the company uses periodic FIFO, what is the inventory turnover for the year?
- During the current year, the Decker Company had net sales of $15,700,000 and cost of goods sold of $9,200,000. Beginning inventory was $420,000 and ending inventory was $500,000. What was the inventory turnover for that year?
-
In Chapter 4 "How Does an Organization Accumulate and Organize the Information Necessary to Create Financial Statements?", Heather Miller started her own business, Sew Cool. The financial statements for December were presented in Chapter 7 "In Financial Reporting, What Information Is Conveyed about Receivables?" and are shown again below. For convenience, assume the business was started on January 1, 20X8 with no assets.
Figure 9.18
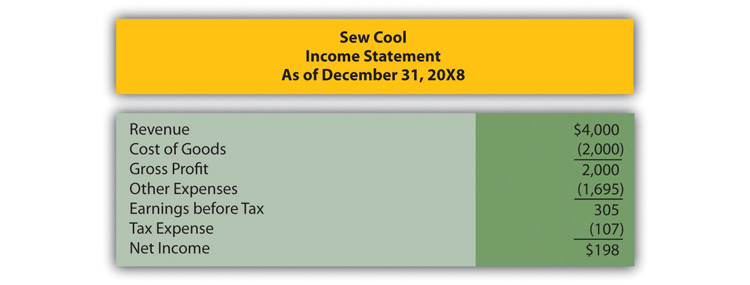
Figure 9.19
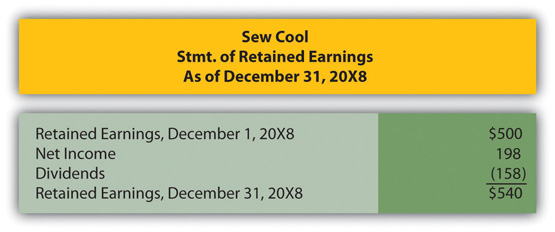
Figure 9.20
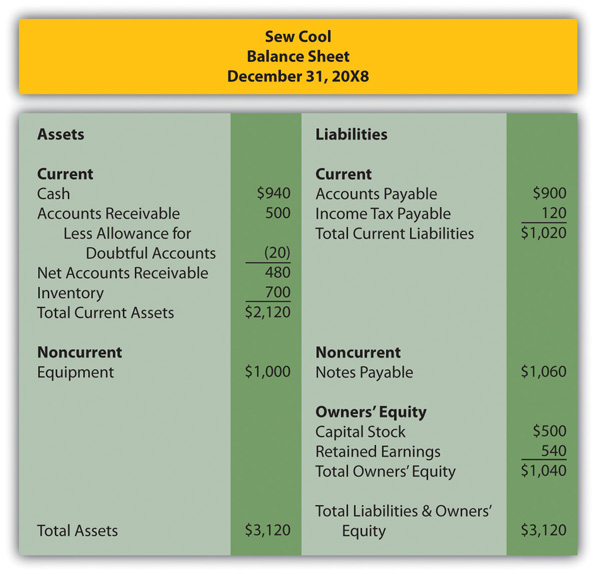
Based on the financial statements determine the following:
- Gross profit percentage
- Number of days inventory is held
- Inventory turnover
Comprehensive Problem
This problem will carry through over several chapters to enable students to build their accounting skills using knowledge gained in previous chapters.
In Chapter 8 "How Does a Company Gather Information about Its Inventory?", financial statements were prepared for Webworks for August 31 and the month then ended. Those financial statements are included here as a starting point for the financial reporting for September.
Figure 9.21
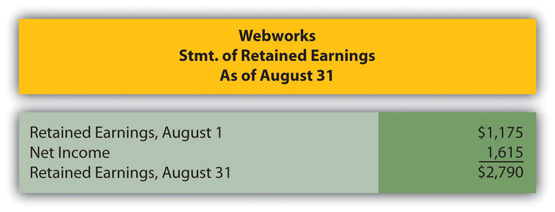
Figure 9.22
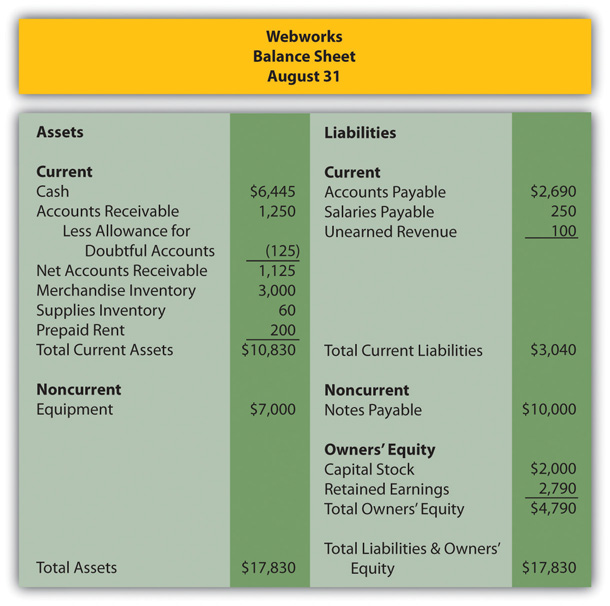
The following events occur during September:
- Webworks purchases supplies worth $120 on account.
- At the beginning of September, Webworks held 19 keyboards costing $100 each and 110 flash drives costing $10 each. Webworks has decided to use periodic FIFO to cost its inventory.
- Webworks purchases 30 additional keyboards on account for $105 each and 50 flash drives for $11 each.
- Webworks starts and completes five more Web sites and bills clients for $3,000.
- Webworks pays Nancy Po (the company employee hired in June) $500 for her work during the first three weeks of September.
- Webworks sells 40 keyboards for $6,000 and 120 flash drives for $2,400 cash.
- Webworks collects $2,500 in accounts receivable.
- Webworks pays off its salaries payable from August.
- Webworks pays off $5,500 of its accounts payable.
- Webworks pays off $5,000 of its outstanding note payable.
- Webworks pays Leon Jackson (owner of the company) salary of $2,000.
-
Webworks pays taxes of $795 in cash.
Required:
- Prepare journal entries for the previous events.
- Post the journal entries to T-accounts.
- Prepare an unadjusted trial balance for Webworks for September.
- Prepare adjusting entries for the following and post them to your T-accounts.
- Webworks owes Nancy Po $300 for her work during the last week of September.
- Leon’s parents let him know that Webworks owes $275 toward the electricity bill. Webworks will pay them in October.
- Webworks determines that it has $70 worth of supplies remaining at the end of September.
- Prepaid rent should be adjusted for September’s portion.
- Webworks is continuing to accrue bad debts so that the allowance for doubtful accounts is 10 percent of accounts receivable.
-
Record cost of goods sold.
- Prepare an adjusted trial balance.
- Prepare financial statements for September.
Research Assignment
Assume that you take a job as a summer employee for an investment advisory service. One of the partners for that firm is currently looking at the possibility of investing in Deere & Company. The partner is interested in the impact of the recession on a company that is so closely tied to the agriculture industry. The partner is especially interested in the speed with which the company is able to sell its inventory and also the impact of recording most inventory using LIFO. The partner asks you to look at the 2010 financial statements for Deere & Company by following this path:
- Go to http://www.deere.com.
- At the upper right side of the screen, click on “Our Company” and then on “Investor Relations.” (If you’re using a browser other than Internet Explorer, you may need to select your country before you can click on “Our Company.”)
- On the left side of the next screen, click on “Annual Report.”
- In the middle of the next screen, click on “2010 Annual Report” to download.
- Go to page 24 and find the 2008, 2009, and 2010 income statements.
- Go to page 25 and find the balance sheets for the years ended October 31, 2009 and 2010.
- Go to page 41 and read note 15 titled “Inventories.”
- Using the figures found on the 2010 income statement and the two balance sheets, determine the number of days that inventory was held by Deere & Company during 2010. Does the number seem particularly high or particularly low?
- Using the figures found on the 2010 income statement and the information provided in note 15 of the financial statements, determine the change in cost of sales that would have occurred if the company had applied FIFO to all of its reported inventory. What was the monetary amount of the difference between this figure and the amount actually reported?