This is “Analyzing Reported Inventory Figures”, section 9.6 from the book Business Accounting (v. 2.0). For details on it (including licensing), click here.
For more information on the source of this book, or why it is available for free, please see the project's home page. You can browse or download additional books there. To download a .zip file containing this book to use offline, simply click here.


9.6 Analyzing Reported Inventory Figures
Learning Objectives
At the end of this section, students should be able to meet the following objectives:
- Use information found in the financial statement disclosure notes to convert LIFO income statement numbers into their FIFO or current cost equivalents.
- Compute a company’s gross profit percentage and explain the relevance of this figure.
- Calculate the average number of days that inventory is held and provide reasons why companies worry if this figure starts to rise unexpectedly.
- Determine the inventory turnover and explain its meaning.
Making Comparisons When LIFO Is Applied
Question: The point has been made several times in this chapter that LIFO provides a lower reported net income than does FIFO when prices are rising. In addition, the inventory figure shown on the balance sheet will be below current cost if LIFO is applied during inflation. Comparison between companies that are similar can become difficult, if not impossible, when one uses LIFO and the other FIFO.
For example, Rite Aid, the drug store giant, applies LIFO while its rival CVS Caremark applies FIFO to the inventory held in its pharmacies. How can an investor or creditor possibly evaluate these two companies to assess which has the brightest financial future? In this situation, the utility of the available information seems limited. How do experienced decision makers manage to compare companies that apply LIFO to other companies that do not?
Answer: Significant variations in reported balances frequently result from the application of different cost flow assumptions. Because of the potential detrimental effects, companies that use LIFO often provide additional information to help interested parties understand the impact of this choice. For example, in discussing the use of LIFO, a note to the financial statements for Rite Aid explains (numbers are in thousands): “At February 26, 2011 and February 27, 2010, inventories were $875,012 and $831,113, respectively, lower than the amounts that would have been reported using the first-in, first-out (‘‘FIFO’’) method.”
Here, the reader is informed that the company’s reported inventory balance would be nearly $900 million higher if FIFO was applied. That one sentence allows for a better comparison with a company like CVS Caremark that uses FIFO. The dampening impact of LIFO on reported assets can be removed by the reader as shown in Figure 9.13 "Adjusted Rite Aid’s Inventory Balances from LIFO to FIFO". Restatement of financial statements in this manner is a common technique relied on by investment analysts around the world to make available information more usable.
Figure 9.13 Adjusted Rite Aid’s Inventory Balances from LIFO to FIFO
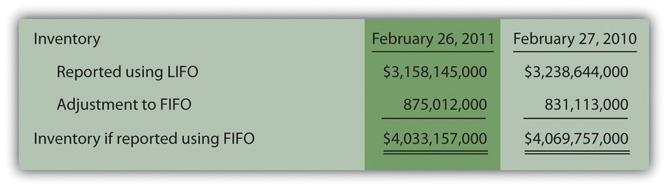
Adjusting Rite Aid’s inventory balance from LIFO to FIFO is not difficult because the relevant information is available. However, restating the company’s income statement to numbers in line with FIFO is a bit more challenging. Rite Aid reported an overall net loss for the year ended February 26, 2011, of $555,424,000. How would this number have been different with the application of FIFO?
As seen in the periodic inventory formula, beginning inventory is added to purchases in determining cost of goods sold while ending inventory is subtracted. With the LIFO figures reported by Rite Aid, $3,238,644,000 (beginning inventory) was added in arriving at this expense and then $3,158,145,000 (ending inventory) was subtracted. Together, the net effect is an addition of $80,499,000 in computing cost of goods sold for the year ended February 26, 2011. The resulting expense was $80,499,000 higher than the amount of inventory purchased.
If FIFO had been used by Rite Aid, $4,069,757,000 (beginning inventory) would have been added with $4,033,157,000 (ending inventory) subtracted. These two balances produce a net effect on cost of goods sold of adding $36,600,000.
LIFO: cost of goods sold = purchases + $80.499 million FIFO: cost of goods sold = purchases + $36.600 millionUnder LIFO, cost of goods sold is the purchases for the period plus $80,499,000. Using FIFO, cost of goods sold is the purchases plus only $36,600,000. The purchase figure is the same in both equations. Thus, cost of goods sold will be $43,899,000 lower according to FIFO ($80,499,000 less $36,600,000) so that net income is $43,899,000 higher. If FIFO had been used, Rite Aid’s net loss for the period would have been $511,525,000 instead of $555,424,000. Knowledgeable decision makers can easily make this adjustment to help in evaluating a company. They can determine the amount of net income to be reported if FIFO had been selected and can use that figure for comparison purposes.
Test Yourself
Question:
Two companies in the same industry each report sales of $1 million. Company F reports a gross profit of $400,000 while Company L reports a gross profit of only $300,000. A potential investor is looking at both companies and believes Company F is better because of the higher gross profit. However, according to the footnotes, Company F applied FIFO and Company L applied LIFO so that the two gross profit figures are not directly comparable. Company L reported inventory of $200,000 on January 1 and $208,000 at December 31. However, if FIFO had been used, those figures would have $450,000 (January 1) and $553,000 (December 31). Which of the following statements is true?
- Under FIFO, Company L would still have a lower gross profit than Company F by $5,000.
- Under FIFO, Company L would have a higher gross profit than Company F by $5,000.
- Under FIFO, Company L would still have a lower gross profit than Company F by $3,000.
- Under FIFO, Company L would have a higher gross profit than Company F by $3,000.
Answer:
The correct answer is choice a: Under FIFO, Company L would still have a lower gross profit than Company F by $5,000.
Explanation:
In computing cost of goods sold under LIFO, $200,000 (beginning inventory) is added and $208,000 (ending inventory) is subtracted for a net decrease of $8,000. Had FIFO been used, $450,000 (beginning inventory) is added and $553,000 (ending inventory) is subtracted for a net decrease of $103,000. In using FIFO, computation of this expense has a $95,000 ($103,000 less $8,000) larger decrease. Thus, cost of goods sold for Company L is smaller by $95,000. If that change is applied, gross profit reported by Company L goes up from $300,000 to $395,000. That adjusted figure is still $5,000 lower than the number reported by Company F.
Analyzing Vital Signs for Inventory
Question: When examining receivables in a previous chapter, the assertion was made that companies have vital signs that can be studied as an indication of financial well-being. These are ratios or other computed amounts considered to be of particular significance. In that coverage, the age of receivables and the receivable turnover were both calculated and explained. For inventory, do similar vital signs exist that decision makers should consider? What vital signs should be determined in connection with inventory when analyzing the financial health and future prospects of a company?
Answer: No definitive list of ratios and relevant amounts can be identified because different people tend to have their own personal preferences. However, several figures are widely computed and discussed in connection with inventory and cost of goods sold when the financial condition of a company and the likelihood of its prosperity are being evaluated.
Gross profit percentage. The first of these vital signs is the gross profit percentageFormula measuring profitability calculated by dividing gross profit (sales less cost of goods sold) by sales., which is found by dividing the gross profitDifference between sales and cost of goods sold; also called gross margin or markup. for the period by net salesSales less sales returns and discounts..
sales – sales returns and discounts = net sales net sales – cost of goods sold = gross profit gross profit/net sales = gross profit percentageAs has been mentioned, gross profit is also commonly referred to as gross margin or markup. In simplest terms, it is the difference between the amount paid to buy (or manufacture) inventory and the amount received from an eventual sale. The gross profit percentage is often used to compare one company to another or one time period to the next. If one book store manages to earn a gross profit percentage of 35 percent and another only 25 percent, questions should be raised about this difference and which percentage is better? One company is making more profit on each sale but, possibly because of higher sales prices, it might be making significantly fewer sales.
For the year ended January 29, 2011, Macy’s Inc. reported a gross profit percentage of 40.7 percent and reported net income for the year of $847 million on sales of approximately $25 billion. At the same time, Walmart earned a gross profit percentage of only 24.7 percent but managed to generate net income of nearly $17 billion on sales of just under $419 billion. With these companies, a clear difference in pricing strategy can be seen.
The gross profit percentage is also watched closely from one year to the next. For example, if this figure falls from 37 percent to 34 percent, analysts will be quite interested in the reason. A mere 1 percent drop in the gross profit percentage for Walmart in the previous year would have reduced gross profit by over $4 billion ($419 billion × 1 percent).
Such changes have a cause and any individual studying the company needs to consider the possibilities.
- Are costs rising more quickly than the sales price of the merchandise?
- Has a change occurred in the types of inventory being sold?
- Was the reduction in the gross profit offset by an increase in sales?
Amazon.com Inc., for example, reports that its gross profit was 22.6 percent in 2009 and 22.3 percent in 2010. That is certainly one piece of information to be included in a detailed investigation of this company.
Number of days inventory is held. A second vital sign is the number of days inventory is heldMeasures the average number of days that a company takes to sell its inventory items; computed by dividing average inventory for the period by the cost of inventory sold per day. on average. Companies want to turn their merchandise into cash as quickly as possible. Holding inventory for a length of time can lead to several unfortunate repercussions. The longer it sits in stock the more likely the goods are to get damaged, stolen, or go out of fashion. Such losses can be avoided through quick sales. Furthermore, as long as merchandise is sitting on the shelves, it is not earning any profit. Money is tied up with no return until a sale takes place.
Consequently, decision makers (both internal and external to the company) watch this figure closely. A change (especially any lengthening of the time required to sell merchandise) is often a warning of problems.
The number of days inventory is held is found in two steps. First, the cost of inventory that is sold each day on the average is determined.Some analysts prefer to use 360 instead of 365 days to make this computation simpler.
cost of goods sold/365 days = cost of inventory sold per daySecond, this daily cost figure is divided into the average amount of inventory held during the period. The average amount of inventory can be based on beginning and ending totals, monthly balances, or other available figures.
average inventory/cost of inventory sold per day = number of days inventory is heldIf a company sells inventory costing $40,000 each day and holds an average inventory during the period of $520,000, the average item takes thirteen days ($520,000/$40,000) to be sold. Again, the significance of that figure depends on the type of inventory, a comparison to results reported by similar companies, and any change seen in recent periods of time.
Inventory turnover. A third vital sign that is often analyzed is the inventory turnoverRatio used to measure the speed at which a company sells inventory; computed by dividing cost of goods sold by average inventory for the period., which is simply another way to measure the speed by which a company sells inventory.
cost of goods sold/average inventory = inventory turnoverThe resulting turnover figure indicates the number of times during the period that an amount equal to the average inventory was sold. The larger the turnover number, the faster inventory is selling. For example, Best Buy Co. Inc. recognized cost of goods sold for the year ending February 26, 2011, of $37,611 million. The company also reported beginning inventory for that period of $5,486 million and ending inventory of $5,897 million. Hence, the inventory turnover for this retail electronics giant was 6.61 times during that year.
($5,486 + $5,897)/2 = average inventory of $5,691.5 million $37,611/$5,691.5 = inventory turnover of 6.61 timesTest Yourself
Question:
The Hayweather Company starts the year with inventory costing $130,000 and ends the year with inventory costing $150,000. During the period, purchases amounted to $695,250. What was the average number of days required to sell an item of the company’s inventory?
- 68.9 days
- 72.4 days
- 75.7 days
- 80.8 days
Answer:
The correct answer is choice c: 75.7 days.
Explanation:
Cost of goods sold for Hayweather was $675,250 ($130,000 beginning inventory plus $695,250 in purchases less $150,000 ending inventory). That means the company sells inventory costing $1,850 ($675,250/365 days) on the average each day. Average inventory for the period is $140,000 ([$130,000 + $150,000]/2). The average age of the inventory is 75.7 days ($140,000/$1,850).
Test Yourself
Question:
The Ostrich Company starts the year with inventory costing $150,000 and ends the year with inventory costing $130,000. During the period, purchases amounted to $1,030,000. What was the inventory turnover for this period?
- 6.8 times
- 7.1 times
- 7.5 times
- 7.9 times
Answer:
The correct answer is choice c: 7.5 times.
Explanation:
Inventory turnover is cost of goods sold divided by the average inventory (which is $140,000 here). Cost of goods sold for Ostrich was $1,050,000 ($150,000 beginning inventory plus $1,030,000 in purchases less $130,000 ending inventory). Therefore, inventory turnover for the period is 7.5 times ($1,050,000/$140,000).
Key Takeaway
Companies that apply LIFO (probably for income tax reasons) often hope decision makers will convert their reported numbers to FIFO for comparison purposes. Disclosure of FIFO figures can be included in the notes to the financial statements to make this conversion possible. In addition, analysts frequently determine several amounts and ratios to help illuminate trends and events happening inside a company. The gross profit percentage reflects the average markup on each sale. It demonstrates pricing policies and fluctuations often indicate policy changes or shifts in the market. The average number of days in inventory and the inventory turnover both help decision makers learn the length of time a company takes to sell its merchandise. Traditionally, a slowing down of sales is bad because inventory is more likely to become damaged, lost, or stolen. Plus, inventory generates no profit until sold.
Talking with a Real Investing Pro (Continued)
Following is a continuation of our interview with Kevin G. Burns.
Question: Companies that sell inventory instead of services must select a cost flow assumption for reporting purposes. Many companies use FIFO but a number of other companies use LIFO. What are your thoughts when you are analyzing two similar companies and discover that one has applied FIFO while the other LIFO?
Kevin Burns: Truthfully, it is easy to get distracted by issues such as FIFO and LIFO that probably make no difference in the long run. I rarely like to trade stocks quickly. For example, assume a company sells a commodity of some type (jewelry, for example). The commodity fluctuates dramatically in price so that when the price is falling you have paid more for the item than the market will now pay you for the finished good. When prices are rising, you reap the benefit by selling at an even greater price than you expected. So if you have two companies dealing with the same issues and one uses LIFO and the other FIFO, the reported results could be dramatically different. However, the underlying facts do not change. Over an extended period of time, the two companies probably end up in the same position regardless of whether they apply LIFO or FIFO. I am much more interested in how they are investing their cash inflows and the quality of the management. On the other hand, a person who trades stocks quickly could well be interested in reported results that might impact stock prices for a short period of time. For example, the trader may well wish to see a company use FIFO as reported profits will be higher for the short term if there is inflation and may believe that he can capitalize on that short-term phenomenon.
Video Clip
(click to see video)Professor Joe Hoyle talks about the five most important points in Chapter 9 "Why Does a Company Need a Cost Flow Assumption in Reporting Inventory?".