This is “Basic Definitions and Concepts”, section 1.1 from the book Beginning Statistics (v. 1.0). For details on it (including licensing), click here.
For more information on the source of this book, or why it is available for free, please see the project's home page. You can browse or download additional books there. To download a .zip file containing this book to use offline, simply click here.


1.1 Basic Definitions and Concepts
Learning Objective
- To learn the basic definitions used in statistics and some of its key concepts.
We begin with a simple example. There are millions of passenger automobiles in the United States. What is their average value? It is obviously impractical to attempt to solve this problem directly by assessing the value of every single car in the country, adding up all those numbers, and then dividing by however many numbers there are. Instead, the best we can do would be to estimate the average. One natural way to do so would be to randomly select some of the cars, say 200 of them, ascertain the value of each of those cars, and find the average of those 200 numbers. The set of all those millions of vehicles is called the population of interest, and the number attached to each one, its value, is a measurement. The average value is a parameter: a number that describes a characteristic of the population, in this case monetary worth. The set of 200 cars selected from the population is called a sample, and the 200 numbers, the monetary values of the cars we selected, are the sample data. The average of the data is called a statistic: a number calculated from the sample data. This example illustrates the meaning of the following definitions.
Definition
A populationAll objects of interest. is any specific collection of objects of interest. A sampleThe objects examined. is any subset or subcollection of the population, including the case that the sample consists of the whole population, in which case it is termed a census.
Definition
A measurementA number or attribute computed for each member of a set of objects. is a number or attribute computed for each member of a population or of a sample. The measurements of sample elements are collectively called the sample dataThe measurements from a sample..
Definition
A parameterA number that summarizes some aspect of the population. is a number that summarizes some aspect of the population as a whole. A statisticA number computed from the sample data. is a number computed from the sample data.
Continuing with our example, if the average value of the cars in our sample was $8,357, then it seems reasonable to conclude that the average value of all cars is about $8,357. In reasoning this way we have drawn an inference about the population based on information obtained from the sample. In general, statistics is a study of data: describing properties of the data, which is called descriptive statistics, and drawing conclusions about a population of interest from information extracted from a sample, which is called inferential statistics. Computing the single number $8,357 to summarize the data was an operation of descriptive statistics; using it to make a statement about the population was an operation of inferential statistics.
Definition
StatisticsCollection, display, analysis, and inference from data. is a collection of methods for collecting, displaying, analyzing, and drawing conclusions from data.
Definition
Descriptive statisticsThe organization, display, and description of data. is the branch of statistics that involves organizing, displaying, and describing data.
Definition
Inferential statisticsDrawing conclusions about a population based on a sample. is the branch of statistics that involves drawing conclusions about a population based on information contained in a sample taken from that population.
The measurement made on each element of a sample need not be numerical. In the case of automobiles, what is noted about each car could be its color, its make, its body type, and so on. Such data are categorical or qualitative, as opposed to numerical or quantitative data such as value or age. This is a general distinction.
Definition
Qualitative dataMeasurements for which there is no natural numerical scale. are measurements for which there is no natural numerical scale, but which consist of attributes, labels, or other nonnumerical characteristics.
Definition
Quantitative dataNumerical measurements that arise from a natural numerical scale. are numerical measurements that arise from a natural numerical scale.
Qualitative data can generate numerical sample statistics. In the automobile example, for instance, we might be interested in the proportion of all cars that are less than six years old. In our same sample of 200 cars we could note for each car whether it is less than six years old or not, which is a qualitative measurement. If 172 cars in the sample are less than six years old, which is 0.86 or 86%, then we would estimate the parameter of interest, the population proportion, to be about the same as the sample statistic, the sample proportion, that is, about 0.86.
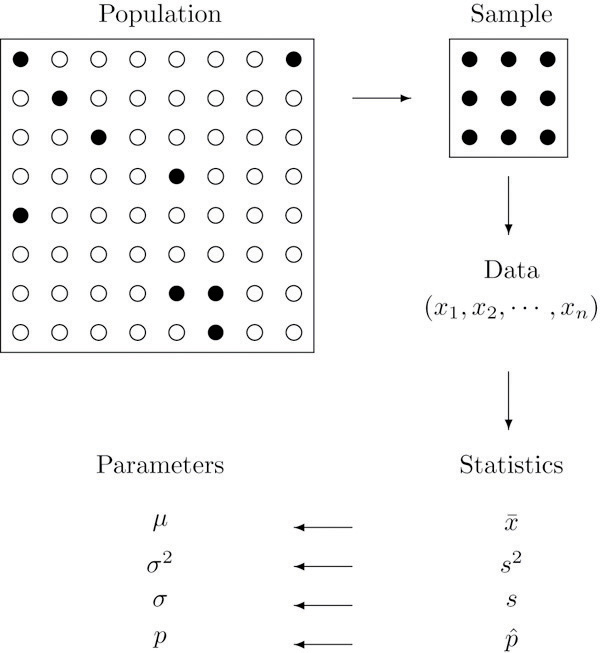
The relationship between a population of interest and a sample drawn from that population is perhaps the most important concept in statistics, since everything else rests on it. This relationship is illustrated graphically in Figure 1.1 "The Grand Picture of Statistics". The circles in the large box represent elements of the population. In the figure there was room for only a small number of them but in actual situations, like our automobile example, they could very well number in the millions. The solid black circles represent the elements of the population that are selected at random and that together form the sample. For each element of the sample there is a measurement of interest, denoted by a lower case x (which we have indexed as to tell them apart); these measurements collectively form the sample data set. From the data we may calculate various statistics. To anticipate the notation that will be used later, we might compute the sample mean and the sample proportion , and take them as approximations to the population mean μ (this is the lower case Greek letter mu, the traditional symbol for this parameter) and the population proportion p, respectively. The other symbols in the figure stand for other parameters and statistics that we will encounter.
Figure 1.1 The Grand Picture of Statistics
Key Takeaways
- Statistics is a study of data: describing properties of data (descriptive statistics) and drawing conclusions about a population based on information in a sample (inferential statistics).
- The distinction between a population together with its parameters and a sample together with its statistics is a fundamental concept in inferential statistics.
- Information in a sample is used to make inferences about the population from which the sample was drawn.
Exercises
-
Explain what is meant by the term population.
-
Explain what is meant by the term sample.
-
Explain how a sample differs from a population.
-
Explain what is meant by the term sample data.
-
Explain what a parameter is.
-
Explain what a statistic is.
-
Give an example of a population and two different characteristics that may be of interest.
-
Describe the difference between descriptive statistics and inferential statistics. Illustrate with an example.
-
Identify each of the following data sets as either a population or a sample:
- The grade point averages (GPAs) of all students at a college.
- The GPAs of a randomly selected group of students on a college campus.
- The ages of the nine Supreme Court Justices of the United States on January 1, 1842.
- The gender of every second customer who enters a movie theater.
- The lengths of Atlantic croakers caught on a fishing trip to the beach.
-
Identify the following measures as either quantitative or qualitative:
- The 30 high-temperature readings of the last 30 days.
- The scores of 40 students on an English test.
- The blood types of 120 teachers in a middle school.
- The last four digits of social security numbers of all students in a class.
- The numbers on the jerseys of 53 football players on a team.
-
Identify the following measures as either quantitative or qualitative:
- The genders of the first 40 newborns in a hospital one year.
- The natural hair color of 20 randomly selected fashion models.
- The ages of 20 randomly selected fashion models.
- The fuel economy in miles per gallon of 20 new cars purchased last month.
- The political affiliation of 500 randomly selected voters.
-
A researcher wishes to estimate the average amount spent per person by visitors to a theme park. He takes a random sample of forty visitors and obtains an average of $28 per person.
- What is the population of interest?
- What is the parameter of interest?
- Based on this sample, do we know the average amount spent per person by visitors to the park? Explain fully.
-
A researcher wishes to estimate the average weight of newborns in South America in the last five years. He takes a random sample of 235 newborns and obtains an average of 3.27 kilograms.
- What is the population of interest?
- What is the parameter of interest?
- Based on this sample, do we know the average weight of newborns in South America? Explain fully.
-
A researcher wishes to estimate the proportion of all adults who own a cell phone. He takes a random sample of 1,572 adults; 1,298 of them own a cell phone, hence 1298∕1572 ≈ .83 or about 83% own a cell phone.
- What is the population of interest?
- What is the parameter of interest?
- What is the statistic involved?
- Based on this sample, do we know the proportion of all adults who own a cell phone? Explain fully.
-
A sociologist wishes to estimate the proportion of all adults in a certain region who have never married. In a random sample of 1,320 adults, 145 have never married, hence 145∕1320 ≈ .11 or about 11% have never married.
- What is the population of interest?
- What is the parameter of interest?
- What is the statistic involved?
- Based on this sample, do we know the proportion of all adults who have never married? Explain fully.
-
- What must be true of a sample if it is to give a reliable estimate of the value of a particular population parameter?
- What must be true of a sample if it is to give certain knowledge of the value of a particular population parameter?
Answers
-
A population is the total collection of objects that are of interest in a statistical study.
-
-
A sample, being a subset, is typically smaller than the population. In a statistical study, all elements of a sample are available for observation, which is not typically the case for a population.
-
-
A parameter is a value describing a characteristic of a population. In a statistical study the value of a parameter is typically unknown.
-
-
All currently registered students at a particular college form a population. Two population characteristics of interest could be the average GPA and the proportion of students over 23 years.
-
-
- Population.
- Sample.
- Population.
- Sample.
- Sample.
-
-
- Qualitative.
- Qualitative.
- Quantitative.
- Quantitative.
- Qualitative.
-
-
- All newborn babies in South America in the last five years.
- The average birth weight of all newborn babies in South America in the last five years.
- No, not exactly, but we know the approximate value of the average.
-
-
- All adults in the region.
- The proportion of the adults in the region who have never married.
- The proportion computed from the sample, 0.1.
- No, not exactly, but we know the approximate value of the proportion.
-