This is “Changes in Demand and Supply”, section 2.5 from the book Beginning Economic Analysis (v. 1.0). For details on it (including licensing), click here.
For more information on the source of this book, or why it is available for free, please see the project's home page. You can browse or download additional books there. To download a .zip file containing this book to use offline, simply click here.
2.5 Changes in Demand and Supply
Learning Objective
- What are the effects of changes in demand and supply?
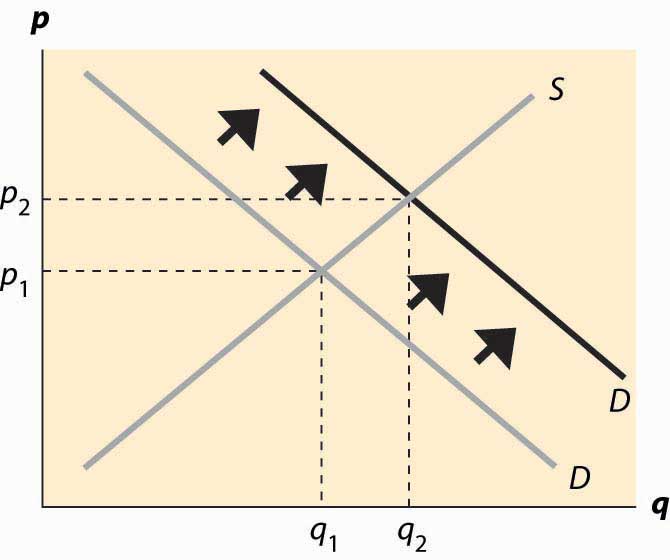
What are the effects of an increase in demand? As the population of California has grown, the demand for housing has risen. This has pushed the price of housing up and also spurred additional development, increasing the quantity of housing supplied as well. We see such a demand increase illustrated in Figure 2.10 "An increase in demand", which represents an increase in the demand. In this figure, supply and demand have been abbreviated S and D. Demand starts at D1 and is increased to D2. Supply remains the same. The equilibrium price increases from p1* to p2*, and the quantity rises from q1* to q2*.
Figure 2.10 An increase in demand

A decrease in demand—which occurred for typewriters with the advent of computers, or buggy whips as cars replaced horses as the major method of transportation—has the reverse effect of an increase and implies a fall in both the price and the quantity traded. Examples of decreases in demand include products replaced by other products—VHS tapes were replaced by DVDs, vinyl records were replaced by CDs, cassette tapes were replaced by CDs, floppy disks (oddly named because the 1.44 MB “floppy,” a physically hard product, replaced the 720 KB, 5 ¼-inch soft floppy disk) were replaced by CDs and flash memory drives, and so on. Even personal computers experienced a fall in demand as the market was saturated in 2001.
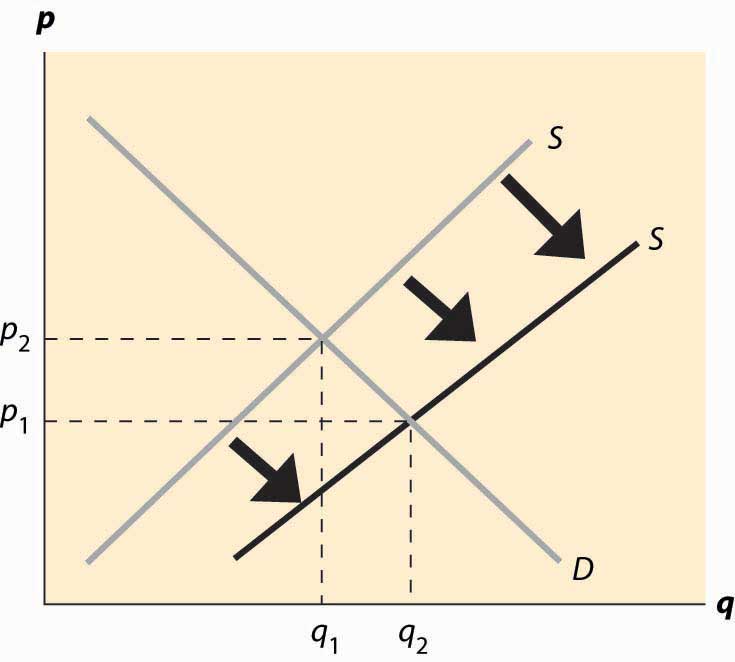
An increase in supply comes about from a fall in the marginal cost: recall that the supply curve is just the marginal cost of production. Consequently, an increased supply is represented by a curve that is lower and to the right on the supply–demand graph, which is an endless source of confusion for many students. The reasoning—lower costs and greater supply are the same thing—is too easily forgotten. The effects of an increase in supply are illustrated in Figure 2.11 "An increase in supply". The supply curve goes from S1 to S2, which represents a lower marginal cost. In this case, the quantity traded rises from q1* to q2* and price falls from p1* to p2*.
Figure 2.11 An increase in supply

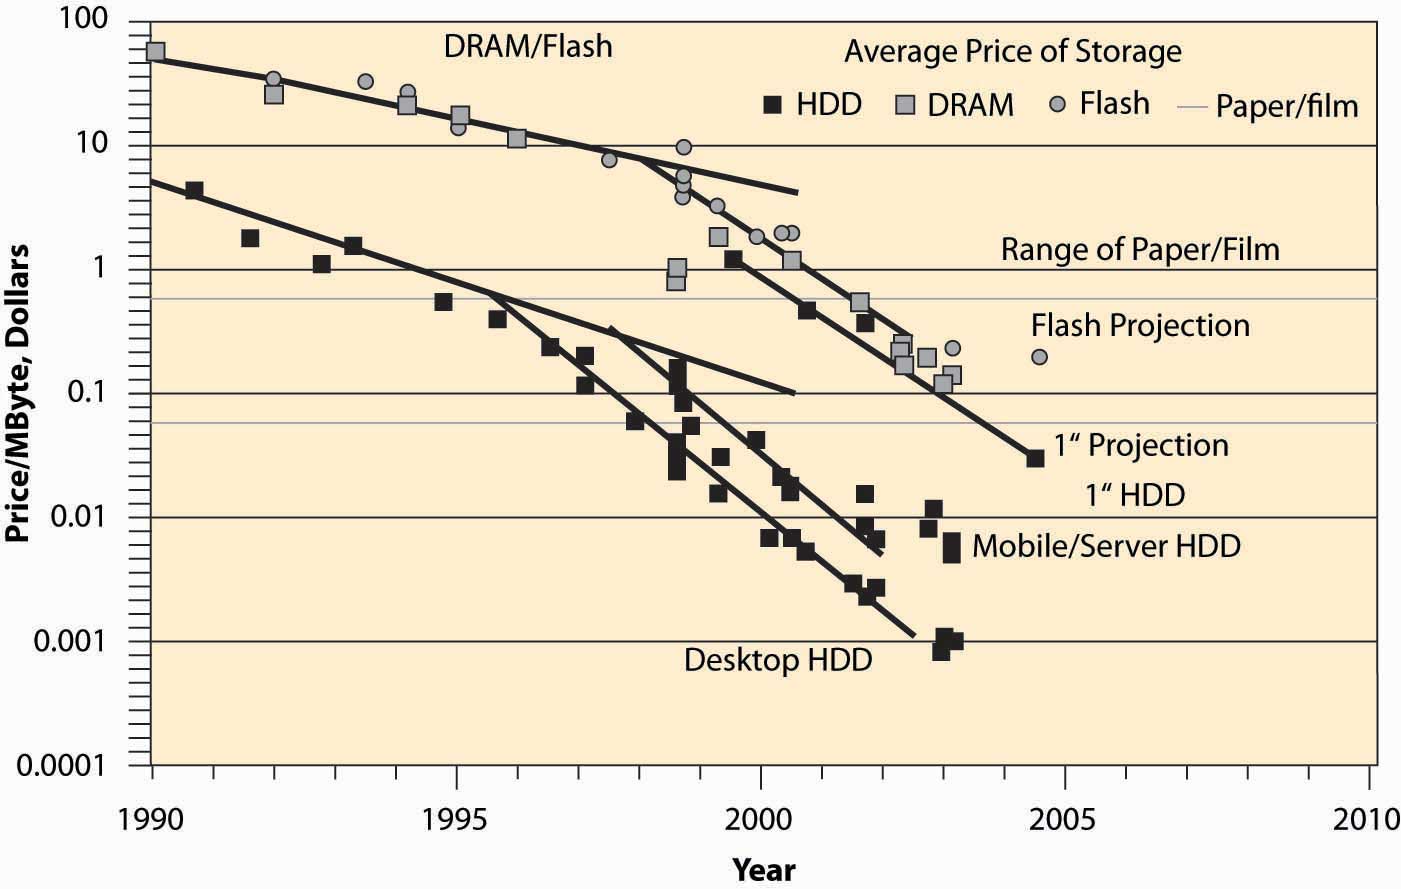
Computer equipment provides dramatic examples of increases in supply. Consider dynamic random access memory (DRAM). DRAMs are the chips in computers and many other devices that store information on a temporary basis.Information that will be stored on a long-term basis is generally embedded in flash memory or on a hard disk. Neither of these products loses its information when power is turned off, unlike DRAM. Their cost has fallen dramatically, which is illustrated in Figure 2.12 "Price of storage".Used with permission of computer storage expert, Dr. Edward Grochowski. Note that the prices in this figure reflect a logarithmic scale, so that a fixed-percentage decrease is illustrated by a straight line. Prices of DRAMs fell to close to 1/1,000 of their 1990 level by 2004. The means by which these prices have fallen are themselves quite interesting. The main reasons are shrinking the size of the chip (a “die shrink”), so that more chips fit on each silicon disk, and increasing the size of the disk itself, so again more chips fit on a disk. The combination of these two, each of which required solutions to thousands of engineering and chemistry problems, has led to dramatic reductions in marginal costs and consequent increases in supply. The effect has been that prices fell dramatically and quantities traded rose dramatically.
An important source of supply and demand changes can be found in the markets of complements. A decrease in the price of a demand–complement increases the demand for a product; and, similarly, an increase in the price of a demand–substitute increases the demand for a product. This gives two mechanisms to trace through effects from external markets to a particular market via the linkage of demand substitutes or complements. For example, when the price of gasoline falls, the demand for automobiles (a complement) should increase overall. As the price of automobiles rises, the demand for bicycles (a substitute in some circumstances) should rise. When the price of computers falls, the demand for operating systems (a complement) should rise. This gives an operating system seller like Microsoft an incentive to encourage technical progress in the computer market in order to make the operating system more valuable.
Figure 2.12 Price of storage

An increase in the price of a supply–substitute reduces the supply of a product (by making the alternative good more attractive to suppliers); and, similarly, a decrease in the price of a supply-complement reduces the supply of a good. By making the by-product less valuable, the returns to investing in a good are reduced. Thus, an increase in the price of DVD-R disks (used for recording DVDs) discourages investment in the manufacture of CD-R disks, which are a substitute in supply, leading to a decrease in the supply of CD-Rs. This tends to increase the price of CD-Rs, other things equal. Similarly, an increase in the price of oil increases exploration for oil, which increases the supply of natural gas, which is a complement in supply. However, since natural gas is also a demand substitute for oil (both are used for heating homes), an increase in the price of oil also tends to increase the demand for natural gas. Thus, an increase in the price of oil increases both the demand and the supply of natural gas. Both changes increase the quantity traded, but the increase in demand tends to increase the price, while the increase in supply tends to decrease the price. Without knowing more, it is impossible to determine whether the net effect is an increase or decrease in the price.
When the price of gasoline goes up, people curtail their driving to some extent but don’t immediately scrap their SUVs to buy more fuel-efficient automobiles or electric cars. Similarly, when the price of electricity rises, people don’t immediately replace their air conditioners and refrigerators with the most modern, energy-saving ones. There are three significant issues raised by this kind of example. First, such changes may be transitory or permanent, and people react differently to temporary changes than to permanent changes. Second, energy is a modest portion of the cost of owning and operating an automobile or refrigerator, so it doesn’t make sense to scrap a large capital investment over a small permanent increase in cost. Thus, people rationally continue to operate “obsolete” devices until their useful life is over, even when they wouldn’t buy an exact copy of that device. This situation, in which past choices influence current decisions, is called hysteresisSituation in which past choices influence current decisions.. Third, a permanent increase in energy prices leads people to buy more fuel-efficient cars and to replace their old gas-guzzlers more quickly. That is, the effects of a change are larger over a time period long enough that all inputs can be changed (which economists call the long runTime period long enough that all inputs can be changed.) than over a shorter time interval where not all inputs can be changed, or the short runTime interval in which not all inputs can be changed..
A striking example of such delays arose when oil quadrupled in price in 1973 and 1974, caused by a reduction in sales by the cartel of oil-producing nations, OPEC, which stands for the Organization of Petroleum Exporting Countries. The increased price of oil (and consequent increase in gasoline prices) caused people to drive less and to lower their thermostats in the winter, thus reducing the quantity of oil demanded. Over time, however, they bought more fuel-efficient cars and insulated their homes more effectively, significantly reducing the quantity demanded still further. At the same time, the increased prices for oil attracted new investments into oil production in Alaska, the North Sea between Britain and Norway, Mexico, and other areas. Both of these effects (long-run substitution away from energy and long-run supply expansion) caused the price to fall over the longer term, undoing the supply reduction created by OPEC. In 1981, OPEC further reduced output, sending prices still higher; but again, additional investments in production, combined with energy-saving investments, reduced prices until they fell back to 1973 levels (adjusted for inflation) in 1986. Prices continued to fall until 1990 (reaching an all-time low level) when Iraq’s invasion of Kuwait and the resulting first Iraqi war sent them higher again.
Short-run and long-run effects represent a theme of economics, with the major conclusion of the theme being that substitution doesn’t occur instantaneously, which leads to predictable patterns of prices and quantities over time.
It turns out that direct estimates of demand and supply are less useful as quantifications than notions of percentage changes, which have the advantage of being unit-free. This observation gives rise to the concept of elasticity, the next topic.
Key Takeaways
- An increase in the demand increases both the price and quantity traded.
- A decrease in demand implies a fall in both the price and the quantity traded.
- An increase in the supply decreases the price and increases the quantity traded.
- A decrease in the supply increases the price and decreases the quantity traded.
- A change in the supply of a good affects its price. This price change will in turn affect the demand for both demand complements and demand subsitutes.
- People react less to temporary changes than to permanent changes. People rationally continue to operate “obsolete” devices until their useful life is over, even when they wouldn’t buy an exact copy of that device, an effect called hysteresis.
- Short-run and long-run effects represent a theme of economics, with the major conclusion that substitution doesn’t occur instantaneously, which leads to predictable patterns of prices and quantities over time.
Exercises
- Video games and music CDs are substitutes in demand. What is the effect of an increase in supply of video games on the price and quantity traded of music CDs? Illustrate your answer with diagrams for both markets.
- Electricity is a major input into the production of aluminum, and aluminum is a substitute in supply for steel. What is the effect of an increase in price of electricity on the steel market?
- Concerns about terrorism reduced demand for air travel and induced consumers to travel by car more often. What should happen to the price of Hawaiian hotel rooms?


