This is “Using Variance Analysis with Activity-Based Costing”, section 10.7 from the book Accounting for Managers (v. 1.0). For details on it (including licensing), click here.
For more information on the source of this book, or why it is available for free, please see the project's home page. You can browse or download additional books there. To download a .zip file containing this book to use offline, simply click here.


10.7 Using Variance Analysis with Activity-Based Costing
Learning Objective
- Explain how to use cost variance analysis with activity-based costing.
Question: As discussed in Chapter 3 "How Does an Organization Use Activity-Based Costing to Allocate Overhead Costs?", activity-based costing focuses on identifying activities required to make a product, forming cost pools for each activity, and allocating overhead costs to products based on the products’ use of each activity. Rather than establishing one standard variable overhead rate and standard quantity based on one cost driver, activity-based costing establishes several standard variable overhead rates and quantities, each having its own cost driver. How would variance analysis be implemented for a company that uses activity-based costing?
Answer: Regardless of whether a company uses the traditional costing approach or an activity-based costing approach, the process of performing variance analysis is the same. Similar to the traditional costing approach, the variable overhead spending variance for activity-based costing is calculated for each activity as follows:
Key Equation
Variable overhead spending variance = Actual cost − (AQ × SR)The variable overhead efficiency variance is calculated for each activity using activity-based costing as follows:
Key Equation
Variable overhead efficiency variance = (AQ × SR) − (SQ × SR)Instead of using AH and SH to represent actual hours and standard hours as we did earlier in the chapter, we use AQ and SQ to represent actual quantity and standard quantity for various activities used in activity-based costing.
Let’s work through an example of variance analysis using activity-based costing. Suppose Jerry’s Ice Cream identified three significant activities and established three standard rates to allocate variable manufacturing overhead instead of one rate based on direct labor hours. Information for the three activities for last year is:
| Activity | Standard Rate | Standard Quantity per Unit Produced | Actual Costs | Actual Quantity |
| Purchase orders | $25 per purchase order | 0.01 orders per unit | $42,000 | 1,600 purchase orders |
| Product testing | $0.20 per test minute | 1 minute per unit | $31,000 | 180,000 test minutes |
| Energy | $0.05 per minute of machine time | 2 minutes per unit | $27,000 | 575,000 minutes of machine time |
Recall that Jerry’s produced 210,000 units for the year. Figure 10.11 "Variable Overhead Variance Analysis for Jerry’s Ice Cream Using Activity-Based Costing" shows the resulting variable overhead variance analysis. Notice that the format for Figure 10.11 "Variable Overhead Variance Analysis for Jerry’s Ice Cream Using Activity-Based Costing" is the same as for Figure 10.8 "Variable Manufacturing Overhead Variance Analysis for Jerry’s Ice Cream". The variance calculations are also the same except variances are calculated for three activities rather than one. Note that total actual variable overhead costs remain at $100,000, but they are simply broken out into 3 activities ($100,000 = $42,000 for purchase orders + $31,000 for product testing + $27,000 for energy costs). Also, the flexible budget presented in Figure 10.11 "Variable Overhead Variance Analysis for Jerry’s Ice Cream Using Activity-Based Costing", totaling $115,500, differs from the flexible budget presented earlier since Jerry’s is using a different cost system in this example, which often results in different budgeted amounts ($115,500 = $52,500 purchase orders + $42,000 product testing + $21,000 energy).
Figure 10.11 Variable Overhead Variance Analysis for Jerry’s Ice Cream Using Activity-Based Costing
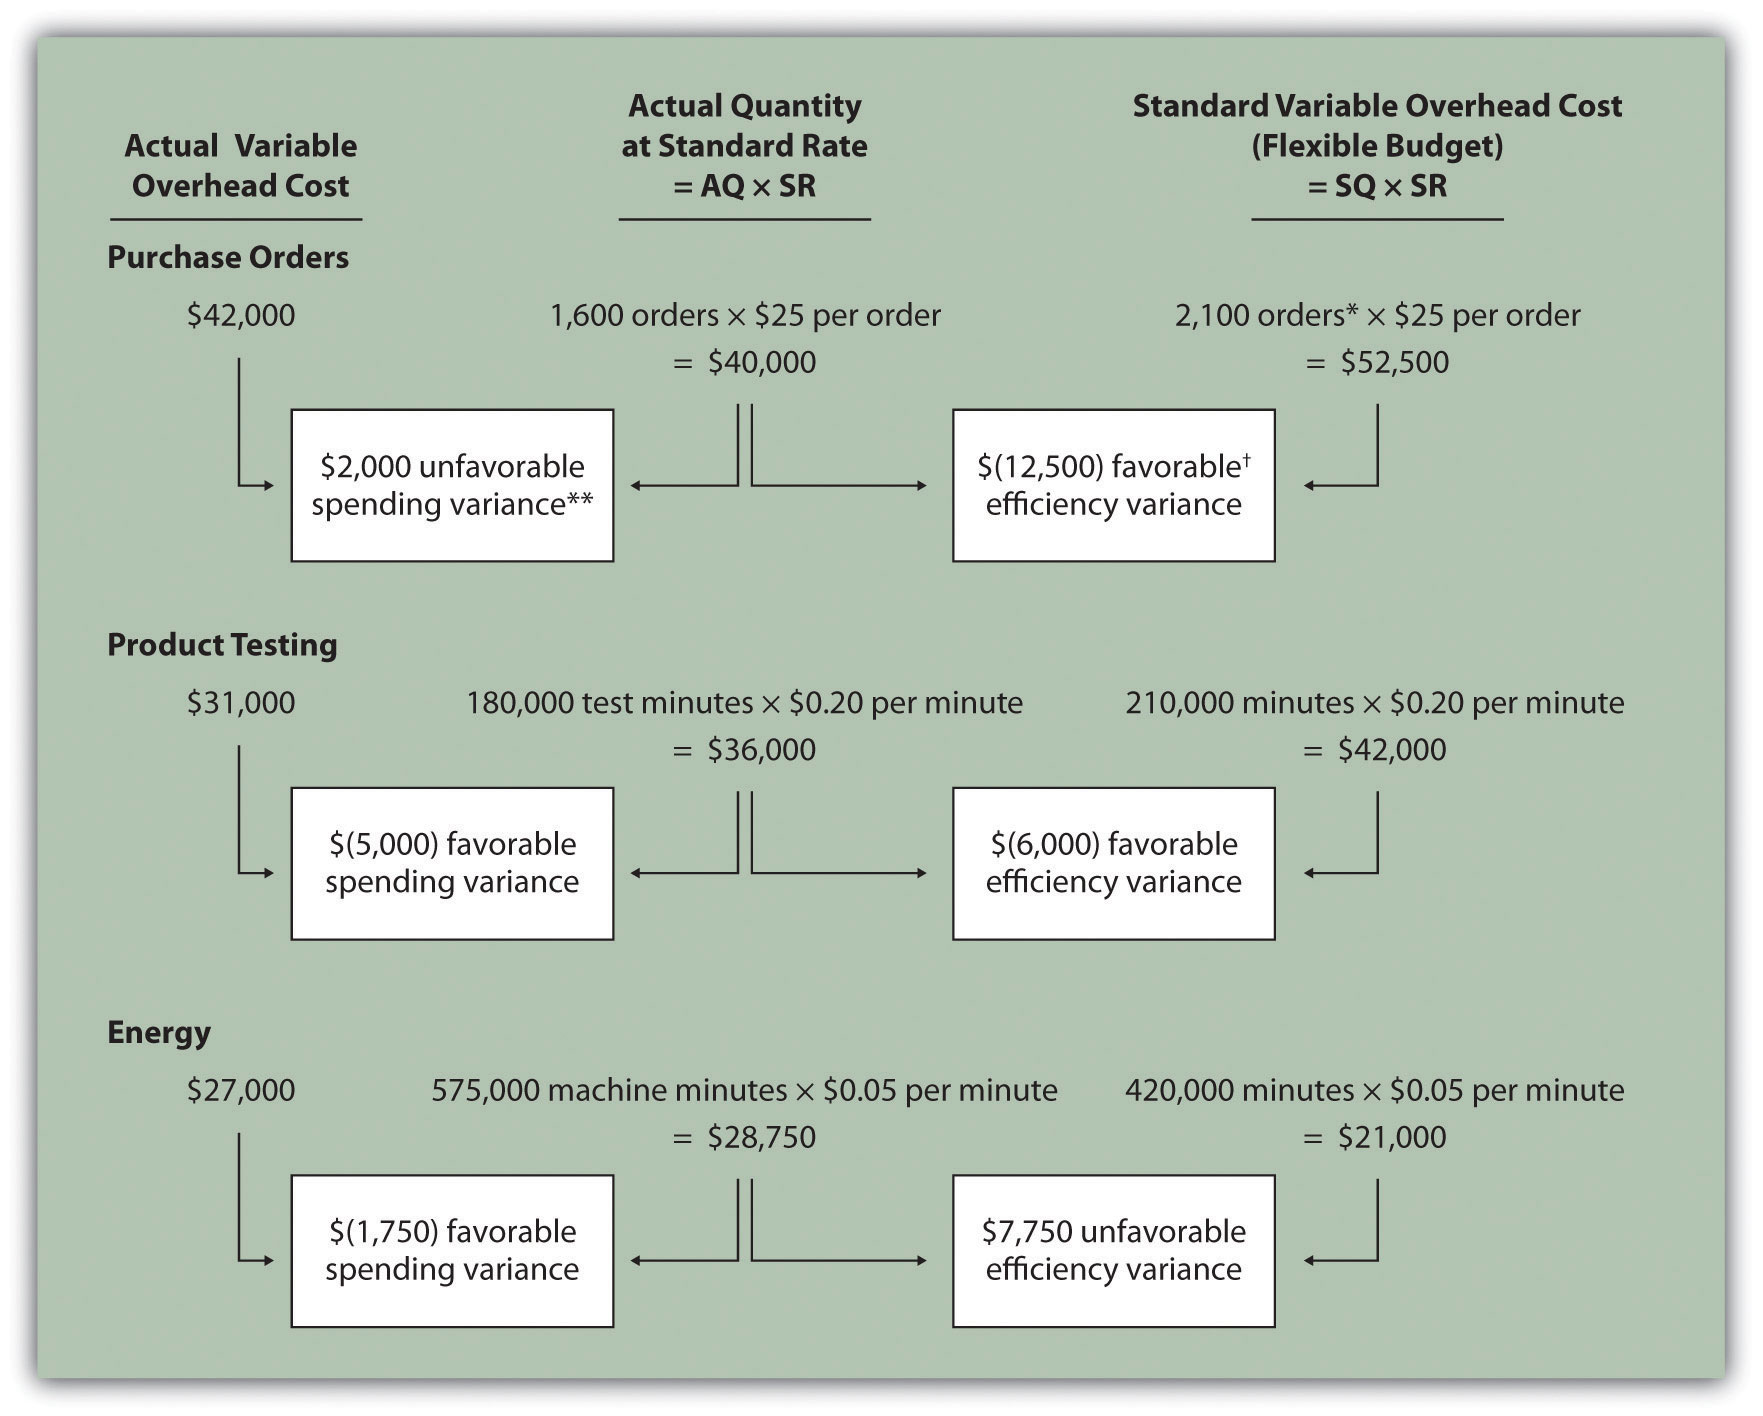
Note: AQ = Actual quantity of activity. SR = Standard variable manufacturing overhead rate per unit of activity. SQ = Standard quantity of activity given actual production of 210,000 units.
*Standard quantity of 2,100 purchase orders = Standard of 0.01 purchase orders per unit × 210,000 actual units produced.
**$2,000 unfavorable variable overhead spending variance = $42,000 −$40,000. Variance is unfavorable because the actual variable overhead cost is higher than the expected cost given actual quantity of 1,600 purchase orders.
† $(12,500) favorable variable overhead efficiency variance = $40,000 – $52,500. Variance is favorable because the 1,600 actual purchase orders are lower than the 2,100 expected (budgeted) purchase orders.
This type of costing system and resulting variance analysis provides management with further information regarding variable overhead costs and variances. As discussed earlier, management often establishes criteria to decide which variances to investigate. Assume that management of Jerry’s Ice Cream chooses to investigate the $7,750 unfavorable efficiency variance associated with energy. The management would like to know why 575,000 minutes of actual machine time were used instead of the expected 420,000 minutes. Perhaps the machines were operating poorly due to cutbacks in maintenance, or maybe new employees were not as efficient using the machines. Whatever the cause, Jerry’s has identified the issue by integrating its activity-based costing system with the cost variance analysis concepts discussed in this chapter.
Key Takeaway
- Using cost variance analysis with activity-based costing is much like using cost variance analysis with traditional costing. Both utilize a spending variance and an efficiency variance. However, activity-based costing requires calculating a spending and efficiency variance for each activity rather than only one activity base typically used in traditional costing.
Review Problem 10.7
Assume Carol’s Cookies uses activity-based costing to allocate variable manufacturing overhead costs instead of one rate based on direct labor hours. Carol identified three activities with the following information for last year.
| Activity | Standard Rate | Standard Quantity per Unit Produced | Actual Costs | Actual Quantity |
| Indirect materials | $0.60 per pound | 0.5 pounds per unit | $130,000 | 220,000 pounds |
| Product testing | $0.10 per test minute | 2 minutes per unit | $ 60,000 | 750,000 test minutes |
| Energy | $0.12 per minute of machine time | 4 minutes per unit | $170,000 | 1,400,000 minutes of machine time |
Recall that Carol’s Cookies produced and sold 390,000 units for the year. Prepare a variance analysis for Carol’s Cookies using the format shown in Figure 10.11 "Variable Overhead Variance Analysis for Jerry’s Ice Cream Using Activity-Based Costing".
Solution to Review Problem 10.7
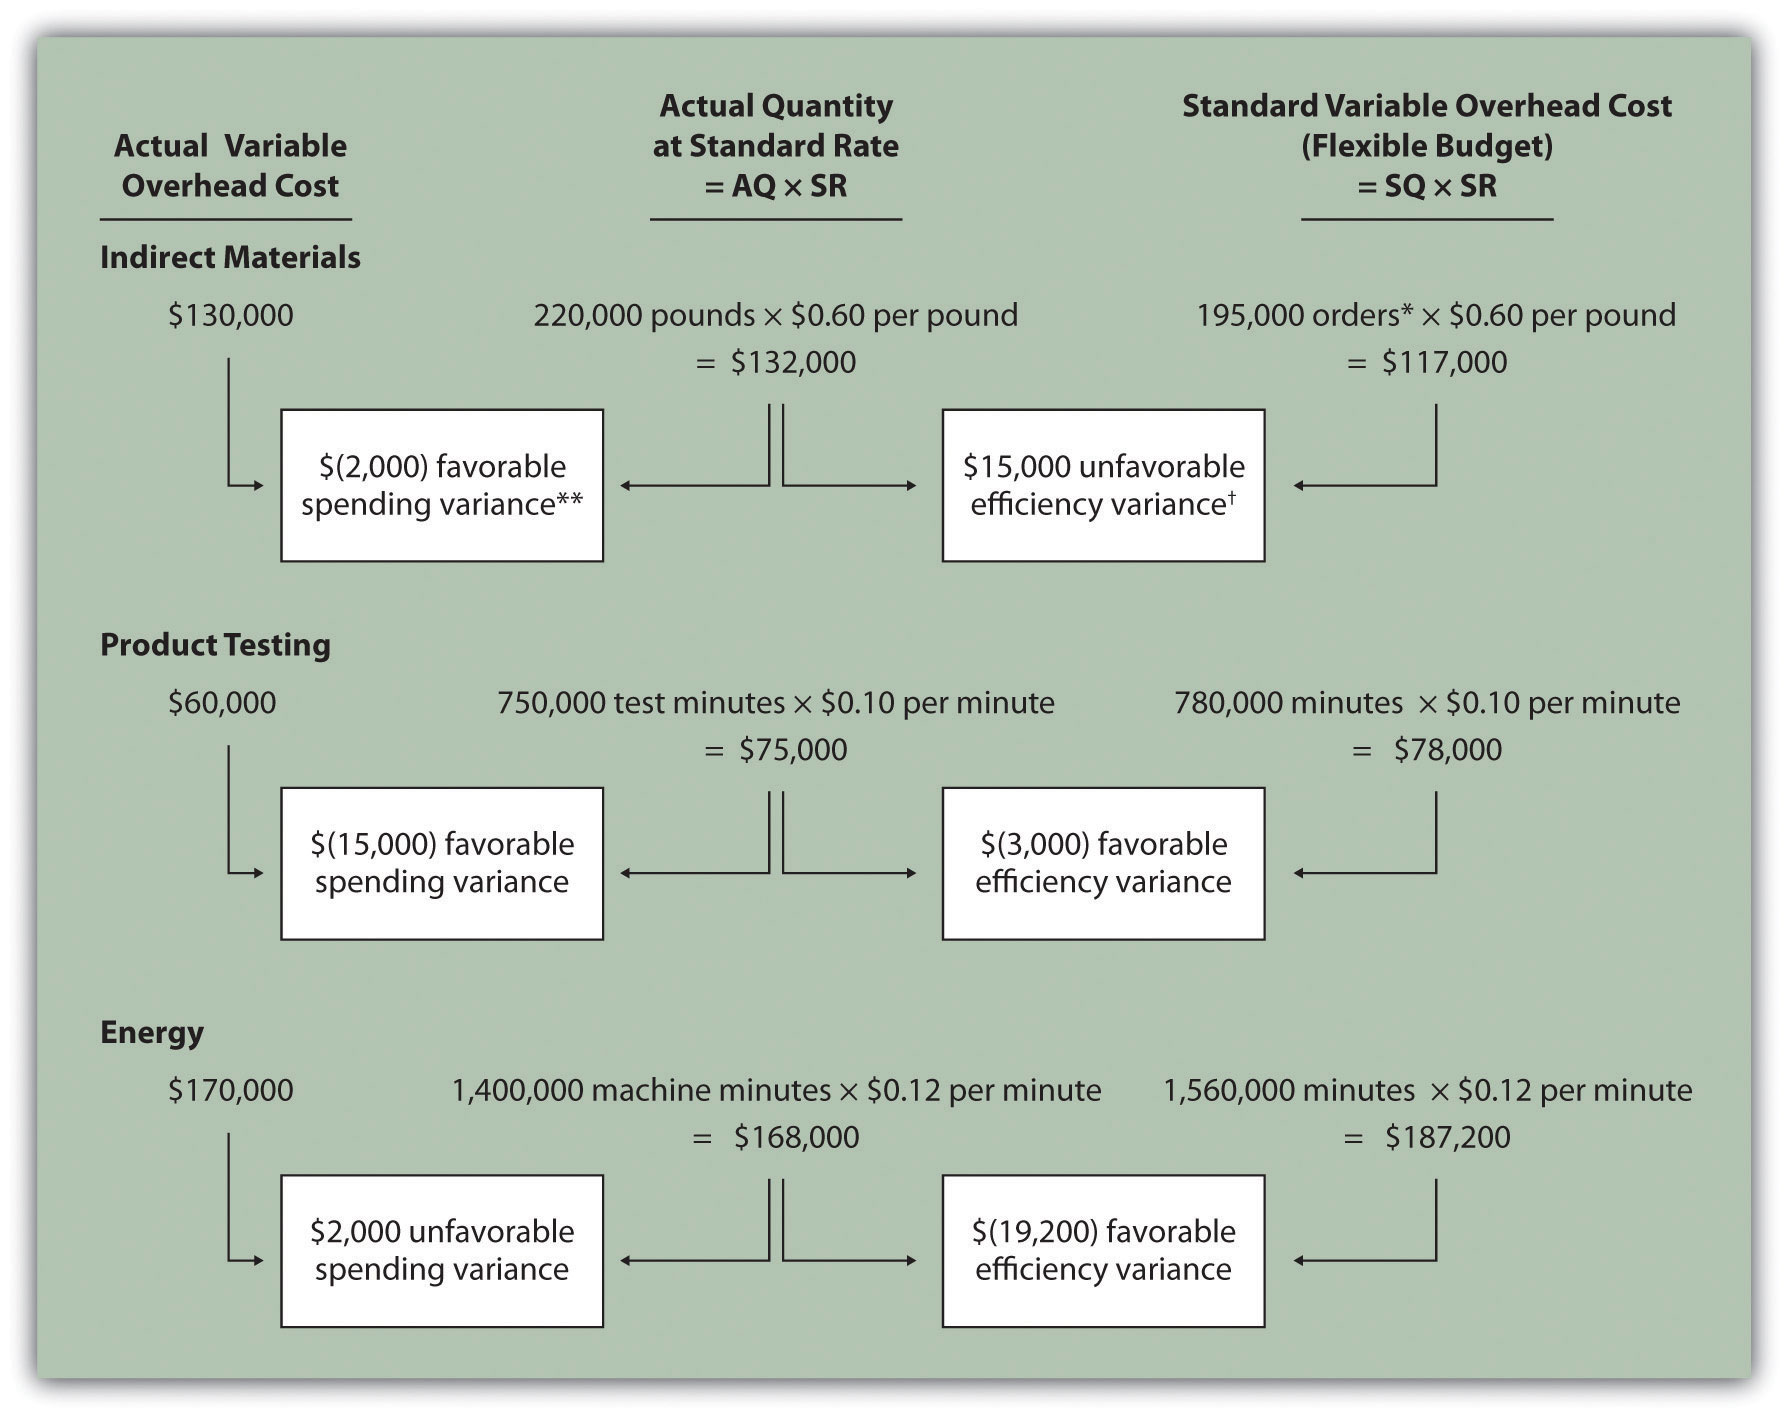
Note: AQ = Actual quantity of activity. SR = Standard variable manufacturing overhead rate per unit of activity. SQ = Standard quantity of activity given actual production of 210,000 units.
*Standard quantity of 195,000 pounds = Standard of 0.5 pounds per unit × 390,000 actual units produced.
**$(2,000) favorable variable overhead spending variance = $130,000 – $132,000. Variance is favorable because the actual variable overhead cost is lower than the expected cost given actual quantity of 220,000 pounds.
† $15,000 unfavorable variable overhead efficiency variance = $132,000 – $117,000. Variance is unfavorable because the 220,000 actual pounds is higher than the 195,000 expected (budgeted) pounds.