This is “Appendix: Performing Regression Analysis with Excel”, section 5.5 from the book Accounting for Managers (v. 1.0). For details on it (including licensing), click here.
For more information on the source of this book, or why it is available for free, please see the project's home page. You can browse or download additional books there. To download a .zip file containing this book to use offline, simply click here.


5.5 Appendix: Performing Regression Analysis with Excel
Learning Objective
- Perform regression analysis using Excel.
Question: Regression analysis is often performed to estimate fixed and variable costs. Many different software packages have the capability of performing regression analysis, including Excel. This appendix provides a basic illustration of how to use Excel to perform regression analysis. Statistics courses cover this topic in more depth. How is regression analysis used to estimate fixed and variable costs?
Answer: As noted in the chapter, regression analysis uses a series of mathematical equations to find the best possible fit of the line to the data points. For the purposes of this chapter, the end goal of regression analysis is to estimate fixed and variable costs, which are described in the equation form of Y = f + vX. Recall that the following Excel output was provided earlier in the chapter based on the data presented in Table 5.4 "Monthly Production Costs for Bikes Unlimited" for Bikes Unlimited.
| Coefficients | |
| y-intercept | 43,276 |
| x variable | 53.42 |
The resulting equation to estimate production costs is Y = $43,276 + $53.42X. We now describe the steps to be performed in Excel to get this equation.
Step 1. Confirm that the Data Analysis package is installed.
Go to the Data tab on the top menu bar and look for Data Analysis. If Data Analysis appears, you are ready to perform regression analysis. If Data Analysis does not appear, go to the help button (denoted as a question mark in the upper right-hand corner of the screen) and type Analysis ToolPak. Look for the Load the Analysis ToolPak option and follow the instructions given.
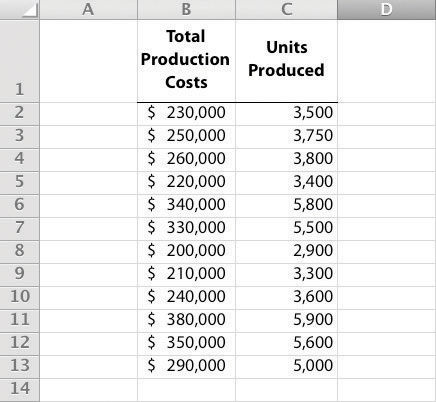
Step 2. Enter the data in the spreadsheet.
Using a new Excel spreadsheet, enter the data points in two columns. The monthly data in Table 5.4 "Monthly Production Costs for Bikes Unlimited" includes Total Production Costs and Units Produced. Thus use one column (column A) to enter Total Production Costs data and another column (column B) to enter Units Produced data.
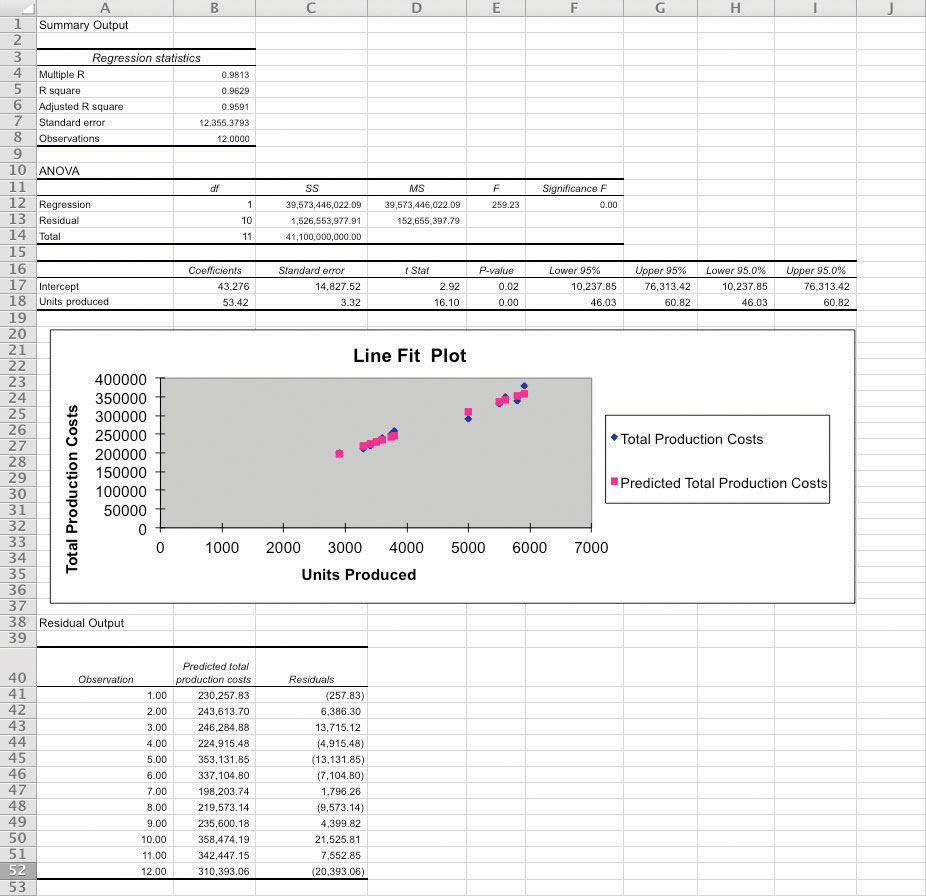
Step 3. Run the regression analysis.
Using the same spreadsheet set up in step 2, select Data, Data Analysis, and Regression. A box appears that requires the input of several items needed to perform regression. Input Y Range requires that you highlight the y-axis data, including the heading (cells B1 through B13 in the example shown in step 2). Input X Range requires that you highlight the x-axis data, including the heading (cells C1 through C13 in the example shown in step 2). Check the Labels box; this indicates that the top of each column has a heading (B1 and C1). Select New Workbook; this will put the regression results in a new workbook. Lastly, check the Line Fit Plots box, then select OK. The result is as follows (note that we made a few minor format changes to allow for a better presentation of the data).
Step 4. Analyze the output.
Here, we discuss key items shown in the regression output provided in step 3.
-
Cost Equation: The output shows that estimated fixed costs (shown as the Intercept coefficient in cell B17) total $43,276, and the estimated variable cost per unit (shown as the Units Produced coefficient in B18) is $53.42. Thus the cost equation is:
Y = $43,276 + $53.42X or Total Production Costs = $43,276 + ($53.42 × Units Produced) - Line Fit Plot and R-Squared: The plot shows that actual total production costs are very close to predicted total production costs calculated using the cost equation. Thus the cost equation created from the regression analysis is likely to be useful in predicting total production costs. Another way to assess the accuracy of the regression output is to review the R-squared statistic shown in cell B5. R-squaredMeasures the percent of the variance in the dependent variable explained by the independent variable. measures the percent of the variance in the dependent variable (total production costs, in this example) explained by the independent variable (units produced, in this example). According to the output, 96.29 percent of the variance in total production costs is explained by the level of units produced—further evidence that the regression results will be useful in predicting total production costs.
The discussion of regression analysis in this chapter is meant to serve as an introduction to the topic. To further enhance your knowledge of regression analysis and to provide for a more thorough analysis of the data, you should pursue the topic in an introductory statistics course.
Key Takeaway
-
Software applications, such as Excel, can use regression analysis to estimate fixed and variable costs.
- Once the data analysis package is installed, historical data are entered in the spreadsheet, and the regression analysis is run.
- The resulting data are used to determine the cost equation, which includes estimated fixed and variable costs.
The line fit plot and R-squared statistic are used to assess the usefulness of the cost equation in estimating costs.
Review Problem 5.9
Refer to the monthly production cost data for Alta Production, Inc., in Note 5.21 "Review Problem 5.5". Use the four steps of regression analysis described in this appendix to estimate total fixed costs and variable cost per unit. State your results in the equation form Y = f + vX.
Solution to Review Problem 5.9
Regression analysis performed using Excel results in the following output:
| Coefficients | |
| y-intercept | 703 |
| x variable | 1,442.97 |
Thus the total cost equation is:
Y = $703 + $1,442.97XEnd-of-Chapter Exercises
Questions
- What is a fixed cost? Provide two examples.
- What is the difference between a committed fixed cost and a discretionary fixed cost? Provide examples of each.
- What is a variable cost? Provide two examples.
- What is a mixed cost? Provide two examples.
- Describe the variables in the cost equation Y = f + vX.
- How is the cost equation Y = f + vX used to estimate future costs?
- Why is it important to identify how costs behave with changes in activity?
- Review Note 5.11 "Business in Action 5.2" Why was the school district’s administration surprised to find out that cost savings from closing a school would be much lower than initially anticipated?
- Explain how account analysis is used to estimate costs.
- Describe the four steps of the high-low method and how these steps are used to estimate costs.
- Why might the high-low method lead to inaccurate results?
- Describe the five steps of the scattergraph method and how these steps are used to estimate costs.
- How can the scattergraph method be used to identify unusual data points?
- Describe how regression analysis is used to estimate costs.
- How does the contribution margin income statement differ from the traditional income statement?
- Review Note 5.27 "Business in Action 5.3" Which costs at Lowe’s are likely to be variable costs?
- Describe the term relevant range. Why is it important to stay within the relevant range when estimating costs?
- Explain how some costs can behave in a nonlinear way.
Brief Exercises
- Planning at Bikes Unlimited. Refer to the dialogue at Bikes Unlimited presented at the beginning of the chapter. What is the first step to be taken by Susan and her accounting staff to help in estimating profit for August?
-
Identifying Cost Behavior. Vasquez Incorporated is trying to identify the cost behavior of the three costs that follow. Cost information is provided for three months.
Cost A Cost B Cost C Month Units Produced Total Costs Cost per Unit Total Costs Cost per Unit Total Costs Cost per Unit 1 1,500 $1,500 _____ $4,500 _____ $3,000 _____ 2 3,000 1,500 _____ 5,250 _____ 6,000 _____ 3 750 1,500 _____ 3,750 _____ 1,500 _____ Required:
- Calculate the cost per unit, and then identify how the cost behaves for each of the three costs (fixed, variable, or mixed). Explain the reasoning for your answers.
- How does identifying cost behavior patterns help managers?
-
Account Analysis. Cordova Company would like to estimate production costs on an annual basis. Costs incurred for direct materials and direct labor are variable costs. The accounting records indicate that the following production costs were incurred last year for 50,000 units.
Direct materials $100,000 Direct labor $215,000 Manufacturing overhead $300,000 (20 percent fixed; 80 percent variable) Required:
Use account analysis to estimate the fixed costs per year, and the variable cost per unit.
-
High-Low Method. The city of Rockville reported the following annual cost data for maintenance work performed on its fleet of trucks.
Reporting Period (Year) Total Costs Level of Activity (Miles Driven) Year 1 $ 750,000 225,000 Year 2 850,000 240,000 Year 3 1,100,000 430,000 Year 4 1,150,000 454,000 Year 5 1,250,000 560,000 Year 6 1,550,000 710,000 Required:
- Use the four steps of the high-low method to estimate total fixed costs per year and the variable cost per mile. State your results in the cost equation form Y = f + vX.
- What would the estimated costs be if the trucks drove 500,000 miles in year 7?
-
Scattergraph Method. Refer to the data in Brief Exercise 22 for the city of Rockville.
Required:
- Use the five steps of the scattergraph method to estimate total fixed costs per year and the variable cost per mile. State your results in the cost equation form Y = f + vX by filling in the dollar amounts for f and v.
- What would the estimated costs be if the trucks drove 500,000 miles in year 7?
-
Regression Analysis. Regression analysis was run using the data in Brief Exercise 22 for the city of Rockville. The output is shown here:
Coefficients y-intercept 441,013 x variable 1.53 Required:
- Use the regression output to develop the cost equation Y = f + vX by filling in the dollar amounts for f and v.
- What would the city of Rockville’s estimated costs be if its trucks drove 500,000 miles in year 7?
-
Contribution Margin Income Statement. Last year Pod Products, Inc., sold its product for $250 per unit. Production costs totaled $40,000 (25 percent fixed, 75 percent variable). Selling and administrative costs totaled $150,000 (10 percent fixed, 90 percent variable). Pod Products produced and sold 1,000 units last year.
Required:
Prepare a contribution margin income statement for Pod Products, Inc.
-
Relevant Range. Jersey Company produces jerseys for athletic teams, and typically produces between 1,000 and 5,000 jerseys annually. The accountant is asked to estimate production costs for this coming year assuming 9,000 jerseys will be produced.
Required:
What is meant by the term relevant range, and why is the relevant range important for estimating production costs for this coming year at Jersey Company?
Exercises: Set A
-
Identifying Cost Behavior. Zhang Corporation is trying to identify the cost behavior of the three costs shown. Cost information is provided for six months.
Cost 1 Cost 2 Cost 3 Month Units Produced Total Costs Cost per Unit Total Costs Cost per Unit Total Costs Cost per Unit 1 18,000 $36,000 _____ $19,800 _____ $5,000 _____ 2 16,000 32,000 _____ 19,200 _____ 5,000 _____ 3 14,000 28,000 _____ 18,200 _____ 5,000 _____ 4 12,000 24,000 _____ 16,800 _____ 5,000 _____ 5 10,000 20,000 _____ 14,500 _____ 5,000 _____ 6 8,000 16,000 _____ 12,000 _____ 5,000 _____ Required:
- Calculate the cost per unit, and then identify how the cost behaves (fixed, variable, or mixed) for each of the three costs. Explain the reasoning behind your answers.
- Why is it important to identify how costs behave with changes in activity?
-
Account Analysis. Baker Advertising Incorporated would like to estimate costs associated with its clients on an annual basis. Assume costs for supplies and advertising staff are variable costs. The accounting records indicate the following costs were incurred last year for 100 clients:
Supplies $ 20,000 Advertising staff wages (hourly employees) $170,000 Manager salary $ 90,000 Building rent $ 56,000 Required:
- Use account analysis to estimate total fixed costs per year, and the variable cost per unit. State your results in the cost equation form Y = f + vX by filling in the dollar amounts for f and v.
- Estimate the total costs for this coming year assuming 120 clients will be served.
-
High-Low Method. Castanza Company produces computer printers. Management wants to estimate the cost of production equipment used to produce printers. The company reported the following monthly cost data related to production equipment:
Reporting Period (Month) Total Costs Machine Hours January $ 920,000 45,000 February 600,000 25,000 March 500,000 20,000 April 1,100,000 90,000 May 1,140,000 95,000 June 620,000 30,000 July 880,000 38,000 August 910,000 48,000 September 1,060,000 78,000 October 960,000 51,000 November 1,400,000 96,000 December 980,000 54,000 Required:
- Use the four steps of the high-low method to estimate total fixed costs per month and the variable cost per machine hour. State your results in the cost equation form Y = f + vX by filling in the dollar amounts for f and v.
- What would Castanza Company’s estimated costs be if it used 50,000 machine hours next month?
- What would Castanza Company’s estimated costs be if it used 15,000 machine hours next month? Why should you feel uncomfortable estimating costs for 15,000 machine hours?
-
Scattergraph Method. Castanza Company produces computer printers. Management wants to estimate the cost of production equipment used to produce printers. The company reported the following monthly cost data related to production equipment (this is the same data as the previous exercise):
Reporting Period (Month) Costs Machine Hours January $ 920,000 45,000 February 600,000 25,000 March 500,000 20,000 April 1,100,000 90,000 May 1,140,000 95,000 June 620,000 30,000 July 880,000 38,000 August 910,000 48,000 September 1,060,000 78,000 October 960,000 51,000 November 1,400,000 96,000 December 980,000 54,000 Required:
- Use the five steps of the scattergraph method to estimate total fixed costs per month and the variable cost per machine hour. State your results in the cost equation form Y = f + vX by filling in the dollar amounts for f and v.
- What would Castanza Company’s estimated costs be if it used 50,000 machine hours next month?
- What would Castanza Company’s estimated costs be if it used 15,000 machine hours next month?
-
Regression Analysis. Regression analysis was run for Castanza Company resulting in the following output (this is based on the same data as the previous two exercises):
Coefficients y-intercept 445,639 x variable 8.54 Required:
- Use the regression output given to develop the cost equation Y = f + vX by filling in the dollar amounts for f and v.
- What would Castanza Company’s estimated costs be if it used 50,000 machine hours next month?
- What would Castanza Company’s estimated costs be if it used 15,000 machine hours next month?
-
Contribution Margin Income Statement. Last month Kumar Production Company sold its product for $60 per unit. Fixed production costs were $40,000, and variable production costs amounted to $15 per unit. Fixed selling and administrative costs totaled $26,000, and variable selling and administrative costs amounted to $5 per unit. Kumar Production produced and sold 7,000 units last month.
Required:
- Prepare a traditional income statement for Kumar Production Company.
- Prepare a contribution margin income statement for Kumar Production Company.
- Why do companies use the contribution margin income statement format?
-
Regression Analysis Using Excel (Appendix). Walleye Company produces fishing reels. Management wants to estimate the cost of production equipment used to produce the reels. The company reported the following monthly cost data related to production equipment:
Reporting Period (Month) Total Costs Machine Hours January $1,104,000 54,000 February 720,000 30,000 March 600,000 24,000 April 1,320,000 108,000 May 1,368,000 114,000 June 744,000 36,000 July 1,056,000 45,600 August 1,092,000 57,600 September 1,272,000 93,600 October 1,152,000 61,200 November 1,680,000 115,200 December 1,176,000 64,800 Required:
- Use Excel to perform regression analysis. Provide a printout of the results.
- Use the regression output to develop the cost equation Y = f + vX by filling in the dollar amounts for f and v.
- What would Walleye Company’s estimated costs be if it used 90,000 machine hours this month?
Exercises: Set B
-
Identifying Cost Behavior. Ivanov, Inc., is trying to identify the cost behavior of the three costs shown. Cost information is provided for six months.
Cost 1 Cost 2 Cost 3 Month Units Produced Total Costs Cost per Unit Total Costs Cost per Unit Total Costs Cost per Unit 1 8,000 $10,000 _____ $24,000 _____ $32,000 _____ 2 10,000 10,000 _____ 29,000 _____ 40,000 _____ 3 12,000 10,000 _____ 33,600 _____ 48,000 _____ 4 14,000 10,000 _____ 36,400 _____ 56,000 _____ 5 16,000 10,000 _____ 38,400 _____ 64,000 _____ 6 18,000 10,000 _____ 39,600 _____ 72,000 _____ Required:
- Calculate the cost per unit, and then identify how the cost behaves (fixed, variable, or mixed) for each of the three costs. Explain the reasoning behind your answers.
- Why is it important to identify how costs behave with changes in activity?
-
Account Analysis. Swim-Safe Company hires several instructors who provide weekly one-hour private swim lessons to individuals. The company would like to estimate costs associated with its swim lessons on a weekly basis. Assume costs for towels, snacks, drinks, and instructor wages are variable costs. The accounting records indicate the following costs were incurred last week for 250 customer lessons:
Towels, snacks, drinks $1,250 Instructor wages (hourly employees) $3,000 Manager (owner) salary $1,500 Pool rental $2,000 Required:
- Use account analysis to estimate total fixed costs per week, and the variable cost per lesson. State your results in the cost equation form Y = f + vX by filling in the dollar amounts for f and v.
- Estimate the total costs for this coming week assuming 220 lessons will be provided.
-
High-Low Method Quality Tools. Quality Tools Incorporated would like to estimate costs associated with its sales personnel. Salespeople are paid a salary plus commission. Commission rates vary among products and are based on sales dollars. The company reported the following monthly cost data related to sales personnel:
Reporting Period (Month) Total Costs Sales Amount January $710,000 $13,800,000 February 695,000 13,600,000 March 765,000 15,100,000 April 650,000 12,000,000 May 775,000 15,500,000 June 750,000 14,700,000 July 715,000 14,500,000 August 680,000 13,100,000 September 830,000 16,500,000 October 815,000 16,000,000 November 800,000 15,600,000 December 690,000 13,200,000 Required:
- Use the four steps of the high-low method to estimate total fixed costs per month and the variable cost per sales dollar. State your results in the cost equation form Y = f + vX by filling in the dollar amounts for f and v.
- What would Quality Tools’ estimated costs be if it had sales of $12,500,000 next month?
- What would Quality Tools’ estimated costs be if it had sales of $20,000,000 next month? Why should you feel uncomfortable estimating costs for $20,000,000 in sales?
-
Scattergraph Method. Quality Tools Incorporated would like to estimate costs associated with its sales personnel. Salespeople are paid a salary plus commission. Commission rates vary among products and are based on sales dollars. The company reported the following monthly cost data related to sales personnel (this is the same data as the previous exercise):
Reporting Period (Month) Total Costs Sales Amount January $710,000 $13,800,000 February 695,000 13,600,000 March 765,000 15,100,000 April 650,000 12,000,000 May 775,000 15,500,000 June 750,000 14,700,000 July 715,000 14,500,000 August 680,000 13,100,000 September 830,000 16,500,000 October 815,000 16,000,000 November 800,000 15,600,000 December 690,000 13,200,000 Required:
- Use the five steps of the scattergraph method to estimate total fixed costs per month and the variable cost per sales dollar. State your results in the cost equation form Y = f + vX by filling in the dollar amounts for f and v.
- What would Quality Tools’ estimated costs be if it had sales of $12,500,000 next month?
- What would Quality Tools’ estimated costs be if it had sales of $20,000,000 next month?
-
Regression Analysis. Regression analysis was run for Quality Tools Incorporated resulting in the following output (this is based on the same data as the previous two exercises):
Coefficients y-intercept 129,188 x variable 0.04 Required:
- Use the regression output given to develop the cost equation Y = f + vX by filling in the dollar amounts for f and v.
- What would Quality Tools’ estimated costs be if it had sales of $12,500,000 next month?
- What would Quality Tools’ estimated costs be if it had sales of $20,000,000 next month?
-
Contribution Margin Income Statement, Service Company. Last month Seafood Grill had total sales of $200,000. Food preparation and service costs totaled $90,000 (20 percent fixed, 80 percent variable). Selling and administrative costs totaled $30,000 (70 percent fixed, 30 percent variable).
Required:
- Prepare a traditional income statement for Seafood Grill.
- Prepare a contribution margin income statement for Seafood Grill.
- Why do companies use the contribution margin income statement format?
-
Regression Analysis Using Excel (Appendix). Cain Company produces calculators. Management wants to estimate the cost of production equipment used to produce the calculators. The company reported the following monthly cost data related to production equipment:
Reporting Period (Month) Total Costs Machine Hours January $1,250,000 59,000 February 990,000 33,000 March 850,000 28,000 April 1,580,000 120,000 May 1,670,000 126,000 June 1,050,000 40,000 July 1,360,000 51,000 August 1,400,000 70,000 September 1,550,000 105,000 October 1,500,000 67,000 November 1,860,000 128,000 December 1,480,000 71,000 Required:
- Use Excel to perform regression analysis. Provide a printout of the results.
- Use the regression output to develop the cost equation Y = f + vX by filling in the dollar amounts for f and v.
- What would Cain Company’s estimated costs be if it used 110,000 machine hours this month?
Problems
-
Cost Behavior. Assume you are a consultant performing work for two different companies. Each company has asked you to help them identify the behavior of certain costs.
Required:
-
Identify each of the following costs for Hwang Company, a producer of ski boats, as variable (V), fixed (F), or mixed (M):
- _____Salary of production manager
- _____Materials required for production
- _____Monthly rent on factory building
- _____Hourly wages for assembly workers
- _____Straight-line depreciation for factory equipment
- _____Annual insurance on factory building
- _____Invoices sent to customers
- _____Salaries and commissions of salespeople
- _____Salary of chief executive officer
- _____Company cell phones with first 50 hours free, then 10 cents per minute
-
Identify each of the following costs for Rainier Camping Products, a maker of backpacks, as variable (V), fixed (F), or mixed (M):
- _____Hourly wages for assembly workers
- _____Fabric required for production
- _____Straight-line depreciation on factory building
- _____Salaries and commissions of salespeople
- _____Lease payments for factory equipment
- _____Company cell phones with first 80 hours free, then 8 cents per minute
- _____Invoices sent to customers
- _____Salary of production manager
- _____Salary of controller (accounting)
- _____Electricity for factory building
- How might the managers of these companies use the cost behavior information requested?
-
-
Account Analysis and Contribution Margin Income Statement. Madden Company would like to estimate costs associated with its production of football helmets on a monthly basis. The accounting records indicate the following production costs were incurred last month for 4,000 helmets.
Assembly workers’ labor (hourly) $70,000 Factory rent 3,000 Plant manager’s salary 5,000 Supplies 20,000 Factory insurance 12,000 Materials required for production 20,000 Maintenance of production equipment (based on usage) 18,000 Required:
- Use account analysis to estimate total fixed costs per month and the variable cost per unit. State your results in the cost equation form Y = f + vX by filling in the dollar amounts for f and v.
- Estimate total production costs assuming 5,000 helmets will be produced and sold.
- Prepare a contribution margin income statement assuming 5,000 helmets will be produced, and each helmet will be sold for $70. Fixed selling and administrative costs total $10,000. Variable selling and administrative costs are $8 per unit.
-
High-Low, Scattergraph, and Regression Analysis; Manufacturing Company. Woodworks, Inc., produces cabinet doors. Manufacturing overhead costs tend to fluctuate from one month to the next, and management would like to accurately estimate these costs for planning and decision-making purposes.
The accounting staff at Woodworks recommends that costs be broken down into fixed and variable components. Because the production process is highly automated, most of the manufacturing overhead costs are related to machinery and equipment. The accounting staff believes the best starting point is to review historical data for costs and machine hours:
Reporting Period (Month) Total Costs Machine Hours January $278,000 1,550 February 280,000 1,570 March 266,000 1,115 April 290,000 1,700 May 262,000 1,110 June 269,000 1,225 July 275,000 1,335 August 286,000 1,660 September 250,000 1,000 October 253,000 1,020 November 260,000 1,025 December 281,000 1,600 These data were entered into a computer regression program, which produced the following output:
Coefficients y-intercept 210,766 x variable 45.31 Required:
- Use the four steps of the high-low method to estimate total fixed costs per month and the variable cost per machine hour. State your results in the cost equation form Y = f + vX by filling in the dollar amounts for f and v.
- Use the five steps of the scattergraph method to estimate total fixed costs per month, and the variable cost per machine hour. State your results in the cost equation form Y = f + vX by filling in the dollar amounts for f and v.
- Use the regression output given to develop the cost equation Y = f + vX by filling in the dollar amounts for f and v.
- Use the results of the high-low method (a), scattergraph method (b), and regression analysis (c), to estimate costs for 1,500 machine hours. (You will have three different answers—one for each method.) Which approach do you think is most accurate and why?
- Management likes the regression analysis approach and asks you to estimate costs for 5,000 machine hours using this approach (the company plans to expand by opening another facility and hiring additional employees). Calculate your estimate, and explain why your estimate might be misleading.
-
High-Low, Scattergraph, and Regression Analysis; Service Company. Sanchez Accounting Company prepares tax returns for individuals. Marie Sanchez, the owner, would like an accurate estimate of the company’s costs for planning and decision-making purposes. When Marie asks you to devise a way to estimate costs on a monthly basis, you recall the importance of breaking costs into fixed and variable components. Because the company’s costs are driven primarily by the number of tax returns prepared, you decide to use historical data for costs and tax returns prepared:
Reporting Period (Month) Total Costs Returns Prepared January $157,000 315 February 145,000 300 March 167,500 375 April 163,000 325 May 120,000 250 June 112,000 210 July 138,000 280 August 100,000 190 September 108,000 205 October 115,000 245 November 136,000 265 December 126,000 255 You enter these data into a computer regression program and get the following results:
Coefficients y-intercept 24,626 x variable 401.86 Required:
- Use the four steps of the high-low method to estimate total fixed costs per month and the variable cost per tax return prepared. State your results in the cost equation form Y = f + vX by filling in the dollar amounts for f and v.
- Use the five steps of the scattergraph method to estimate total fixed costs per month and the variable cost per tax return prepared. State your results in the cost equation form Y = f + vX by filling in the dollar amounts for f and v.
- Use the regression output given to develop the cost equation Y = f + vX by filling in the dollar amounts for f and v.
- Use the results of the high-low method (a), scattergraph method (b), and regression analysis (c) to estimate costs for 290 tax returns. (You will have three different answers—one for each method.) Which approach do you think is most accurate, and why?
- Marie likes the regression analysis approach and asks you to estimate costs for 800 tax returns using this approach (she plans to expand by opening another office and hiring additional employees). Calculate your estimate, and explain why your estimate might be misleading.
-
High-Low, Scattergraph, Regression Analysis, and Contribution Margin Income Statement. Eye Care, Inc., provides vision correction surgery for its patients. You are the accountant for Eye Care, and management has asked you to devise a way of accurately estimating company costs for planning and decision-making purposes. You believe that reviewing historical data for costs and number of surgeries is the best starting point. These data are as follows:
Reporting Period (Month) Total Costs Number of Surgeries January $208,000 54 February 205,000 52 March 217,000 55 April 200,000 50 May 232,000 62 June 230,000 60 July 226,000 57 August 235,000 63 September 252,000 71 October 250,000 70 November 245,000 66 December 244,000 65 You enter these data into a computer regression program and get the following results:
Coefficients y-intercept 75,403 x variable 2,536.77 Required:
- Use the four steps of the high-low method to estimate total fixed costs per month, and the variable cost per surgery. State your results in the cost equation form Y = f + vX by filling in the dollar amounts for f and v.
- Use the five steps of the scattergraph method to estimate total fixed costs per month, and the variable cost per surgery. State your results in the cost equation form Y = f + vX by filling in the dollar amounts for f and v.
- Use the regression output given to develop the cost equation Y = f + vX by filling in the dollar amounts for f and v.
- Use the results of the high-low method (a), scattergraph method (b), and regression analysis (c), to estimate costs for 70 surgeries. (You will have three different answers—one for each method.) Which approach do you think is most accurate and why?
- Assume Eye Care charges $4,000 for each surgery performed. Use the regression analysis cost information (for 70 surgeries) to prepare a contribution margin income statement. (Hint: You will only have one line item for variable costs and one line item for fixed costs.)
-
Regression Analysis Using Excel (Appendix). Metal Products, Inc., produces metal storage sheds. The company’s manufacturing overhead costs tend to fluctuate from one month to the next, and management would like an accurate estimate of these costs for planning and decision-making purposes.
The company’s accounting staff recommends that costs be broken down into fixed and variable components. Because the production process is highly automated, most of the manufacturing overhead costs are related to machinery and equipment. The accounting staff agrees that reviewing historical data for costs and machine hours is the best starting point. Data for the past 18 months follow.
Reporting Period (Month) Total Overhead Costs Total Machine Hours January $695,000 3,875 February 700,000 3,925 March 665,000 2,788 April 725,000 4,250 May 655,000 2,775 June 672,500 3,063 July 687,500 3,338 August 715,000 4,150 September 625,000 2,500 October 632,500 2,550 November 650,000 2,563 December 702,500 4,000 January 730,000 4,025 February 735,000 4,088 March 697,500 2,900 April 762,500 4,425 May 687,500 2,888 June 705,000 3,188 Required:
- Use Excel to perform regression analysis. Provide a printout of the results.
- Use the regression output given to develop the cost equation Y = f + vX by filling in the dollar amounts for f and v.
- Use the results of the regression analysis to estimate costs for 3,750 machine hours.
- Management is considering plans to expand by opening several new facilities and asks you to estimate costs for 22,000 machine hours. Calculate your estimate, and explain why this estimate may be misleading.
- What can be done to improve the estimate made in part d?
One Step Further: Skill-Building Cases
-
Internet Project: Variable and Fixed Costs. Using the Internet, find the annual report of one retail company and one manufacturing company. Print out each company’s income statement. (Hint: The income statement is often called the statement of operations or statement of earnings.)
Required:
- Review each income statement, and provide an analysis of which operating costs are likely to be variable and which are likely to be fixed. Include copies of both income statements when submitting your answer.
- How would you expect a retail company’s mix of variable and fixed operating costs to differ from that of a manufacturing company?
- How might the managers of these companies use cost behavior information?
-
Group Activity: Identifying Variable and Fixed Costs. To complete the following requirements, form groups of two to four students.
Required:
- Each group should select a product that is easy to manufacture.
- Prepare a list of materials, labor, and other resources needed to make the product.
- Using the list prepared in requirement b, identify whether the costs associated with each item are variable, fixed, or mixed.
- As a manager for this company, why would you want to know whether costs are variable, fixed, or mixed?
-
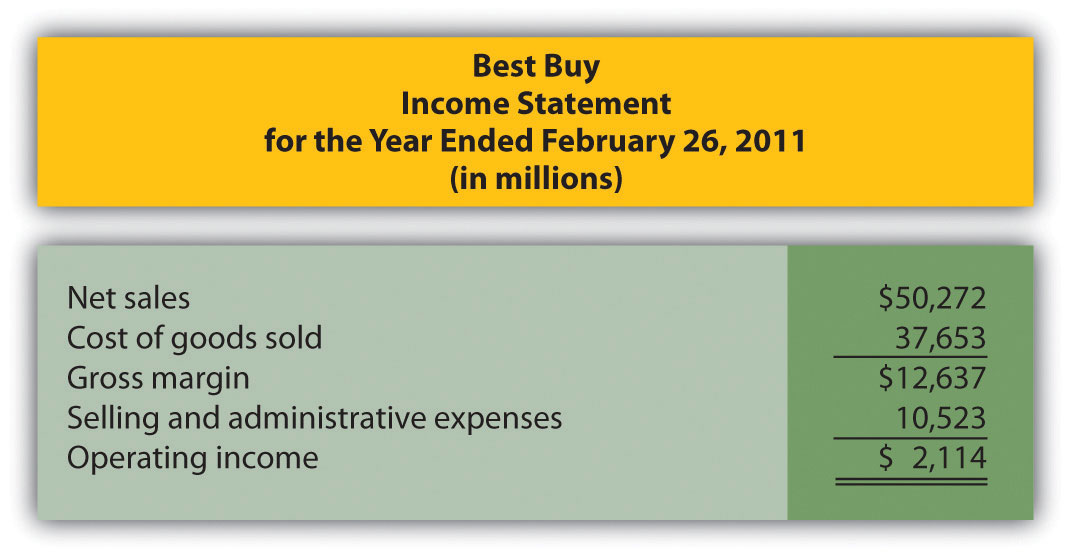
Cost Behavior at Best Buy. The following condensed income statement is for Best Buy Co., Inc., a large retailer of consumer electronics.
Required:
Assume that cost of goods sold comprises only variable costs, and selling and administrative expenses are all fixed costs. Also assume that Best Buy expects sales to grow by 10 percent for the year ended March 3, 2012.
- Calculate expected operating income for the year ended March 3, 2012 assuming the company is still within the relevant range of activity.
- Calculate the expected percent increase in operating income from the year ended February 26, 2011, to the year ended March 3, 2012.
- Why is the percent increase in operating income higher than the percent increase in sales?
- Is the assumption that all selling and administrative expenses are fixed a reasonable assumption? Explain.
-
Fixed Costs at United Airlines. Review Note 5.4 "Business in Action 5.1".
Required:
- What is meant by the term fixed cost?
- Which costs at United Airlines were identified as fixed costs?
- How might United Airlines reduce its fixed costs? Be specific.
Comprehensive Case
-
Ethics: Manipulating Data to Establish a Budget (Appendix). Healthy Bar, Inc., produces energy bars for sports enthusiasts. The company’s fiscal year ends on December 31. The production manager, Jim Wallace, is establishing a cost budget for the production department for each month of this coming quarter (January through March). At the end of March, Jim will be evaluated based on his ability to meet the budget for the three months ending March 31. In fact, Jim will receive a significant bonus if actual costs are below budgeted costs for the quarter.
The production budget is typically established based on data from the last 18 months. These data are as follows:
Reporting Period (Month) Total Overhead Costs Total Machine Hours July $695,000 3,410 August 700,000 3,454 September 665,000 2,453 October 725,000 3,740 November 655,000 2,442 December 672,500 2,695 January 687,500 2,937 February 715,000 3,652 March 625,000 2,200 April 632,500 2,244 May 650,000 2,255 June 702,500 3,520 July 730,000 3,542 August 735,000 3,597 September 697,500 2,552 October 762,500 3,894 November 687,500 2,541 December 705,000 2,805 You are the accountant who assists Jim in preparing an estimate of production costs for the next three months. You intend to use regression analysis to estimate costs, as was done in the past. Jim expects that 3,100 machine hours will be used in January, 3,650 machine hours in February, and 2,850 machine hours in March.
Jim approaches you and asks that you add $100,000 to production costs for each of the past 18 months before running the regression analysis. As he puts it, “After all, management always takes my proposed budgets and reduces them by about 10 percent. This is my way of leveling the playing field!”
Required:
-
Use Excel to perform regression analysis using the historical data provided.
- Submit a printout of the results.
- Use the regression output to develop the cost equation Y = f + vX by filling in the dollar amounts for f and v.
- Calculate estimated production costs for January, February, and March. Also provide a total for the three months.
-
Use Excel to perform regression analysis after adding $100,000 to production costs for each of the past 18 months, as Jim requested.
- Submit a printout of the results.
- Use the regression output to develop the cost equation Y = f + vX by filling in the dollar amounts for f and v.
- Calculate estimated production costs for January, February, and March. Also provide a total for the three months.
- Why did Jim ask you to add $100,000 to production costs for each of the past 18 months?
- How should you handle Jim’s request? (If necessary, review the presentation of ethics in Chapter 1 "What Is Managerial Accounting?" for additional information.)
-