This is “Income Statements for Manufacturing Companies”, section 1.8 from the book Accounting for Managers (v. 1.0). For details on it (including licensing), click here.
For more information on the source of this book, or why it is available for free, please see the project's home page. You can browse or download additional books there. To download a .zip file containing this book to use offline, simply click here.
1.8 Income Statements for Manufacturing Companies
Learning Objective
- Describe how to prepare an income statement for a manufacturing company.
Question: Companies that provide services, such as Ernst & Young (accounting) and Accenture LLP (consulting), do not sell goods and therefore have no inventory. The accounting process and income statement for service companies are relatively simple. Merchandising companies (also called retail companies) like Macy’s and Home Depot buy and sell goods but typically do not manufacture goods. Since merchandising companies must account for the purchase and sale of goods, their accounting systems are more complex than those of service companies. Manufacturing companies, such as Johnson & Johnson and Honda Motor Company, produce and sell goods. Such companies require an accounting system that goes well beyond accounting solely for the purchase and sale of goods. Why are accounting systems more complex for manufacturing companies?
Answer: Accounting systems are more complex for manufacturing companies because they need a system that tracks manufacturing costs throughout the production process to the point at which goods are sold. Since income statements for manufacturing companies tend to be more complex than for service or merchandising companies, we devote this section to income statements for manufacturing companies. Understanding income statements in a manufacturing setting begins with the inventory cost flow equation.
Inventory Cost Flow Equation
Question: How do companies use the cost flow equation to calculate unknown balances?
Answer: We can use the basic cost flow equation to calculate unknown balances for just about any balance sheet account (e.g., cash, accounts receivable, and inventory). The equation is as follows:
Key Equation
Beginning balance (BB) + Transfers in (TI) – Ending balance (EB) = Transfers out (TO)We will apply this equation to the three inventory asset accounts discussed earlier (raw materials, work in process, and finished goods) to calculate the cost of raw materials used in production, cost of goods manufactured, and cost of goods sold.
Raw materials used in production shows the cost of direct and indirect materials placed into the production process. Cost of goods manufactured represents the cost of goods completed and transferred out of work-in-process (WIP) inventory into finished goods inventory. Cost of goods sold represents the cost of goods that are sold and transferred out of finished goods inventory into cost of goods sold.
Accountants need all these amounts—raw materials placed in production, cost of goods manufactured, and cost of goods sold—to prepare an income statement for a manufacturing company. We describe how to calculate these amounts using three formal schedules in the following order:
- Schedule of raw materials placed in production
- Schedule of cost of goods manufactured
- Schedule of cost of goods sold
Question: The basic cost flow equation can be used in three supporting schedules to help us determine the cost of goods sold amount on the income statement for manufacturing companies. What information is included in these schedules, and what do they look like for Custom Furniture Company?
Answer: Figure 1.7 "Income Statement Schedules for Custom Furniture Company" shows these three schedules for Custom Furniture Company for the month of May. As you review these schedules, note that each schedule provides information required for the next schedule, as indicated by the arrows. Remember the inventory cost flow equation is used for each schedule. This is why you see abbreviations for each element of the equation: beginning balance (BB), transfers in (TI), ending balance (EB), and transfers out (TO).
The goal of going through the process shown in Figure 1.7 "Income Statement Schedules for Custom Furniture Company" is to arrive at a cost of goods sold amount, which is presented on the income statement. Custom Furniture Company’s income statement for the month ended May 31 is shown in Figure 1.8 "Income Statement for Custom Furniture Company". As you review Figure 1.7 "Income Statement Schedules for Custom Furniture Company" and Figure 1.8 "Income Statement for Custom Furniture Company", look back at Figure 1.6 "Flow of Product Costs through Balance Sheet and Income Statement Accounts" to see how costs flow through the three inventory accounts and the cost of goods sold account.
In Chapter 2 "How Is Job Costing Used to Track Production Costs?", we provide the detailed information necessary to prepare the schedules and income statement presented in Figure 1.7 "Income Statement Schedules for Custom Furniture Company" and Figure 1.8 "Income Statement for Custom Furniture Company". At this point, your job is to understand how we use the inventory cost flow equation to calculate raw materials placed in production, cost of goods manufactured, and cost of goods sold. (Note: Companies using a perpetual inventory system do not necessarily prepare these formal schedules because perpetual systems update records immediately when inventory is transferred from one inventory account to another. However, these companies take a physical count periodically to ensure the accuracy of inventory accounts and use the cost flow equation and similar schedules to ensure their perpetual system balances are accurate. Note 1.62 "Business in Action 1.8" shows how the cost flow equation can be used to analyze the effects of fraud that was allegedly committed at Rite Aid.)
Figure 1.7 Income Statement Schedules for Custom Furniture Company
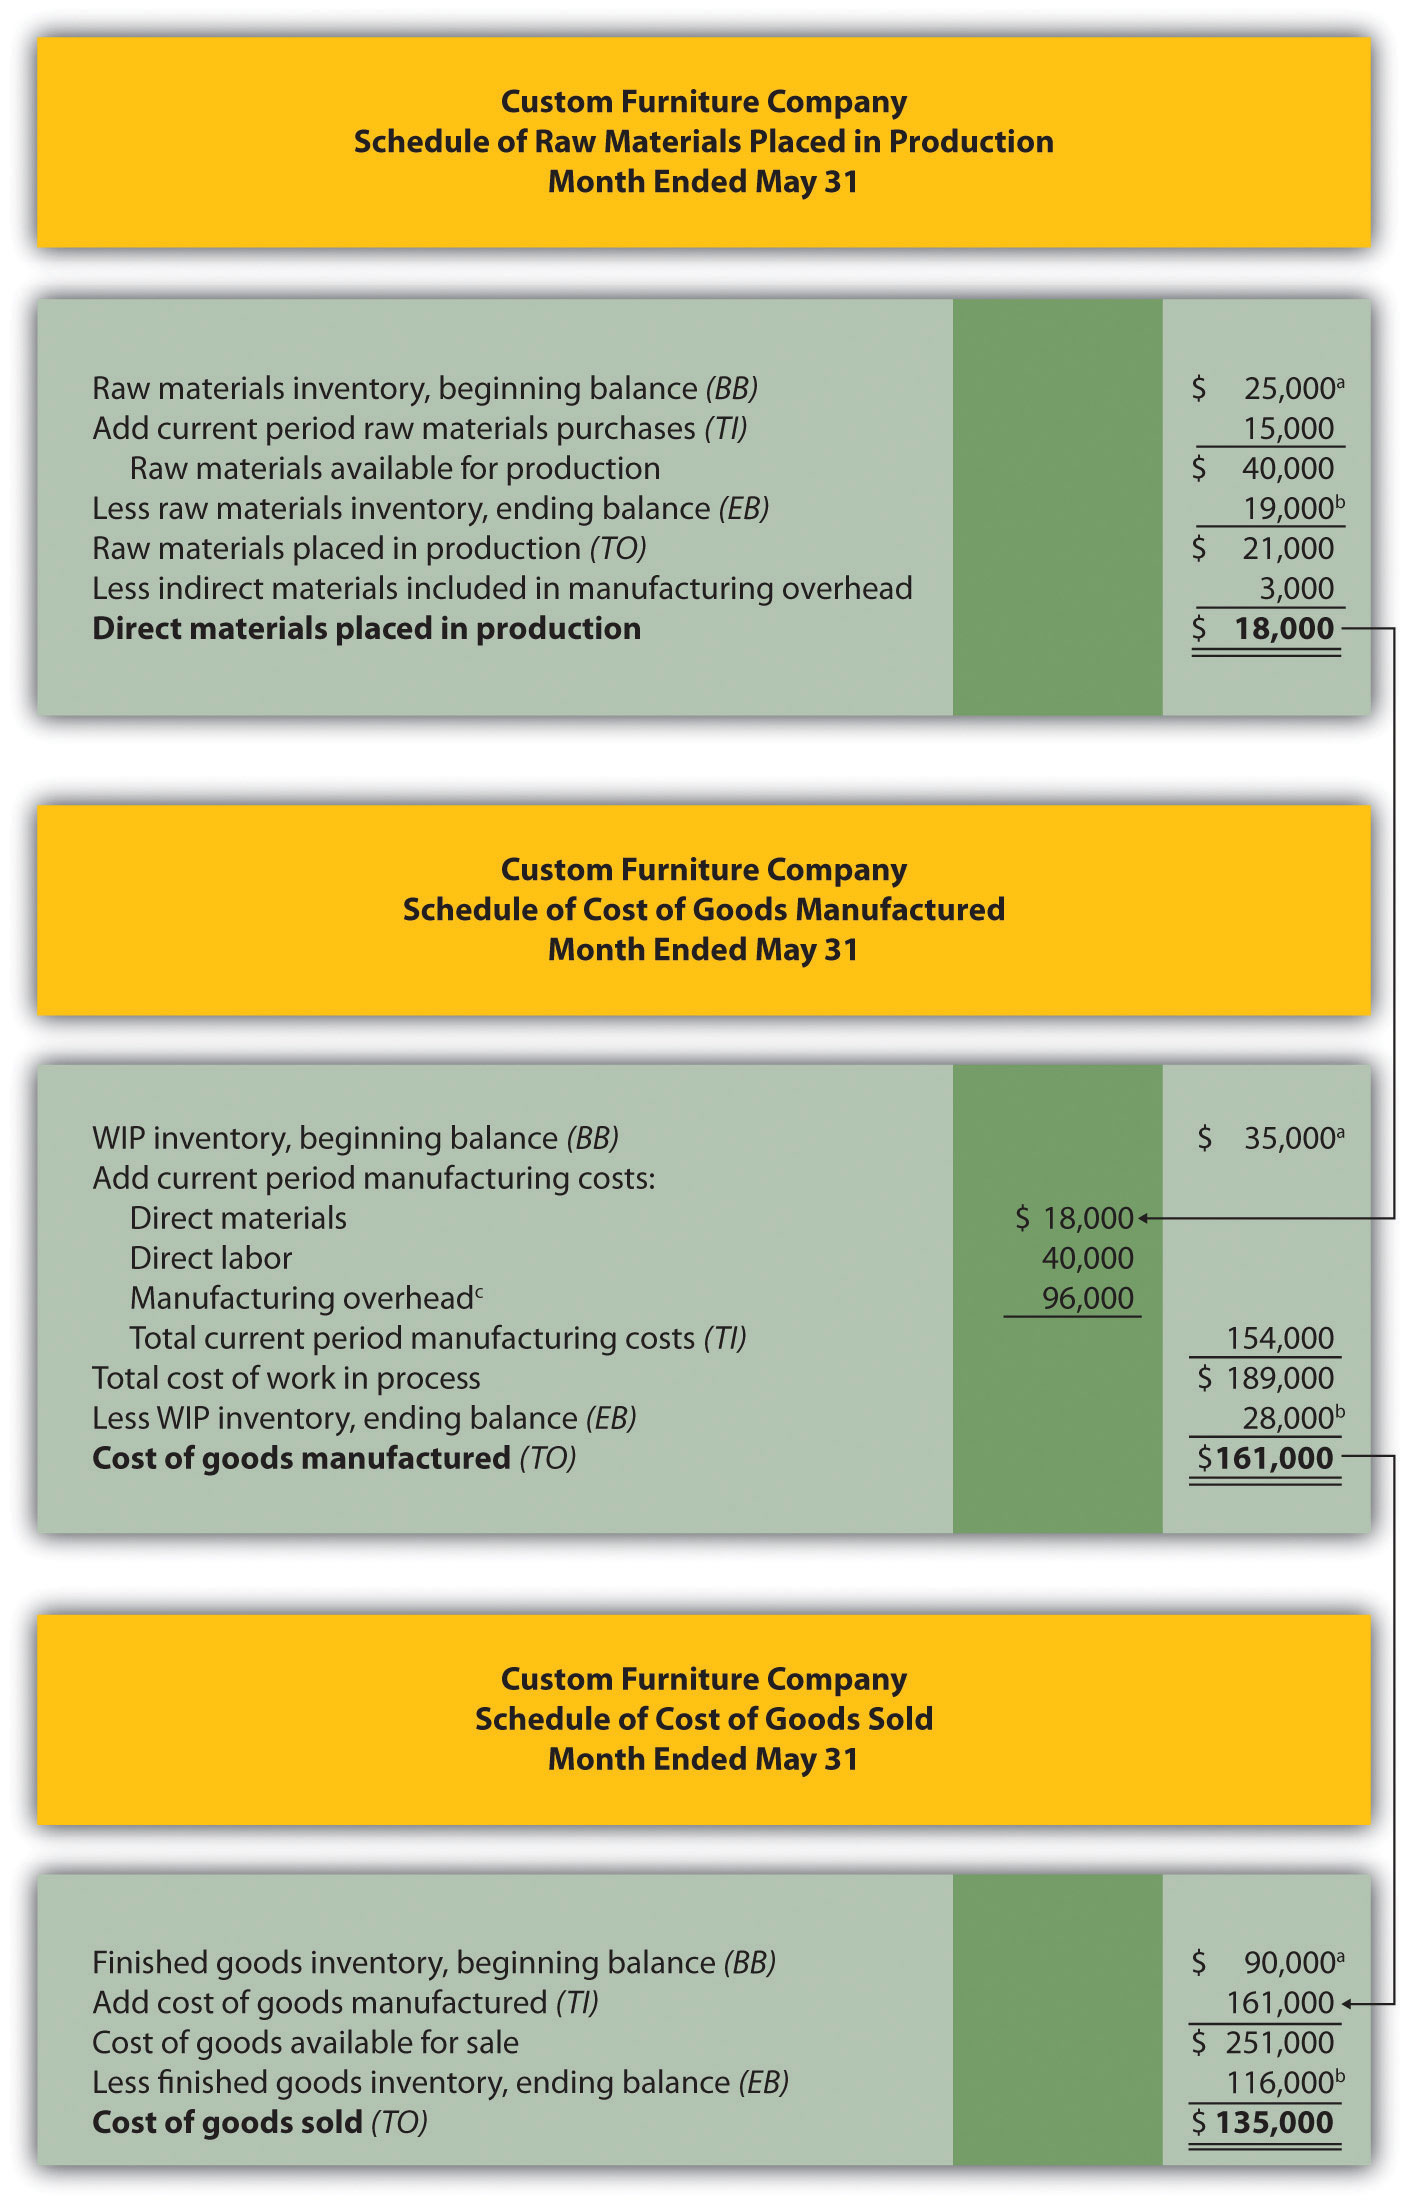
a From the company’s balance sheet at April 30 (April 30 ending balance is the same as May 1 beginning balance).
b From the company’s balance sheet at May 31.
c This is actual manufacturing overhead for the period and includes indirect materials, indirect labor, factory rent, factory utilities, and other factory-related expenses for the month. In Chapter 2 "How Is Job Costing Used to Track Production Costs?", we look at an alternative approach to recording manufacturing overhead called normal costing.
Figure 1.8 Income Statement for Custom Furniture Company
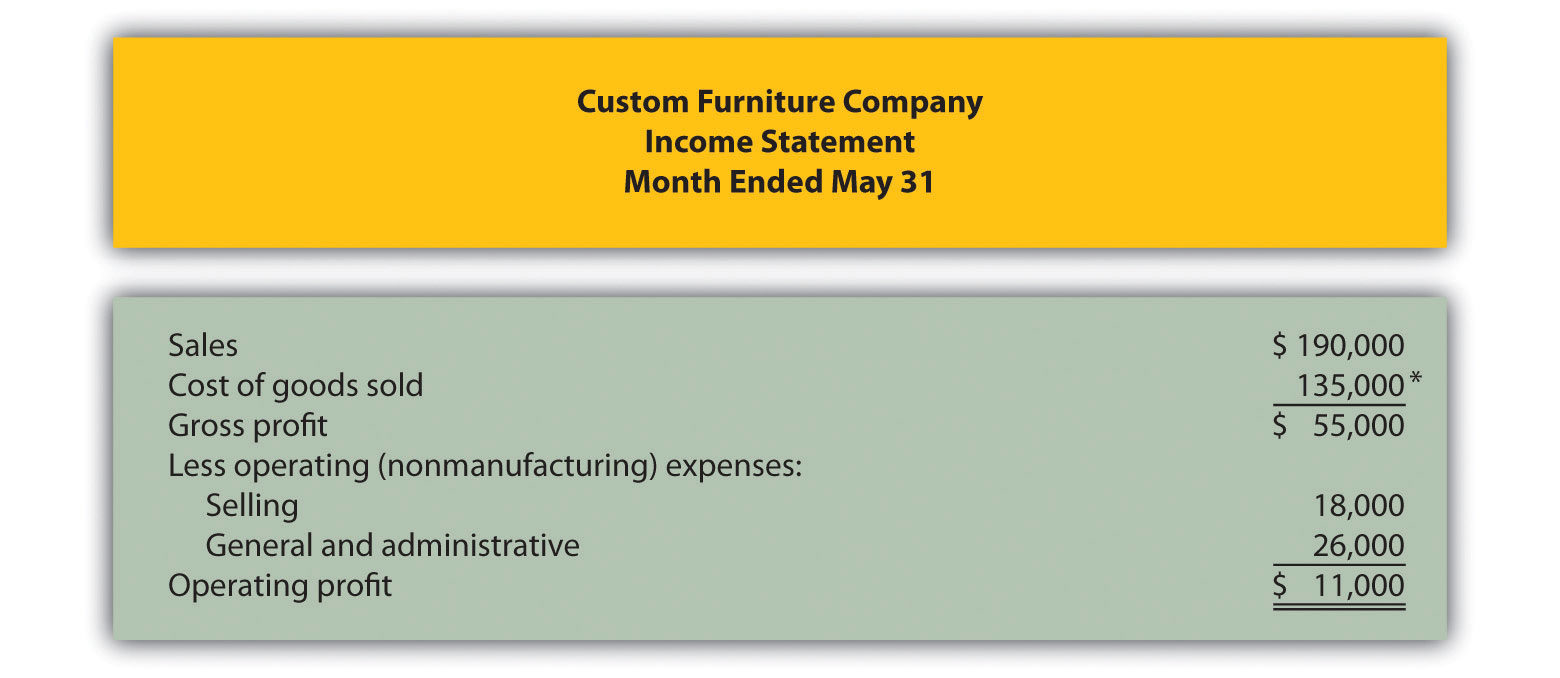
*$135,000 comes from the schedule of cost of goods sold in Figure 1.7 "Income Statement Schedules for Custom Furniture Company".
Business in Action 1.8
Using the Cost Flow Equation to Analyze Fraud
Rite Aid Corporation operates 3,400 drug stores in the United States. In 2002, the Securities and Exchange Commission (SEC) filed accounting fraud charges against several former executives of Rite Aid. The SEC complaint alleged that Rite Aid had significantly overstated income for several years.
According to the complaint, Rite Aid executives committed financial fraud in several areas, one of which involved inventory. At the end of the company’s fiscal year, the physical inventory count showed $9,000,000 less than Rite Aid’s inventory balance on the books, presumably due to physical deterioration of the goods or theft. Rite Aid executives allegedly failed to record this shrinkage, thereby overstating ending inventory on the balance sheet and understating cost of goods sold on the income statement.
Using the cost flow equation, you can see how failing to record the $9,000,000 loss would understate cost of goods sold.
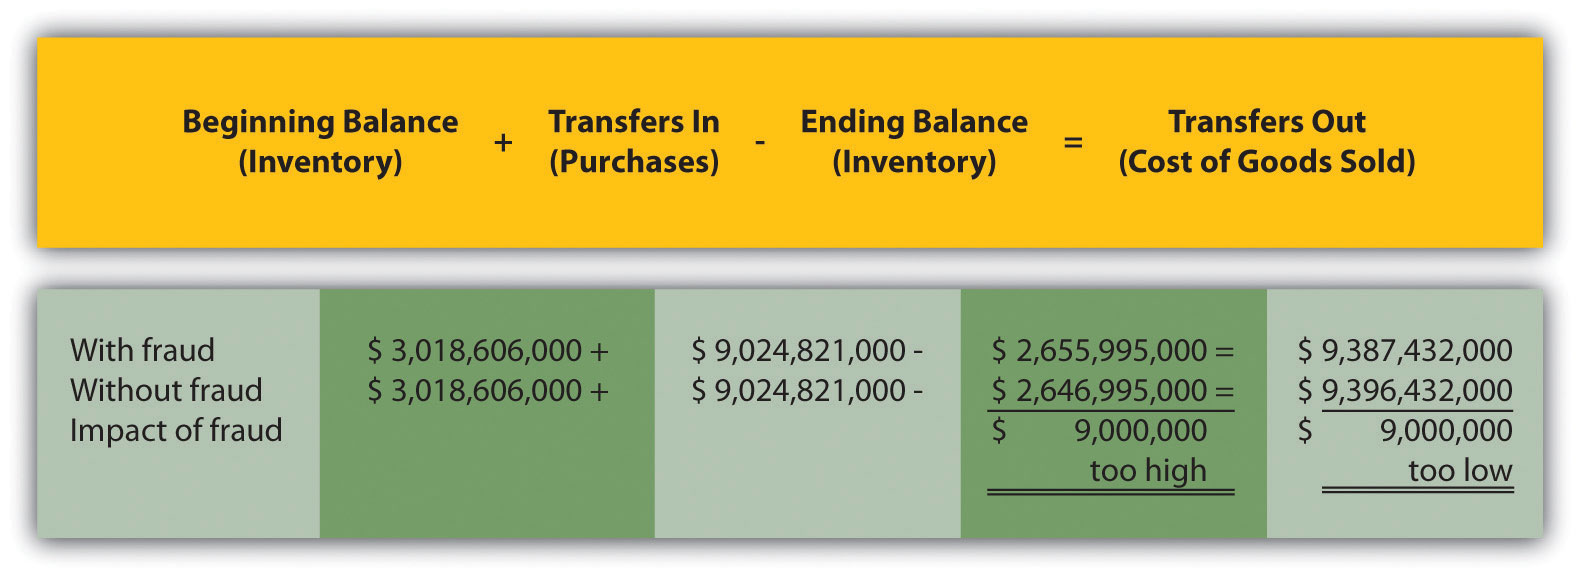
By failing to record the inventory loss, Rite Aid overstated inventory (an asset) on the balance sheet by $9,000,000 and understated cost of goods sold (an expense) by $9,000,000 on the income statement. This ultimately increased profit by $9,000,000 because reported expenses were too low.
This inventory fraud was a relatively small part of the fraud allegedly committed by Rite Aid executives. In fact, Rite Aid’s net income was restated downward by $1,600,000,000 in 2002. Several former executives pled guilty to conspiracy charges. The former chief executive, Martin Grass, was sentenced to eight years in prison and the former chief financial officer, Franklyn Bergonzi, was sentenced to 28 months in prison. Rite Aid’s stock fell from a high of $50 per share to $5 per share in 2003.
Sources: Securities and Exchange Commission, “Release 2002–92,” news release, http://www.sec.gov; AP wires dated July 10, 2003, and May 27, 2004.
Manufacturing Versus Merchandising Income Statements
Question: Manufacturing companies clearly have more complex accounting systems to account for all the costs involved in producing products. However, the income statement for a manufacturing company is not all that much different than the income statement for a merchandising company. What are primary differences between manufacturing and merchandising company income statements?
Answer: The primary differences are as follows:
- Merchandising companies do not calculate the raw materials placed in production or cost of goods manufactured (shown in the top section of Figure 1.7 "Income Statement Schedules for Custom Furniture Company").
- Merchandisers purchase goods from suppliers instead of manufacturing goods. The cost of these purchases from suppliers is often called net purchases in the income statement, in contrast to cost of goods manufactured in a manufacturer’s income statement. The net purchases line consists of purchases, purchases returns and allowances, purchases discounts, and freight in.
- Merchandisers do not use the schedule of cost of goods manufactured (and related schedule of raw materials placed in production).
- Merchandisers use an account called merchandise inventory, or simply inventory, instead of finished goods inventory. This reflects that merchandisers do not produce goods.
Table 1.5 "Income Statement Terminology in Manufacturing and Merchandising Companies" summarizes the differences in income statement terminology between manufacturing companies and merchandising companies.
Table 1.5 Income Statement Terminology in Manufacturing and Merchandising Companies
| The following terms are used by manufacturing and merchandising companies: sales, cost of goods available for sale, cost of goods sold, operating expenses, selling, general and administrative, and operating profit. | |
| Finished goods inventory is used by manufacturing companies. | Merchandise inventory is used by merchandising companies. |
| Cost of goods manufactured is used by manufacturing companies. | Net purchases is used by merchandising companies. |
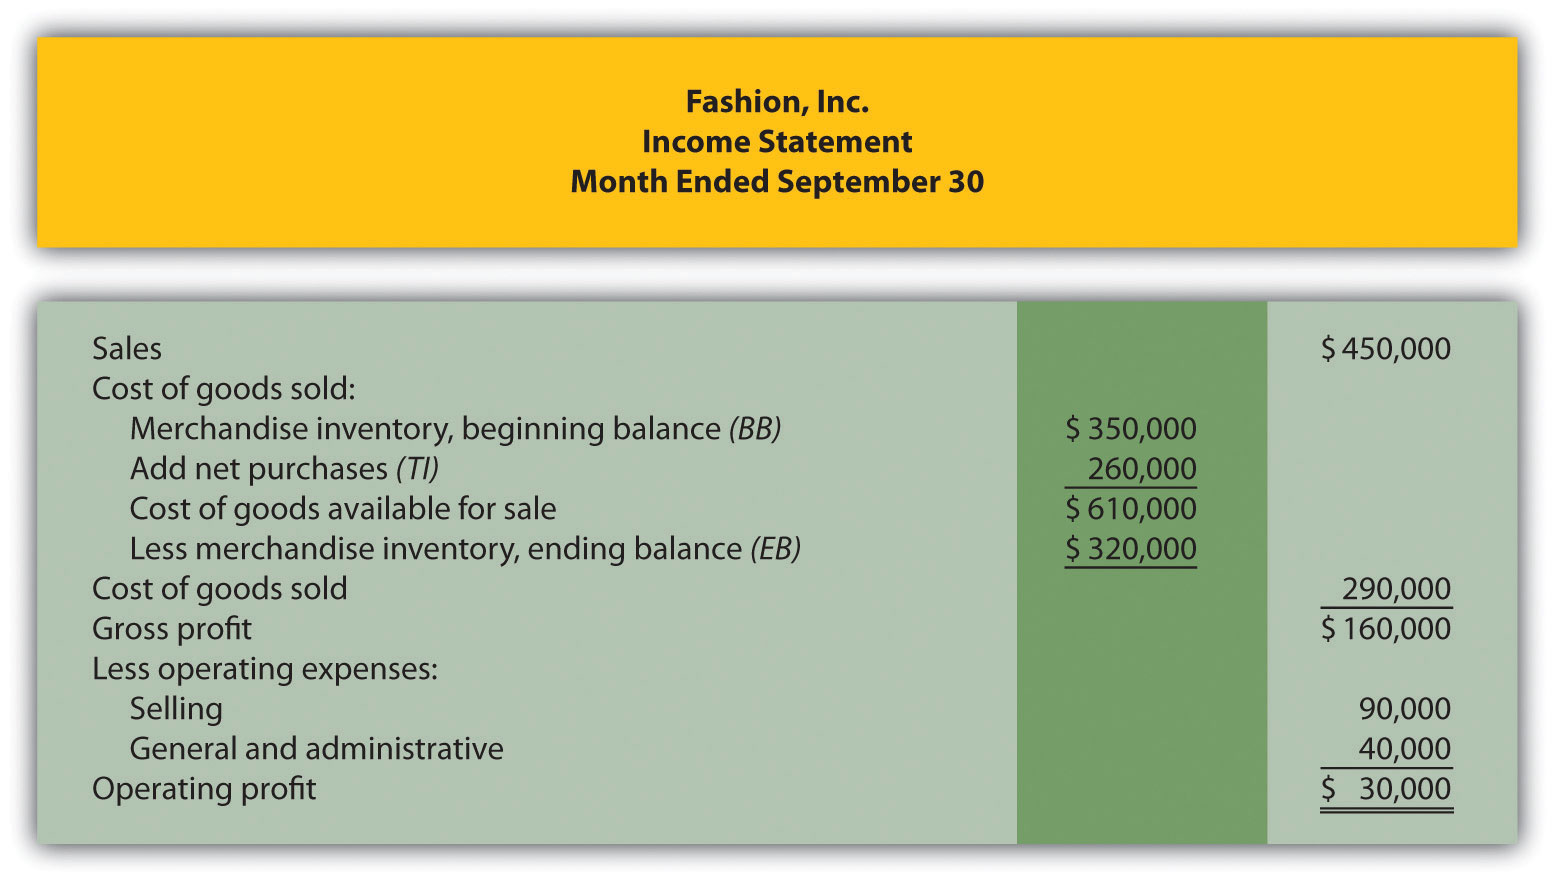
Figure 1.9 "Merchandising Company Income Statement for Fashion, Inc." presents an income statement for Fashion, Inc., a retail company that sells clothing. Notice that the schedule of cost of goods manufactured (and related schedule of raw materials placed in production) is not needed for merchandising companies, and the terms merchandise inventory and net purchases are used instead of finished goods inventory and cost of goods manufactured. Also, the schedule of cost of goods sold is simply included in the income statement. Many companies prefer this approach because it means they do not have to prepare a separate schedule.
Figure 1.9 Merchandising Company Income Statement for Fashion, Inc.
Key Takeaways
-
Three schedules are necessary to prepare an income statement for a manufacturing company, in the following order:
- Schedule of raw materials placed in production, which shows cost of direct materials added to work-in-process inventory and cost of indirect materials added to manufacturing overhead
- Schedule of cost of goods manufactured, which shows cost of goods completed and transferred out of work-in-process inventory into finished goods inventory
- Schedule of cost of goods sold, which shows cost of goods sold and transferred out of finished goods inventory into cost of goods sold
- The income statements of merchandising companies differ from those of manufacturing companies in several areas. Merchandising companies do not use a schedule of raw materials placed in production or a schedule of cost of goods manufactured, and they use a merchandise inventory account instead of a finished goods inventory account. In addition, they use the term net purchases instead of cost of goods manufactured and often include the schedule of cost of goods sold in the income statement rather than presenting it separately.
Review Problem 1.8
Fine Cabinets, Inc., produces custom cabinets. The following inventory balances appeared on its balance sheet. (Note that the most current financial information is presented in the first column.)
| December 31, 2012 | December 31, 2011 | |
| Raw materials inventory | $ 8,000 | $ 10,000 |
| Work-in-process inventory | 600,000 | 550,000 |
| Finished goods inventory | 350,000 | 410,000 |
Fine Cabinets had $1,265,000 in sales for the year ended December 31, 2012. The company also had the following costs for the year:
| Selling | $ 90,000 |
| General and administrative | $240,000 |
| Raw materials purchases | $100,000 |
| Direct labor used in production | $125,000 |
| Manufacturing overhead | $630,000 |
Of the total raw materials placed in production for the year, $12,000 was for indirect materials and must be deducted to find direct materials placed in production.
Required:
-
Prepare the schedules listed in the following for the year ended December 31, 2012. Use the format shown in Figure 1.7 "Income Statement Schedules for Custom Furniture Company". (Note that Figure 1.7 "Income Statement Schedules for Custom Furniture Company" shows information for a month and this review problem presents information for a year.)
- Schedule of raw materials placed in production
- Schedule of cost of goods manufactured
- Schedule of cost of goods sold
- Prepare an income statement for the year ended December 31, 2012. Use the format shown in Figure 1.8 "Income Statement for Custom Furniture Company".
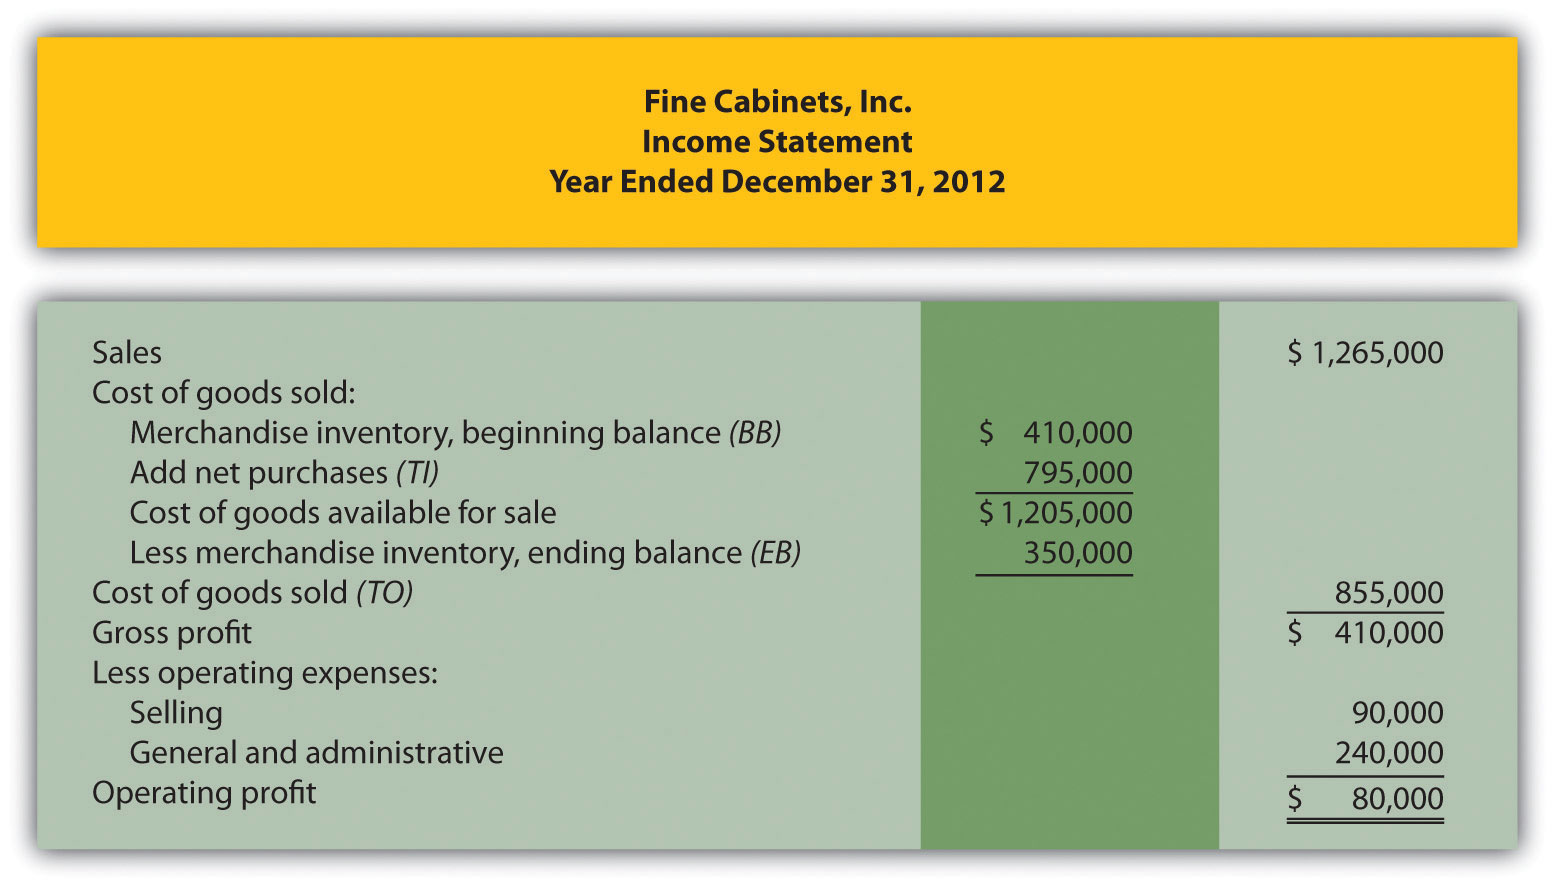
- Assume Fine Cabinets, Inc., is a merchandising company that purchases its cabinets from a manufacturer. Use the information from the schedule of cost of goods sold prepared in requirement 1 and the income statement prepared in requirement 2 to prepare an income statement. Use the format shown in Figure 1.9 "Merchandising Company Income Statement for Fashion, Inc.".
Solution to Review Problem 1.8
-
-
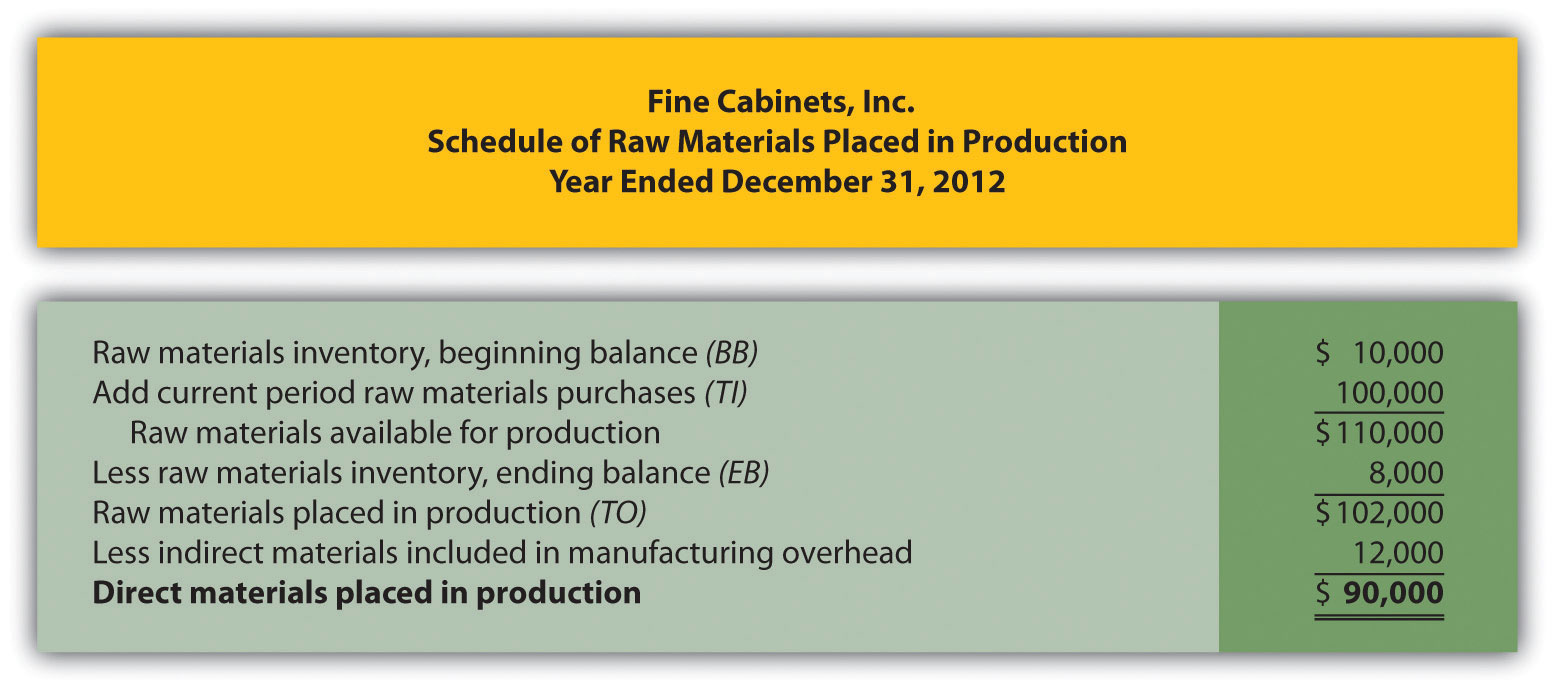
-
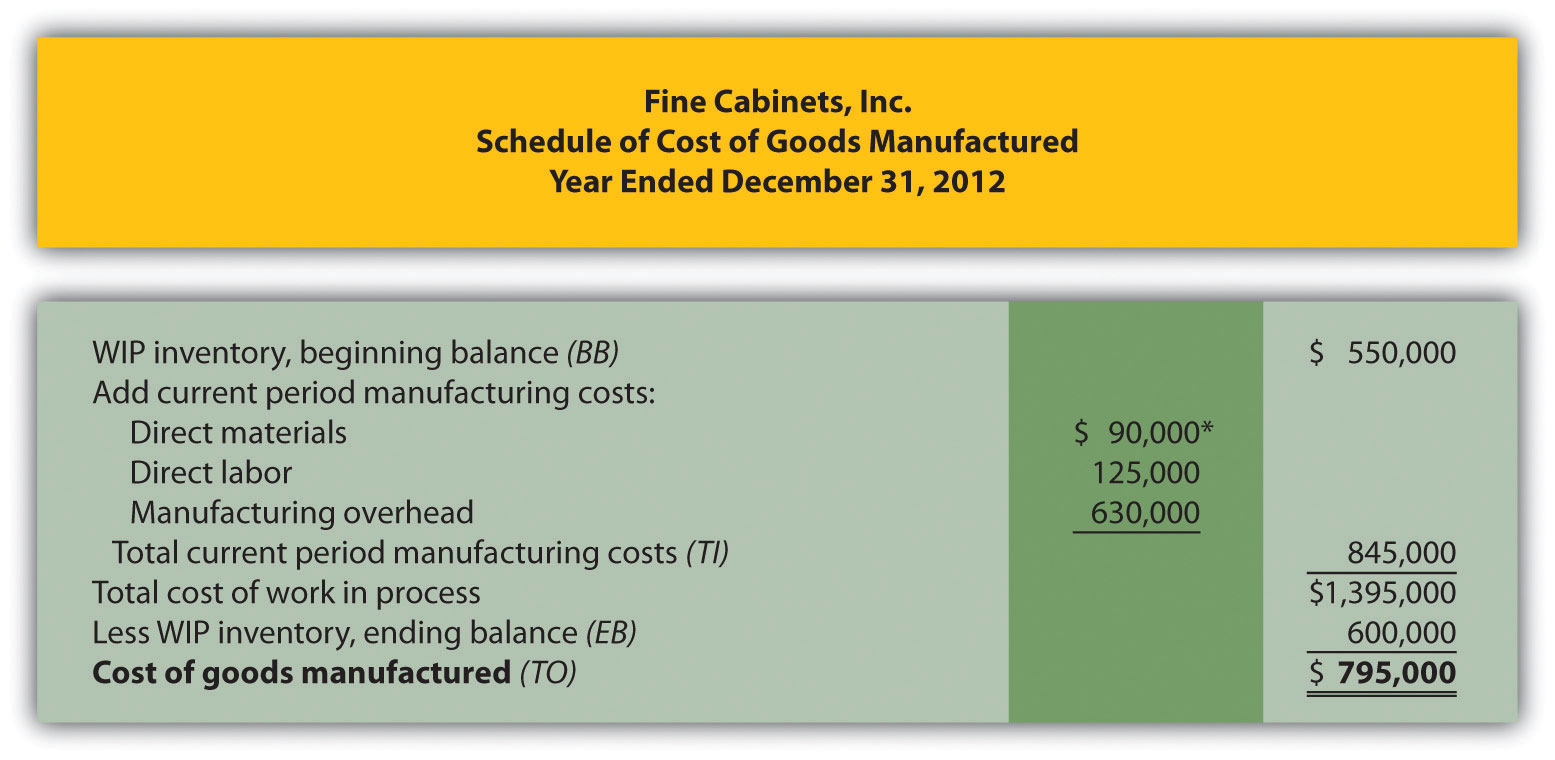
*$90,000 comes from the direct materials placed in production in part 1a.
-
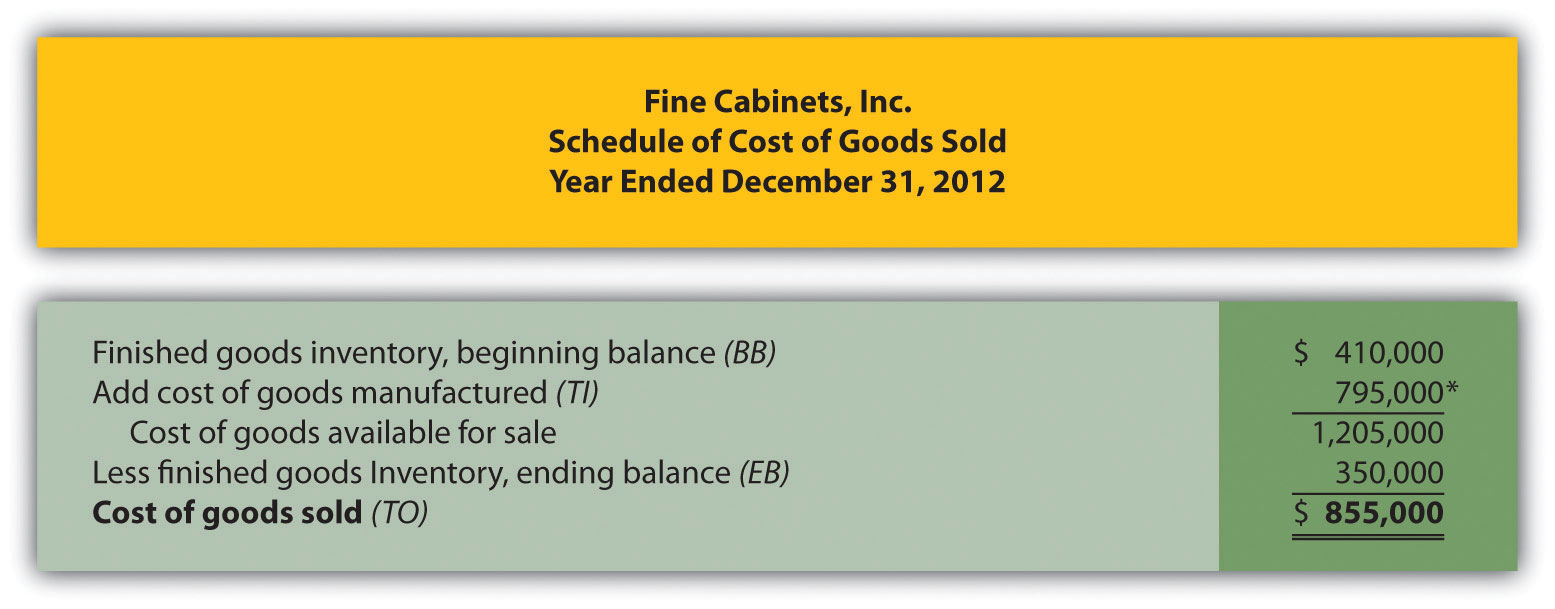
*$795,000 comes from the cost of goods manufactured (TO) in part 1b.
-
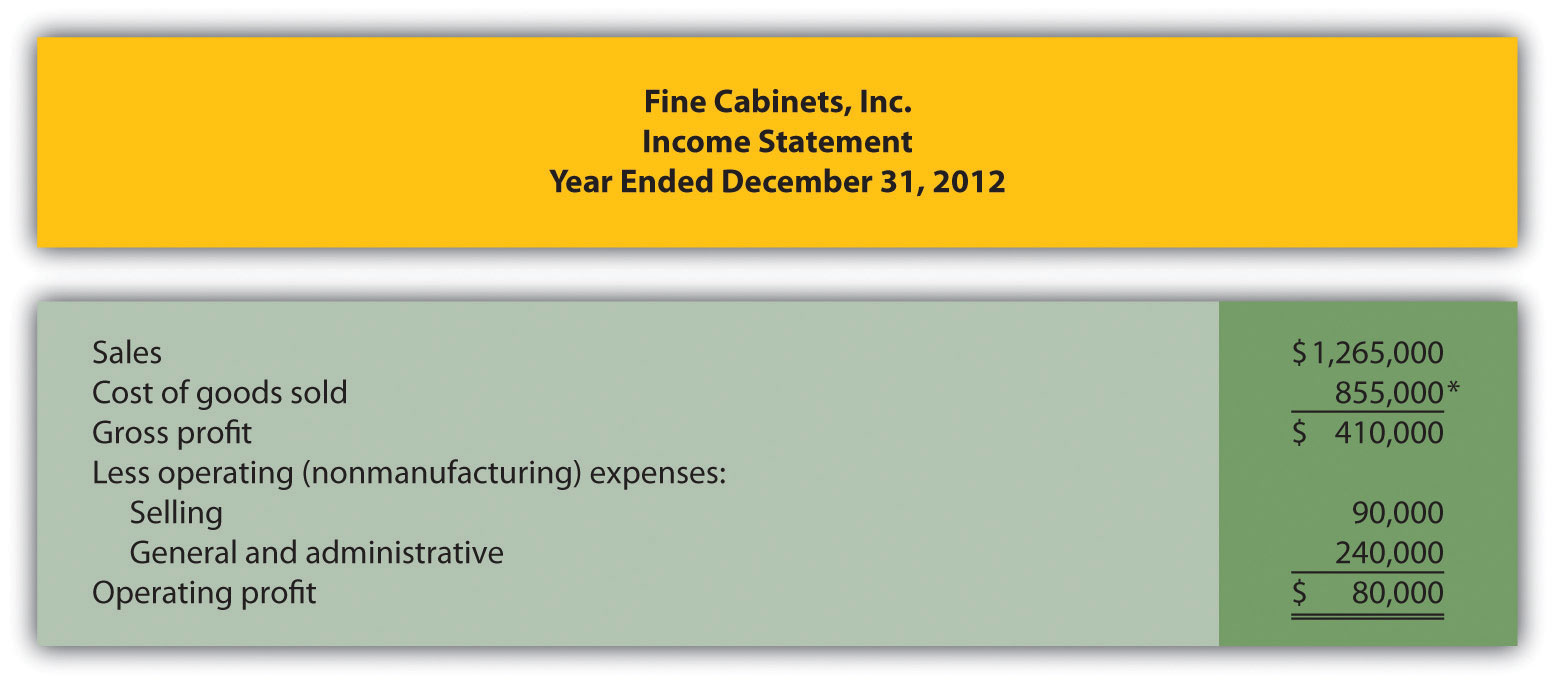
*$855,000 comes from the cost of goods sold (TO) in part 1c.
-
-
End-of-Chapter Exercises
Questions
- Describe the characteristics of managerial accounting and financial accounting.
- What are nonfinancial measures of performance? Provide several examples.
-
Which accountant (financial or managerial) would prepare each of the following reports:
- Income statement for the Chevrolet division of General Motors
- Balance sheet for PepsiCo prepared in accordance with U.S. GAAP
- The Boston Symphony Orchestra’s budgeted income statement for next quarter
- Defect rate of computer chips produced by Intel
- Statement of cash flows for Hewlett-Packard prepared in accordance with U.S. GAAP
- Describe the planning and control functions performed by most managers.
- What is the controller’s primary responsibility?
- How do the treasurer’s responsibilities differ from those of the controller?
- Explain why ethical behavior is so important for finance and accounting personnel.
- Briefly summarize the Institute of Management Accountants (IMA) Statement of Ethical Professional Practice shown in Figure 1.2 "IMA Statement of Ethical Professional Practice". What is the purpose of this statement?
- Review Note 1.27 "Business in Action 1.3" Why would the company’s former employees improperly record information as described here?
- Review Note 1.28 "Business in Action 1.4" Why is improving ethics a top priority for businesses, such as Home Depot and Hewlett-Packard?
- What is an enterprise resource planning system?
- Why do manufacturing companies use product costing systems to track costs throughout the production process?
- Describe manufacturing costs and nonmanufacturing costs. Provide examples of each.
- Describe the difference between direct materials and direct labor versus indirect materials and indirect labor.
- Why are the terms product costs and period costs used to describe manufacturing costs and nonmanufacturing costs?
- How does the timing of recording expenses differ between product and period costs?
- Review Note 1.43 "Business in Action 1.5" Why are items such as the hull, engine, transmission, carpet, and seats classified as direct materials and items such as glue, paint, and screws classified as indirect materials?
- Review Note 1.48 "Business in Action 1.6" Provide two examples of selling costs and two examples of general and administrative costs at PepsiCo.
- Describe the three inventory accounts used to record product costs.
- What are the three categories of product costs that flow through the work-in-process inventory account? Describe each one.
- When is the cost of goods sold account (often called cost of sales) used, and how is the dollar amount recorded in this account determined?
- Review Note 1.57 "Business in Action 1.7" What are the names and dollar amounts of the inventory accounts appearing on the balance sheet? What is the total amount of product costs recorded as an expense on the income statement for the year ended December 31, 2010?
- Describe the inventory cost flow equation and how it applies to the three schedules shown in Figure 1.7 "Income Statement Schedules for Custom Furniture Company".
- How does a merchandising company income statement differ from a manufacturing company income statement?
Brief Exercises
- Accounting Information at Sportswear Company. Refer to the dialogue between the president and accountant at Sportswear Company presented at the beginning of the chapter. Why can’t the president find information for each product line (hats and jerseys) in the financial statements? Who within the company typically provides this type of information?
- Financial Versus Managerial Accounting. Maria is the loan officer at a local bank that lends money to Old Town Market, a small grocery store. She requests several quarterly financial reports on an ongoing basis to assess the store’s ability to repay the loan. Provide one example of a financial accounting report and two examples of managerial accounting reports that Maria might request.
- Planning and Control. Two college graduates recently started a Web page design firm. The first month was just completed, and the owners are in the process of comparing budgeted revenues and expenses with actual revenues and expenses for the month. Would this be considered part of the planning function or the control function? Explain.
-
Finance and Accounting Personnel. Determine whether the chief financial officer, controller, treasurer, internal auditor, managerial accountant, financial accountant, or tax accountant would perform the following tasks. (Hint: Some job titles may be used more than once, and others may not be used at all.)
- Prepares annual reports for shareholders and creditors
- Provides a quarterly summary of financial results to the CEO and board of directors
- Provides profit and loss reports by product line
- Calculates estimated quarterly tax payments
- Oversees the treasurer and internal auditor
- Obtains sources of financing and manages short-term investments
- Verifies that annual report financial information is accurate
- Enterprise Resource Planning (ERP) System. Enterprise resource planning (ERP) systems are designed to record and share information across functional and geographical areas on a real-time basis. However, these systems tend to be costly to purchase and maintain. Why do organizations continue to invest millions of dollars in ERP systems in spite of the cost?
-
Manufacturing Cost Terms. Indicate whether each of the following costs associated with production would be classified as direct materials, direct labor, or manufacturing overhead.
- Salaried supervisor responsible for several product lines
- Hourly workers assembling goods
- Grease used to maintain machines
- Maintenance personnel
- Bike frame used to build a racing bike
- Factory property taxes
- Glue used to assemble toys
-
Manufacturing Cost Terms. Indicate whether each of the following costs associated with production would be classified as direct materials, direct labor, or manufacturing overhead.
- Depreciation on production equipment
- Paint used to produce wagons
- Accounting staff performing tax services for a client
- Nails used to assemble cabinets
- Fiberglass used to produce a custom boat
- Hourly workers assembling goods
- Factory utilities
-
Manufacturing and Nonmanufacturing Cost Terms. Burns Company incurred costs for the following items.
- Salary of chief financial officer
- Factory insurance
- Salary for salespeople
- Raw materials used in production easily traced to the product
- Computer equipment depreciation for accounting department
- Insurance for headquarters building
- Production line workers
- Clerical support for production supervisors
Required:
- Indicate whether each item should be categorized as a product or period cost.
- Indicate whether each item should be categorized as direct materials, direct labor, manufacturing overhead, selling, or general and administrative.
-
Manufacturing and Nonmanufacturing Cost Terms. Leighton, Inc., incurred costs for the following items.
- Janitorial services in the production facility
- Personnel department supplies
- Shipping costs for raw materials purchased from a supplier, easily traced to the product
- Newspaper advertisements
- Supervisor of several production lines
- Insurance for factory equipment
- Production line workers
- Clerical support for sales staff
Required:
- Indicate whether each item should be categorized as a product or period cost.
- Indicate whether each item should be categorized as direct materials, direct labor, manufacturing overhead, selling, or general and administrative.
-
Accounts Used to Record Product Costs. Match each of the following accounts with the appropriate description that follows.
- _____ Raw materials inventory
- _____ Work-in-process inventory
- _____ Finished goods inventory
- _____ Cost of goods sold
- Used to record product costs associated with goods that are sold
- Used to record the cost of materials not yet put into production
- Used to record product costs associated with goods that are complete and ready to sell
- Used to record product costs associated with incomplete goods in the production process
-
Income Statement Terminology: Manufacturing Versus Merchandising. Match each of the following terms used in a manufacturing company’s income statement with the equivalent term used in a merchandising company’s income statement.
Manufacturing Company
- _____ Cost of goods manufactured
- _____ Work-in-process inventory
- _____ Finished goods inventory
- _____ Cost of goods sold
Merchandising Company
- Merchandise inventory
- Same term is used by a merchandising company
- Net purchases
- Not applicable for a merchandising company.
Exercises: Set A
-
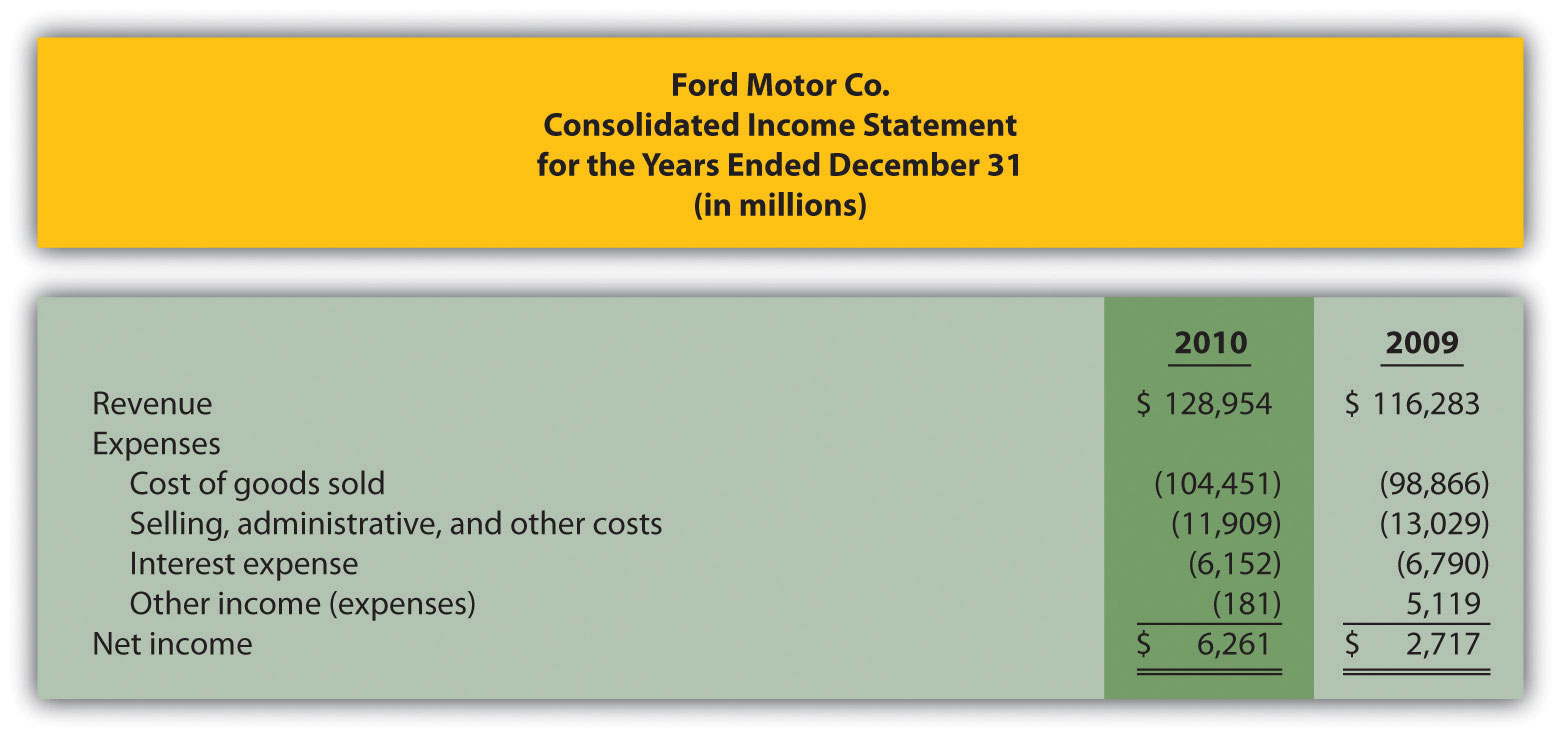
Financial Versus Managerial Accounting (Manufacturing). The income statement from Ford’s annual report appears as follows in summary form. (This information was obtained from the company’s Web site, http://www.ford.com.)
Required:
- The financial information in the company’s annual report was prepared primarily for shareholders and creditors in accordance with U.S. Generally Accepted Accounting Principles (U.S. GAAP). Does the income statement provide enough detailed information for managers at Ford? Explain.
- Provide at least three additional detailed pieces of financial information that would help managers evaluate performance at Ford.
- Provide at least two nonfinancial measures that would help managers evaluate performance at Ford.
-
Organizational Structure. The following list of personnel within organizations comes from Figure 1.2 "IMA Statement of Ethical Professional Practice".
- Board of directors
- Chief financial officer
- Controller
- Managerial accountant
- Financial accountant
- Tax accountant
- Treasurer
- Internal auditor
Required:
Match each previous item with the most accurate description as follows.
- Assists in preparing information used for decision making within the organization
- Assists in preparing tax reports for governmental agencies, including the Internal Revenue Service
- Responsible for confirming that controls within the company are effective in ensuring accurate financial data, and serves as an independent link with the board of directors
- Responsible for all finance and accounting functions within the organization and typically reports to the chief executive officer
- Elected by the shareholders of the company
- Oversees the managerial accountant, financial accountant, and tax accountant
- Responsible for obtaining financing for the organization, projecting cash flow needs, and managing cash and short-term investments
- Assists in preparing financial information, usually in accordance with U.S. GAAP, for those outside the company
-
Schedule of Raw Materials Placed in Production. The balance in Sedona Company’s raw materials inventory account was $110,000 at the beginning of September and $135,000 at the end of September. Raw materials purchased during the month totaled $50,000. Sedona used $8,000 in indirect materials for the month.
Required:
Prepare a schedule of raw materials placed in production for the month of September.
-
Schedule of Cost of Goods Manufactured. The balance in Reid Company’s work-in-process inventory account was $300,000 at the beginning of March and $320,000 at the end of March. Manufacturing costs for the month follow.
Direct materials (from the schedule of raw materials placed in production) $ 40,000 Direct labor $ 70,000 Manufacturing overhead $200,000 Required:
Prepare a schedule of cost of goods manufactured for the month of March.
-
Schedule of Cost of Goods Sold. The balance in Blue Oak Company’s finished goods inventory account was $25,000 at the beginning of September and $28,000 at the end of September. Cost of goods manufactured for the month totaled $17,000.
Required:
Prepare a schedule of cost of goods sold for the month of September.
-
Income Statement. Auto Products, Inc., had the following activity for the month of October.
Sales revenue $1,100,000 Selling expenses $ 300,000 General and administrative expenses $ 230,000 Cost of goods sold $ 475,000 Required:
Prepare an income statement for the month of October.
Exercises: Set B
-
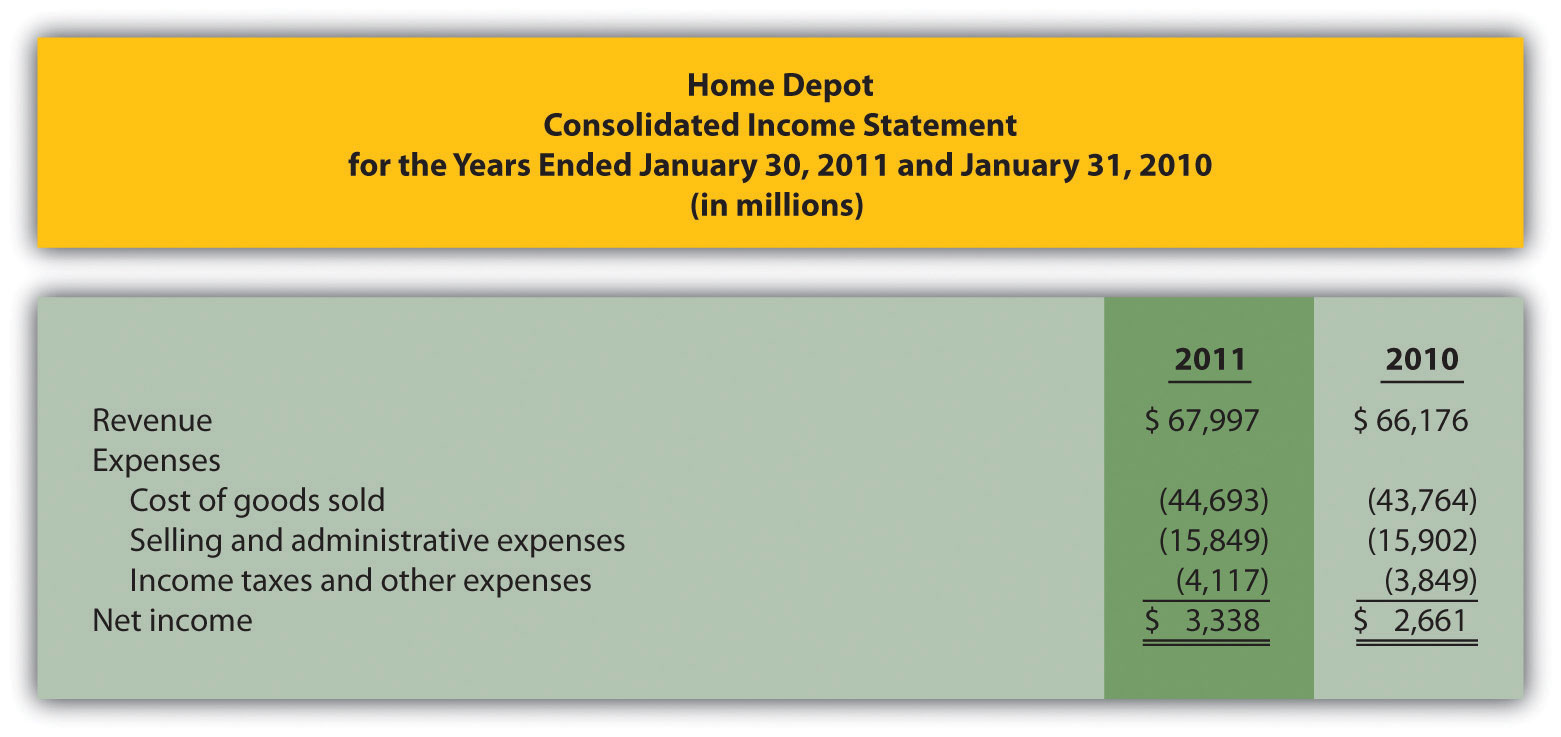
Financial Versus Managerial Accounting (Merchandising). Home Depot’s annual report appears as follows in summary form. (This information was obtained from the company’s Web site, http://www.homedepot.com.)
Required:
- The financial information in the company’s annual report was prepared primarily for shareholders and creditors in accordance with U.S. GAAP. Does the income statement provide enough detailed information for managers at Home Depot? Explain.
- Provide at least three additional detailed pieces of financial information that would help managers evaluate performance at Home Depot.
- Provide at least two nonfinancial measures that would help managers evaluate performance at Home Depot.
-
Organizational Structure. The following list of personnel within organizations comes from Figure 1.2 "IMA Statement of Ethical Professional Practice".
- Board of directors
- Chief financial officer
- Controller
- Managerial accountant
- Financial accountant
- Tax accountant
- Treasurer
- Internal auditor
Required:
Match each previous item with the most accurate description as follows:
- Responsible for hiring and overseeing the chief executive officer
- Assists in preparing financial information for those outside the company, such as shareholders and bondholders
- Responsible for reviewing internal controls within the company and ensuring accurate financial data
- Responsible for controller, treasurer, and internal auditor functions within the organization
- Responsible for projecting cash flow needs and managing cash and short-term investments
- Oversees the managerial accountant, financial accountant, and tax accountant
- Prepares profit information by product, which is used for decision making within the organization
- Assists in establishing tax strategies for the organization
-
Schedule of Raw Materials Placed in Production. The balance in Clay Company’s raw materials inventory account was $45,000 at the beginning of April and $38,000 at the end of April. Raw materials purchased during the month totaled $55,000. Clay used $14,000 in indirect materials for the month.
Required:
Prepare a schedule of raw materials placed in production for the month of April.
-
Schedule of Cost of Goods Manufactured. The balance in the work-in-process inventory account of Verdi Production, Inc., was $900,000 at the beginning of May and $750,000 at the end of May. Manufacturing costs for the month follow.
Direct materials (from the schedule of raw materials placed in production) $340,000 Direct labor $810,000 Manufacturing overhead $660,000 Required:
Prepare a schedule of cost of goods manufactured for the month of May.
-
Schedule of Cost of Goods Sold. The balance in Posada Company’s finished goods inventory account was $650,000 at the beginning of March and $625,000 at the end of March. Cost of goods manufactured for the month totaled $445,000.
Required:
Prepare a schedule of cost of goods sold for the month of March.
-
Income Statement. Game Products, Inc., had the following activity for the month of June.
Sales revenue $800,000 Selling expenses $100,000 General and administrative expenses $200,000 Cost of goods sold $360,000 Required:
Prepare an income statement for the month of June.
Problems
-
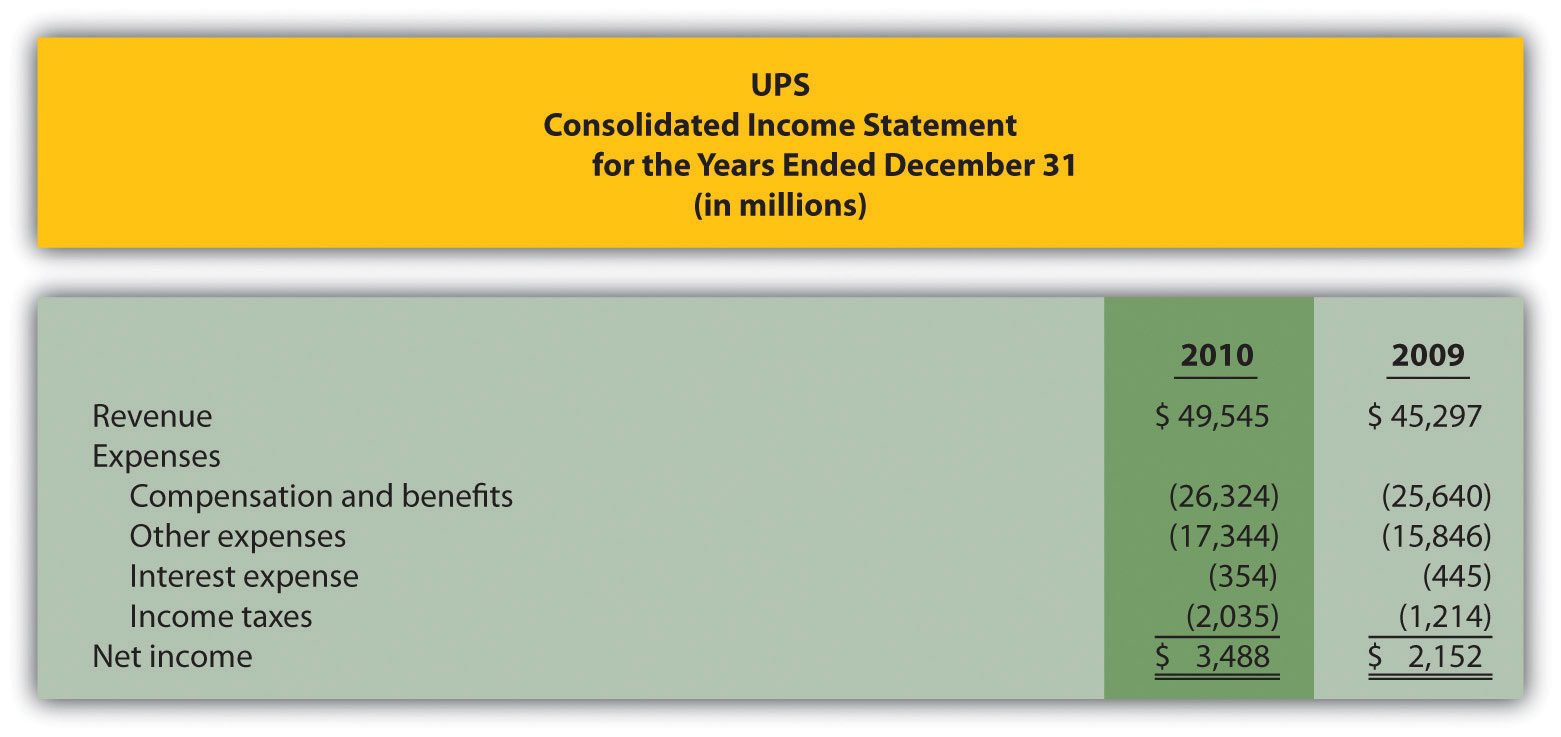
Financial Versus Managerial Accounting (Service). The income statement from the annual report of United Parcel Service (UPS) appears as follows in summary form. (This information was obtained from the company’s Web site, http://www.ups.com.)
Required:
- The financial information in the company’s annual report was prepared primarily for shareholders and creditors in accordance with U.S. GAAP. Does the income statement provide enough detailed information for managers at UPS? Explain.
- Provide at least three additional detailed pieces of financial information that would help managers evaluate performance at UPS.
- Provide at least two nonfinancial measures that would help managers evaluate performance at UPS.
-
Income Statement and Supporting Schedules. The following financial information is for Industrial Company. (Note that the most current financial information is presented in the first column.)
December 31, 2011 December 31, 2010 Raw materials inventory $ 24,000 $ 30,000 Work-in-process inventory 1,800,000 1,650,000 Finished goods inventory 1,050,000 1,230,000 Of the total raw materials placed in production for the year, $36,000 was for indirect materials. Industrial had $3,795,000 in sales for the year ended December 31, 2011. The company also had the following costs for the year:
Selling $ 270,000 General and administrative $ 720,000 Raw materials purchases $ 300,000 Direct labor used in production $ 375,000 Manufacturing overhead $1,890,000 Required:
- Prepare a schedule of raw materials placed in production for the year ended December 31, 2011.
- Prepare a schedule of cost of goods manufactured for the year ended December 31, 2011.
- Prepare a schedule of cost of goods sold for the year ended December 31, 2011.
- Prepare an income statement for the year ended December 31, 2011.
- Describe the three types of costs included in cost of goods sold on the income statement. (Dollar amounts are not necessary in your descriptions.)
-
Income Statement and Supporting Schedules. The following financial information is for Danville Company. (Note that the most current financial information is presented in the first column.)
December 31, 2011 December 31, 2010 Raw materials inventory $ 8,000 $ 10,000 Work-in-process inventory 600,000 550,000 Finished goods inventory 350,000 410,000 Of the total raw materials placed in production for the year, $12,000 was for indirect materials. Danville had $1,265,000 in sales for the year ended December 31, 2011. The company also had the following costs for the year:
Selling $ 90,000 General and administrative $240,000 Raw materials purchases $100,000 Direct labor used in production $125,000 Manufacturing overhead $630,000 Required:
- Prepare a schedule of raw materials placed in production for the year ended December 31, 2011.
- Prepare a schedule of cost of goods manufactured for the year ended December 31, 2011.
- Prepare a schedule of cost of goods sold for the year ended December 31, 2011.
- Prepare an income statement for the year ended December 31, 2011.
- Describe the three types of costs included in cost of goods manufactured. (Dollar amounts are not necessary in your descriptions.)
-
Income Statement and Supporting Schedules. The following information is for Ciena, Inc., for the year ended December 31, 2011.
Raw materials inventory beginning balance $ 15,000 Raw materials inventory ending balance $ 12,000 Work-in-process inventory beginning balance $ 825,000 Work-in-process inventory ending balance $ 900,000 Finished goods inventory beginning balance $ 615,000 Finished goods inventory ending balance $ 525,000 Raw material purchases $ 150,000 Direct labor used in production $ 187,500 Manufacturing overhead $ 945,000 Selling costs $ 135,000 General and administrative $ 360,000 Sales revenue $1,897,500 Of the total raw materials placed in production for the year, $18,000 was for indirect materials.
Required:
- Prepare a schedule of raw materials placed in production for the year ended December 31, 2011.
- Prepare a schedule of cost of goods manufactured for the year ended December 31, 2011.
- Prepare a schedule of cost of goods sold for the year ended December 31, 2011.
- Prepare an income statement for the year ending December 31, 2011.
-
Income Statement and Supporting Schedules. The following information is for Diablo, Inc., for the year ended December 31, 2011.
Raw materials inventory beginning balance $ 60,000 Raw materials inventory ending balance $ 48,000 Work-in-process inventory beginning balance $3,300,000 Work-in-process inventory ending balance $3,600,000 Finished goods inventory beginning balance $2,460,000 Finished goods inventory ending balance $2,100,000 Raw material purchases $ 600,000 Direct labor used in production $ 750,000 Manufacturing overhead $3,780,000 Selling costs $ 540,000 General and administrative $1,440,000 Sales revenue $7,590,000 Of the total raw materials placed in production for the year, $72,000 was for indirect materials.
Required:
- Prepare a schedule of raw materials placed in production for the year ended December 31, 2011.
- Prepare a schedule of cost of goods manufactured for the year ended December 31, 2011.
- Prepare a schedule of cost of goods sold for the year ended December 31, 2011.
- Prepare an income statement for the year ending December 31, 2011.
One Step Further: Skill-Building Cases
-
Ethics: Accounting for Obsolete Inventory. High Tech, Inc., is a public company that produces laser and ink jet printers. Jorge is an accounting staff member who works for the company’s controller and is involved in preparing the annual report. One of High Tech’s competitors developed a superior color laser jet printer using a less costly production process. Jorge realizes that High Tech’s substantial inventory of color laser jet printers is effectively obsolete and will have to be written down to its net realizable value in accordance with U.S. GAAP. This means higher expenses and lower profits.
Jorge’s boss, the controller, is aware of the situation but the chief financial officer is not. In fact, the controller told the CFO that High Tech does not have any obsolete inventory. Both Jorge’s boss and the CFO receive bonuses tied to the company’s profits. The outside auditors are completing the audit and are unaware of the obsolete inventory.
Required:
How should Jorge handle this situation? Use the IMA’s Statement of Ethical Professional Practice shown in Figure 1.2 "IMA Statement of Ethical Professional Practice" as a guide to answering this question.
- Internet Project: Institute of Management Accountants. Go to the Web site of the Institute of Management Accountants (http://www.imanet.org). Review various parts of the site (e.g., About IMA or Certification) and write a one-page summary of your findings.
- Internet Project: American Institute of Certified Public Accountants. Go to the Web site of the American Institute of Certified Public Accountants (AICPA; http://www.aicpa.org). Review various parts of the site (e.g., About the AICPA or Professional Resources) and write a one-page summary of your findings.
-
Internet Project: Sarbanes-Oxley Act of 2002. Go to the Securities and Exchange Commission’s Web site (http://www.sec.gov) and click on Laws and Regulations. Click on the full text of the Sarbanes-Oxley Act of 2002.
Required:
- Go to section 302, Corporate Responsibility for Financial Reports, and summarize the six requirements in this section. Assume you are the chief financial officer of a public company. What concerns might you have about these requirements?
- Go to section 404, subsection a, Management Assessment of Internal Controls. Assume you are an executive officer of a public company. What two items are you required to present in the annual report?
- Ethics: Companies Accused of Committing Fraud. Using a source like The Wall Street Journal, BusinessWeek, or an Internet search engine, find an article about an organization accused of committing accounting fraud. Write a one-page summary of your findings. Include a copy of the article with your summary.
- Internet Project: Finding Company with Ethics Policy. Using the Internet, find a company that has standards for ethical behavior. (Some companies refer to these standards as a “code of ethics”; others may use different terminology.) Write a one-page summary of your findings.
- Group Activity: Inventory Accounts for Manufacturing Company. In groups of two to four students, use the Internet to find a manufacturing company that presents three inventory accounts on the balance sheet or in the notes to the financial statements. Include a printout of your findings, and explain what each account and related dollar amount represents.
Comprehensive Case
-
Ethics: Accounting for Revenues and Expenses. Equipment Group produces excavating equipment for contractors. Equipment Group is working on the annual financial statements for its shareholders, who are expecting profits of $200,000,000 for the year ending December 31. The controller (Jeff) and CFO (Kathy) will receive bonuses totaling 50 percent of their salaries if company profits exceed $200,000,000. Sarah is a staff accountant who works for the controller. One week before the end of the fiscal year, a customer decides to delay a significant purchase of equipment until March of the next year. As a result, Equipment Group’s profits will decrease by $2,000,000 to $198,000,000 for the year.
Jeff, the controller, approaches Sarah and asks her to think of a way to increase profits by $2,500,000. He suggests looking at sales occurring in early January and perhaps moving them up to December. He also hints that some December expenses could be pushed back and recorded in January.
Required:
- Is there a problem with the controller’s request? Explain your answer.
- How should Sarah handle this situation? There are many possible steps, as described in the IMA’s Statement of Ethical Professional Practice shown in Figure 1.2 "IMA Statement of Ethical Professional Practice".
- What are the potential consequences for Sarah if she agrees to do what Jeff suggests?


